Abstract
The glial cell line-derived neurotrophic factor (GDNF) family ligands (GFLs) support the survival and functioning of various neuronal populations. Thus, they could be attractive therapeutic agents against a multitude of neurodegenerative diseases caused by progressive death of GFLs responsive neurons. Small-molecule ligands BT13 and BT18 show an effect on GDNF family receptor GFRα1 and RET receptor tyrosine kinase RetA function. Thus, their potential binding sites and interactions were explored in the GDNF–GFRα1–RetA complex using molecular docking calculations as well as molecular dynamics (MD) simulations. Three possible regions were examined: the interface between GDNF and GFRα1 (region A), the RetA interface with GFRα1 (region B), and a possible allosteric site in GFRα1 (region C). The results obtained by the docking calculations and the MD simulations indicate that the preferable binding occurs at the allosteric site. A less preferable binding site was detected on the RetA surface interfacing GFRα1. In the membrane-bound state of RetA this can enable compounds BT13 and BT18 to act as direct RetA agonists. The analysis of the MD simulations shows hydrogen bonds for BT13 and significant hydrophobic interactions with GFRα1 for BT13 and BT18 at the allosteric site.
Introduction
The glial cell line-derived neurotrophic factor (GDNF) family ligands (GFLs), which consist of GDNF, neurturin (NRTN), artemin (ARTN), and persephin (PSPN), regulate the development and maintenance of the nervous system.1 It has been shown that GDNF protects and repairs brain dopamine-producing neurons, which degenerate in Parkinson’s disease, and motoneurons, which die in amyotrophic lateral sclerosis. In addition, GDNF, NRTN, and ARTN support the survival and regulate the differentiation of many peripheral neurons, including sympathetic, parasympathetic, sensory, and enteric neurons.2
The GFLs could therefore be attractive therapeutic agents against a multitude of neurodegenerative diseases caused by the extensive death of GFLs dependent neurons. Unfortunately, the systemic delivery of GFLs into the central nervous system neurons is complicated because of their poor pharmacokinetic properties and bioavailability that are common to large proteins. The delivery to the brain through invasive approaches such as neurosurgery, viral vectors, or by the use of encapsulated cells is also associated with multiple obstacles. Consequently, small molecules that specifically activate GFL receptors and that can be easily delivered to the target neuronal populations would overcome most of these problems.3
The first small molecules that mimic the effects of the different GFLs have been recently reported.4−7 The high-throughput screening of a library consisting of 18 400 drug-like compounds had enabled identifying compound code-named BT13 (N,N-diethyl-3-[4-[4-fluoro-2-(trifluoromethyl)benzoyl]piperazin-1-yl]-4-methoxybenzenesulfonamide) as a compound that selectively targeted GFL receptor RET to activate downstream signaling cascades.4,5 It was found that BT13 activated luciferase in reporter-gene based systems in GFRα1/RET, GFRα3/RET, and RET reporter cell lines with comparable potency and efficacy at micromolar concentrations. The further rational design lead to a compound BT18 ([4-[5-[(6,7-dimethoxy-3,4-dihydro-1H-isoquinolin-2-yl)sulfonyl]-2-methoxyphenyl]piperazin-1-yl]-[4-fluoro-2-(trifluoromethyl)phenyl]methanone) with similar properties.6 Both compounds demonstrated efficacy in rat model of experimental neuropathy.5,6 However, the molecular mechanism of the RET activation by the small-molecule ligands BT13 and BT18 remained unclear.
Therefore, to elucidate this question and to enable a rational design of more potent mimetics of GDNF, it would be highly interesting to examine the possible interaction between these known compounds with GDNF receptor complex consisting of ligand-binding subunit GFRα1 and signal transducing module transmembrane receptor tyrosine kinase RetA.
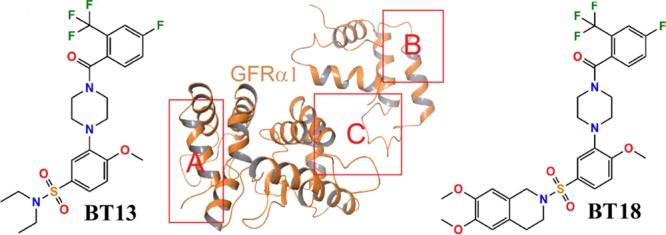
The aim of this study is therefore to explore the possible binding sites and interactions of a small-molecule ligand BT135 and its derivative BT186 (Figure 1) with protein GFRα1 and GFRα1–RetA interface. These compounds are known to have an effect on GFRα1 and RetA functions.5,6 Molecular dynamics (MD) simulations8−10 may help to elucidate the binding site and time dynamics of interacting amino acid residues and to extend the information obtained from previous docking studies.
Figure 1.
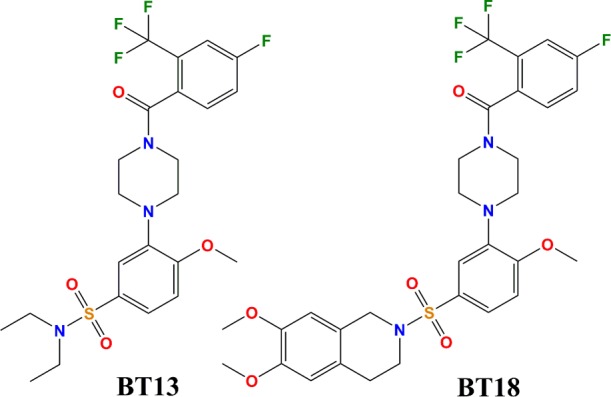
Chemical structures of small-molecule ligands BT13 and BT18.
Results and Discussion
Molecular Docking
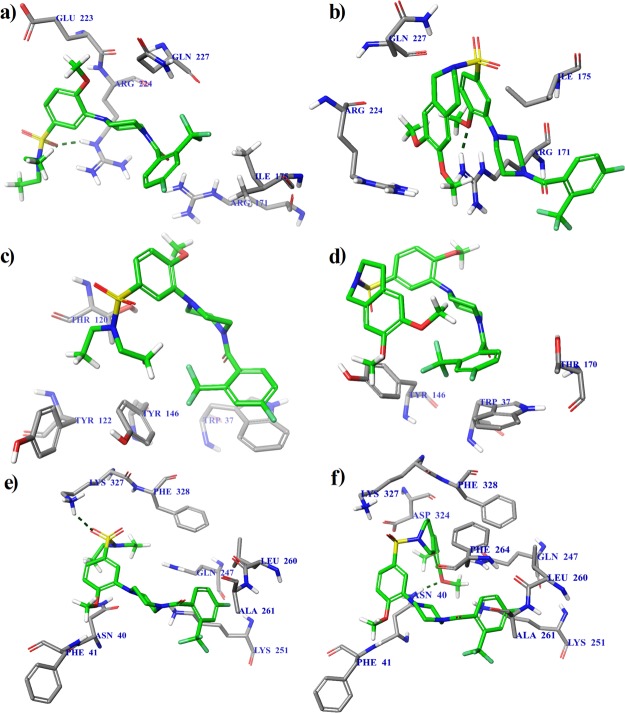
Three possible regions in the receptor GFRα1 and RetA were examined to find the potential binding poses of compounds BT13 and BT18, using subunits of the protein structure from the GDNF–GFRα1–RetA complex (PDB code: 4UX8;11 see Computational Methods). These included the interface between GDNF and GFRα1 (region A in Figure 2), the RetA interface with GFRα1 (region B in Figure 2), and a possible allosteric site in GFRα1 (region C in Figure 2). In region A, the small-molecule ligands would directly mimic the effect by binding GDNF to the receptor GFRα1. In region B that is located in the surface of RetA, the effect of small compounds would be similar to GDNF-activated GFRα1. Finally, there can be allosteric conformational changes in GFRα1 due to the binding of small-molecule ligands and leading to the activation of the complex (region C). Results from molecular docking indicate that the preferable binding occurs at the allosteric site for both ligands (see Figure 3). The docking score to region C is −7.9 kcal/mol for compound BT13, being 1.9 and 1.2 kcal/mol lower compared to the binding score for regions A and B, respectively; and −9.8 kcal/mol for compound BT18 to region C, being 3.4 and 2.3 kcal/mol lower than for the binding at other two regions.
Figure 2.
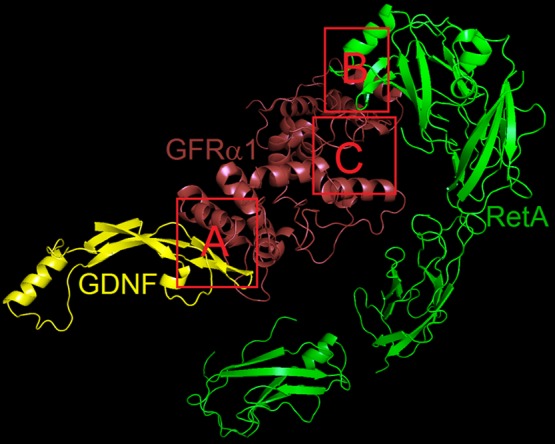
Potential binding sites of small-molecule ligands in the GDNF–GFRα1–RetA complex.
Figure 3.
Calculated binding modes of the protein-ligand complexes: (a) GFRα1–BT13 at the GDNF–GFRα1 interface, region A (ΔGbind = −6.0 kcal/mol); (b) GFRα1-BT18 at the GDNF–GFRα1 interface, region A (ΔGbind = −6.4 kcal/mol); (c) RetA–BT13 at the RetA–GFRα1 interface, region B (ΔGbind = −6.7 kcal/mol); (d) RetA-BT18 at the RetA–GFRα1 interface, region B (ΔGbind = −7.5 kcal/mol); (e) GFRα1–BT13 at the allosteric site, region C (ΔGbind = −7.9 kcal/mol); and (f) GFRα1–BT18 at the allosteric site, region C (ΔGbind = −9.8 kcal/mol). The amino acid residues of protein (PDB code: 4UX8) are colored as gray (carbon), blue (nitrogen), red (oxygen), and white (hydrogen). Intermolecular hydrogen bonds are shown by dashed lines.
It has been noted5,6 that both BT13 and BT18 also act as RetA direct agonists. While the present calculations indicate the preferable binding to the allosteric site at region C, the binding site at RetA interface with GFRα1 (region B) may become preferential in membrane-bound state of RetA, with altered conformation as compared to the protein structure in single-particle state used in the measuring of structure (PDB code: 4UX8). The binding mode at the RetA interface with GFRα1 (region B) involves hydrophobic interactions between compound BT13 and residues of Thr120, Tyr122, and Tyr146 as well as stacking (π–π) interactions between the aromatic rings of BT13 and Trp37 (Figure 3c). BT18 also makes hydrophobic contacts to Tyr146 and Thr170 and π–π interactions with Trp37 (Figure 3d).
The binding mode at the allosteric site (region C) involves hydrogen bonding between the sulfonyl group of the ligand BT13 and the ammonium group of Lys327 of the receptor GFRα1, in addition to hydrophobic contacts with Asn40, Phe41, Gln247, Lys251, Leu260, Ala261, and Phe328 (Figure 3e). The ligand BT18 is hydrogen bonded by a methoxy group to the amine group of Asn40 of GFRα1 and has additional hydrophobic interactions with residues of Phe41, Gln247, Lys251, Leu260, Ala261, Phe264, Asp324, Lys327, and Phe328 (Figure 3f).
To verify our results obtained by using protein structure of GDNF–GFRα1–RetA complex (PDB code: 4UX8), calculations using crystal structure of the GDNF–GFRα1 complex (PDB code: 3FUB;12 see Computational Methods) were carried out as a control. The GFRα1 parts of both structures overlap very well (Figure 4a). The binding modes of ligands BT13 and BT18 are almost identical at the GDNF–GFRα1 interface (Figure 4b,c) but somewhat different at the allosteric site (Figure 4d,e), although the interacting residues of GFRα1 are mostly the same. A possible reason is discussed below, in the next section. All results of molecular docking for BT13 and BT18 are presented in the Supporting Information in Table S1.
Figure 4.
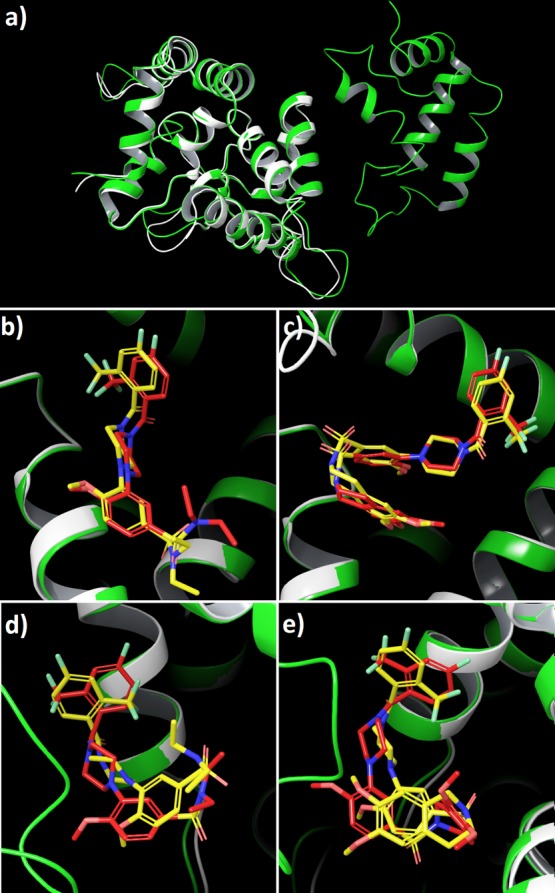
Comparison of the binding of compounds BT13 and BT18 to protein structures 4UX8 (green) and 3FUB (white). (a) 4UX8 and 3FUB; (b) compound BT13 at the GDNF–GFRα1 interface, region A; (c) compound BT18 at the GDNF–GFRα1 interface, region A; (d) compound BT13 at the allosteric site of GFRα1, region C; (e) compound BT18 at the allosteric site of GFRα1, region C. In each graph (b–e), the ligand conformation with protein structure 3FUB is in yellow and the ligand conformation with protein structure 4UX8 in red.
MD with Desmond Simulation Package
The docking calculations were followed by MD simulations using Desmond package on the three potential binding sites at regions A, B, and C, respectively. The root mean square deviation (rmsd) of the atomic positions behavior is notably large for the regions corresponding to the GDNF–GFRα1 interface (region A) and RetA (region B) (see Figure S1a–d). Smaller rmsd variations show the stability of the ligand binding. Notably, in the simulation of compounds BT13 and BT18 binding to the region C that corresponds to the allosteric site on the receptor GFRα1, there is no large variation of this parameter (Figure S1e,f). Thus, in accordance with the molecular docking results, this binding site is preferable.
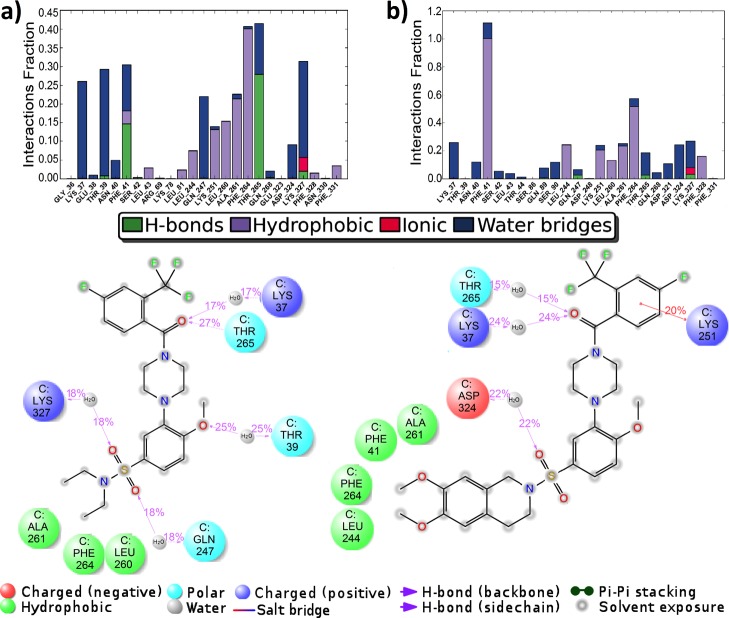
The location of the binding modes of compounds BT13 and BT18 were also confirmed by the counterpart MD modeling. The results at the allosteric site are however somewhat different from that obtained in molecular docking calculations. There is significant hydrophobic interaction between the ligand BT13 and the receptor GFRα1 around protein residues Lys251 to Phe264 (see the protein–ligand contacts diagram in Figure 5a). Hydrogen bonding is involved in interactions with the residues Phe41 and Thr265. Notably, the interactions over the water molecule bridges are rather significant, for example, the water-assisted ionic contact to Lys327, which was also shown by the docking results. The ligand BT18 shows a very strong hydrophobic interaction with the residue Phe41 (being in hydrophobic contact almost 100% of MD simulation time) besides other hydrophobic interactions around protein residues Leu244 to Phe264 (see the protein–ligand contacts diagram in Figure 5b). The water-assisted bindings are also represented. The binding modes of the ligands at the regions A and B are quite similar to the docking calculations and are given in the Supporting Information (Figures S2 and S3, respectively).
Figure 5.
Desmond MD calculated protein–ligand contacts at the allosteric site, region C: (a) GFRα1–BT13; (b) GFRα1–BT18. Protein code: 4UX8.
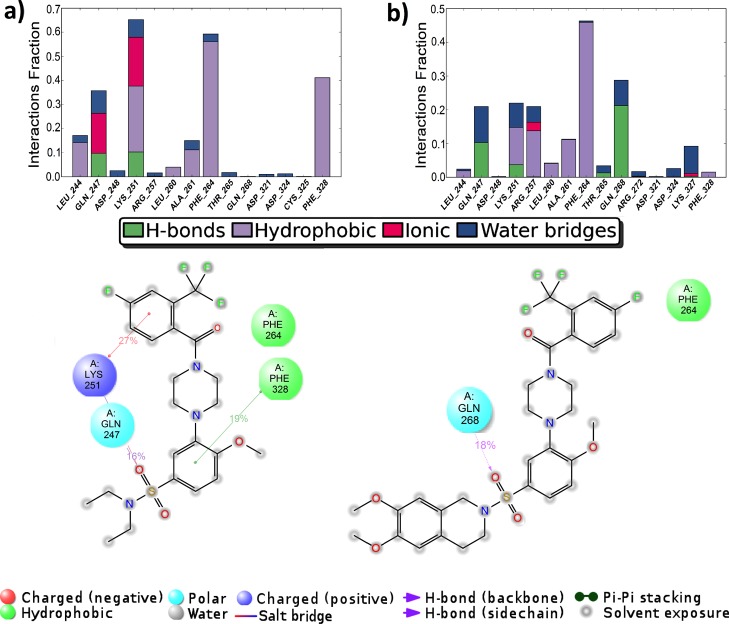
MD simulations were also repeated with the crystal structure of GDNF–GFRα1 complex (3FUB12) for BT13 and BT18 (see the corresponding rmsd of the atomic positions for ligands and protein in Figure S4, protein–ligand contacts at the GDNF–GFRα1 interface in Figure S5, and at the allosteric site in Figure 6). The results obtained for binding at the GDNF–GFRα1 interface are similar, however, somewhat different at the allosteric site for two protein structures used in this study (4UX8 and 3FUB). In fact, GFRα1 consists of domains D1, D2, and D3, whereas D1 is not needed for GDNF binding,12 it binds to RetA in the full structure in 4UX8.11 According to our calculations, D1 has an effect on protein–ligand interactions at the allosteric site as well as it would be significant in determining the signaling-related conformational changes. Anyway, no interaction between RET and GDNF or GFRα1 co-receptor individually was detectable.11
Figure 6.
Desmond MD calculated protein–ligand contacts at the allosteric site, region C: (a) GFRα1–BT13; (b) GFRα1–BT18. Protein code: 3FUB.
To specify the nature of the protein–ligand interactions, the molecular mechanics/Poisson–Boltzmann surface area (MM/PBSA)13 binding energy calculations were carried out using data from MD simulations. In MM/PBSA, the free energy of a state (ligand, protein, or complex) is estimated from the following sum:
| 1 |
where the first three terms are standard MM energy terms from bonded (bond, angle, and dihedral), electrostatic, and van der Waals interactions, respectively. Gpol and Gnp are the polar and nonpolar contributions to the solvation free energies, respectively. Gpol is typically obtained by solving the Poisson–Boltzmann equation or by using the generalized Born (GB) model (giving the MM/GBSA approach), whereas the nonpolar term is estimated from a linear relation to the solvent accessible surface area. The last term in the above equation is the absolute temperature, T, multiplied by the entropy, S, estimated by a normal-mode analysis of the vibrational frequencies. The results for binding energy states14 at different sites are given in Table 1. The allosteric site on the receptor GFRα1 is predicted to be notably more preferable for binding the small-molecule ligands. The corresponding binding free energy is −50.9 kcal/mol for ligand BT13, being 3.4 and 2.4 kcal/mol lower compared with the binding energy for regions A and B, respectively; −55.7 kcal/mol for ligand BT18, being 5.0 and 5.9 kcal/mol lower than that for the other potential binding regions.
Table 1. Binding Free Energies (in kcal/mol) of the Protein–Ligand Complexes at Different Sites Calculated Using the MM/GBSA Method.
| BT13 |
BT18 |
|||||
|---|---|---|---|---|---|---|
| energy term | region A | region B | region C | region A | region B | region C |
| ΔEH-bnd | –0.90 | –0.01 | –0.61 | –2.58 | –0.10 | –0.77 |
| ΔEcovalent-bnd | 2.49 | 6.87 | 3.43 | 6.57 | 4.85 | 10.35 |
| ΔEel | 9.81 | 27.74 | 28.07 | 20.34 | 23.41 | 28.56 |
| ΔEvdW | –30.15 | –34.45 | –45.43 | –28.89 | –37.35 | –53.70 |
| ΔEπ–π | –0.39 | –5.57 | –0.30 | –0.32 | –2.95 | –0.79 |
| ΔGpol | –5.63 | –14.93 | –13.41 | –11.64 | –11.41 | –13.56 |
| ΔGnp | –22.76 | –28.12 | –22.64 | –34.20 | –26.29 | –25.79 |
| ΔGbind | –47.53 | –48.47 | –50.89 | –50.73 | –49.84 | –55.70 |
MD with AMBER Package
To check if the binding of BT13 was stable at site C with a different program and force field, additional AMBER simulations on compound BT13 were carried out at the allosteric site of GFRα1, using the crystal structure of domain 3 of GFRα1 (PDB code: 1Q8D(15)). The simulations were stable throughout the whole trajectories, as shown by small variation of energy, volume, and pressure through time. The rmsd of the ligand seen in Figure S6 shows a stable binding interaction with small deviations from the initial position. The rmsd of the alpha carbons of the protein also shows stability in the protein structure shown in Figure S7. In this respect, simulation with AMBER reproduced the stable binding and complex formation at site C.
Analysis of the trajectories showed that the loop of residues Pro32 to Cys40 was the most mobile part of the protein, with the loop closing in on top of ligand BT13. Among the most mobile residues in this loop were Arg35 (Arg272 in the full structure in 4UX8) with an rmsd per residue of 7.9 Å as shown in Table S2, Figure 7, and Figure S8, along with the edge residue Tyr17 (Tyr254 in the full structure in 4UX8) of 9.3 Å, as compared to the average value of 6.4 Å for all protein residues and the ligand. Important to notice is that Arg272 and Tyr254 are precisely the residues that make contact between GFRα1 and RetA in structure 4UX8 that contains these proteins in addition to GDNF in a ternary complex. Also important to note is that residue 105 corresponding to ligand BT13, had a below average rmsd of 5.9 Å, which again shows stability in the binding interaction. Residues 106 and 107 also had high rmsd’s as is to be expected because they are free sodium ions in solution.
Figure 7.
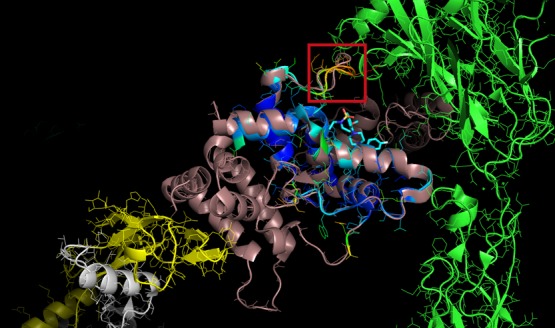
Complex of GDNF (white and yellow) + GFRα1 (chocolate -4UX8- and blue -1Q8D-) + RetA (green) + ligand BT13 (in sticks and cyan), showing the loop with most movement (shown in red quadrate) and contacts with RetA.
The closure of the loop brings into contact protein groups Arg272 and the ligand sulfonamide and aromatic atoms, as seen in Figure 8 and Table 2. In addition, the fluorine and amide carbonyl groups of the ligand make stable hydrogen bonds with Gln10 (Gln247 in 4UX8) in the protein, as shown in Figure 8 and Table 2. The AMBER MD results are in agreement with the Desmond MD results, as these residues are also the most important contributors to the binding of BT13 in the Desmond MD simulations.
Figure 8.
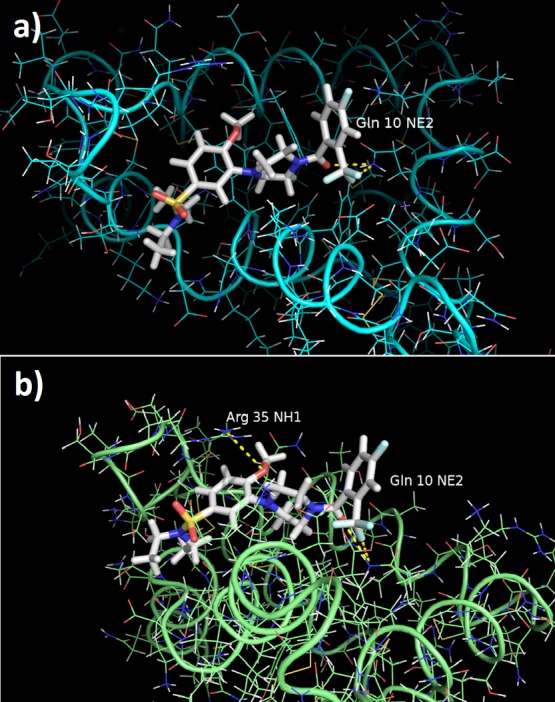
Ligand BT13 (backbone in white) in complex with protein GFRα1 after (a) 1 and (b) 8 ns of explicit water, periodic box AMBER MD simulations. Intermolecular hydrogen bonds are shown as yellow dashes. Gln10 corresponds to Gln247 and Arg35 corresponds to Arg272 in Desmond MD runs.
Table 2. Intermolecular Hydrogen Bonds: Acceptor and Donor Groups, Fraction Time of Occupancy, Average Distances (in Å), and Average Angles (in Degrees).
| acceptor | donorH | donor | fraction | average distance | average angle |
|---|---|---|---|---|---|
| MOL_105@O3 | GLN_10@HE22 | GLN_10@NE2 | 0.3450 | 2.8716 | 155.1439 |
| MOL_105@O1 | ARG_35@HE | ARG_35@NE | 0.0260 | 2.8826 | 157.1047 |
| MOL_105@F1 | GLN_10@HE22 | GLN_10@NE2 | 0.0230 | 2.8991 | 158.9947 |
| MOL_105@F2 | GLN_10@HE22 | GLN_10@NE2 | 0.0130 | 2.9360 | 151.4499 |
| MOL_105@F3 | GLN_10@HE22 | GLN_10@NE2 | 0.0090 | 2.9254 | 149.6957 |
| MOL_105@O1 | ARG_35@HH21 | ARG_35@NH2 | 0.0080 | 2.8187 | 153.1929 |
| MOL_105@O2 | ASN_87@HD21 | ASN_87@ND2 | 0.0050 | 2.9095 | 159.9041 |
Conclusions
The binding pose of compounds BT13 and BT18 to the allosteric site of GFRα1 seems to be stable throughout several long enough MD simulation times, maintaining complexation and hydrogen bonding for BT13 as well as hydrophobic contacts with preferred partners on the protein for BT13 and BT18. Given that the loop in GFRα1 has strong interactions with the ligand BT13 and is also in close contact to its partner RetA (Arg272 in GFRα1; Tyr76, Tyr122, and Tyr146 in RetA) as well as the GFRα1 edge residue Tyr254 being in close contact to Lys75 and Glu77 in RetA, the conformational changes seen in the protein in the GFRα1–BT13 complex may affect binding to RetA, and in turn, induce conformational changes in RetA, which may lead to its activation.
However, as noted above, both ligands also act as RetA direct agonists. Thus, apparently the binding site at RetA interface with GFRα1 (region B) becomes preferential in membrane-bound state of RetA like that has different conformation as compared to the protein structure in single-particle state used in this modeling work. This enables compounds BT13 and BT18 to act as direct agonists of RetA.
However, the binding of the studied compounds to either component of GDNF receptor complex (co-receptor or RetA) is predominantly originating from the rather loose and nonspecific hydrophobic and van der Waals interactions and the favored binding site is rather flat. Thus, it might not be easy to increase the binding efficiency of the ligands and minor modifications in the ligand structure can lead to substantial changes in their binding mode and inactivation. Nevertheless, the present elucidation of the detailed mechanism of interaction between the known active compounds and the GFRα1 and RetA receptor complex enables further rational design of highly effective GDNF mimicking small molecules.
Computational Methods
Small-Molecule Ligands and Target
The structure of ligand BT13 had been obtained through a high-throughput screening procedure;5 compound BT18 is a further development of this structure.6 We proceeded from a protein and two crystal structures on the GDNF–GFRα1 complex downloaded from Protein Data Bank (PDB).16 The hybrid structural model of reconstituted mammalian GDNF–GFRα1–RetA complex (PDB code: 4UX8) had been derived from electron microscopy (EM) and low-angle X-ray scattering (SAXS) data with a resolution 24.0 Å.11 Combination of cryo-EM and SAXS can be a suitable method to study such kind of big protein complexes. This protein structure was previously also exploited for homology modeling, MD simulations, and molecular docking studies.17 The complex consists of chain A and chain B (RetA extracellular domain; residues 29–508), chain C and chain E (GFRα1 with domains D1–D3; residues 6–348), and chain D and chain F (GDNF; residues 42–134). The crystal structure of GDNF–GFRα1 complex (PDB code: 3FUB) contains two chains of GFRα1 (chain A, residues 150–348; chain C, residues 150–348) and two chains of GDNF (chain B, residues 40–134; chain D, residues 32–134) as measured by X-ray diffraction with a resolution 2.35 Å.12 Another crystal structure (PDB code: 1Q8D) containing the GDNF family co-receptor alpha 1 domain 3 has been reported as measured by X-ray diffraction with a resolution 1.80 Å15 and consists of chain A (GFRα1; residues 239–346). Protein structures were prepared (including energy minimization) and hydrogen atoms were added using the Protein Preparation Wizard18 in the Schrödinger Maestro19 software, assuming a pH of 7.4. Possible hydrogen bond interactions, the solvent exposure, and the local surroundings of the histidine residues by visual inspection were also analyzed. All water molecules were kept in the calculations of MD simulation. Water molecules were removed from the protein structure of GDNF–GFRα1–RetA complex and the crystal structure of GDNF–GFRα1 complex for the docking study.
Molecular Docking
The binding poses of BT13 and BT18 on the GDNF–GFRα1–RetA complex (PDB code: 4UX8) were obtained by docking calculations using AutoDock Vina 1.1.2.20 The ligands were optimized before molecular docking by the Ligand Preparation21 (OPLS_2005 force field) in the Schrödinger Maestro19 software. The active binding site on GFRα1 (selected residues of domain D2 in chain C), named region A, was obtained by the removal of GDNF (chain D). The active binding site on RetA (selected residues of cadherin-like domains 1 and 2 in chain A), named region B, was obtained by the removal of GFRα1 (chain C). Both regions were surrounded with a grid box sized 20 × 20 × 20 points with a spacing of 1.000 Å. The allosteric binding site in the middle of GFRα1 (selected residues of domains D1–D3 in chain C), named region C, was surrounded with a grid box sized 30 × 40 × 20 points with a spacing of 1.000 Å. The settings used for the iterated local search global optimizer based on mutation and local optimization steps accepted or rejected with a Metropolis criterion in Vina were nine modes, one central processing unit, and an energy range of 1 kcal/mol. Other settings were used as default. AutoDockTools (ADT)22 1.5.6 was used to identify the binding sites as well as to analyze interactions between protein and ligands. The same procedure and the same parameters, that is, coordinates and size of grid box, were also used in case of the GDNF–GFRα1 complex (PDB code: 3FUB).
Molecular Dynamics
The MD simulations were carried out using Desmond simulation package of Schrödinger LLC.23 The NPT ensemble with the temperature 300 K and a pressure 1 bar was applied in all runs. The simulation length was 50 ns with a relaxation time 1 ps for the ligands BT13 and BT18. The OPLS_2005 force field parameters were used in all simulations.24 The long-range electrostatic interactions were calculated using the particle mesh Ewald method.25 The cutoff radius in Coulomb interactions was 9.0 Å. The water molecules were explicitly described using the simple point charge model.26 The Martyna–Tuckerman–Klein chain coupling scheme27 with a coupling constant of 2.0 ps was used for the pressure control and the Nosé–Hoover chain coupling scheme27 for the temperature control. Nonbonded forces were calculated using an r-RESPA integrator where the short-range forces were updated every step and the long-range forces were updated every three steps. The trajectories were saved at 4.8 ps intervals for analysis. The behavior and interactions between the ligands and protein were analyzed using the Simulation Interaction Diagram tool implemented in Desmond MD package. The stability of MD simulations was monitored by looking on the rmsd of the ligand and protein atom positions in time.
The AMBER 14 package28 with AMBER force field ff9929 was also used to minimize, add counterions, solvate, equilibrate, and run periodic box, explicit water (TIP4P) MD simulations for ligand BT13. The structure of molecule BT13 was optimized using the density functional theory B3LYP method30 with 6-31G basis set and parameters set to the GAFF force field. The protein–ligand–water system was allowed to move freely. Simulations were 10 independent runs with different random initial velocities, each of them 10 ns long, using a 0.001 ps (1 fs) timestep. These are multiple molecular dynamics simulations, which are widely accepted9,31 and can sample enough conformational space as longer, single trajectory simulations. The data analysis was carried out with the cpptraj program (AMBER Tools distribution).28
Acknowledgments
Current work was financially supported by (i) the European Union Seventh Framework Programme (FP7/2007-2013) under grant agreement no. 602919; (ii) Chemedest Ltd.; (iii) the EU European Regional Development Fund through the Centre of Excellence in Molecular Cell Engineering (project no. 2014-2020.4.01.15-0013), Estonia; (iv) Estonian Research Council (PUT-582); and (v) Estonian Ministry for Education and Research (grant IUT34-14).
Supporting Information Available
The Supporting Information is available free of charge on the ACS Publications website at DOI: 10.1021/acsomega.8b01524.
Molecular docking results for small-molecule ligands to the receptor; rmsd of the atomic positions for ligands and protein with Desmond and AMBER; Figures of Desmond MD calculated contacts between ligands and protein; and table of contacts between ligand and protein with AMBER (PDF)
The authors declare no competing financial interest.
Supplementary Material
References
- Airaksinen M. S.; Saarma M. The GDNF Family: Signalling, Biological Functions and Therapeutic Value. Nat. Rev. Neurosci. 2002, 3, 383–394. 10.1038/nrn812. [DOI] [PubMed] [Google Scholar]
- Sariola H.; Saarma M. Novel Functions and Signalling Pathways for GDNF. J. Cell Sci. 2003, 116, 3855–3862. 10.1242/jcs.00786. [DOI] [PubMed] [Google Scholar]
- Sidorova Y. A.; Saarma M. Glial Cell Line-Derived Neurotrophic Factor Family Ligands and Their Therapeutic Potential. Mol. Biol. 2016, 50, 521–531. 10.1134/s0026893316040105. [DOI] [PubMed] [Google Scholar]
- Saarma M.; Karelson M.; Bespalov M.; Pilv M.. Methods of Facilitating Neural Cell Survival Using GDNF Family Ligand (GFL) Mimetics or RET Signaling Pathway Activators. U.S. Patent 8,901,129 B2, 2014.
- Sidorova Y. A.; Bespalov M. M.; Wong A. W.; Kambur O.; Jokinen V.; Lilius T. O.; Suleymanova I.; Karelson G.; Rauhala P. V.; Karelson M.; Osborne P. B.; Keast J. R.; Kalso E. A.; Saarma M. A Novel Small Molecule GDNF Receptor RET Agonist, BT13, Promotes Neurite Growth from Sensory Neurons in Vitro and Attenuates Experimental Neuropathy in the Rat. Front. Pharmacol. 2017, 8, 365. 10.3389/fphar.2017.00365. [DOI] [PMC free article] [PubMed] [Google Scholar]
- Bespalov M. M.; Sidorova Y. A.; Suleymanova I.; Thompson J.; Kambur O.; Viljami J.; Lilius T.; Karelson G.; Puusepp L.; Rauhala P.; Kalso E.; Karelson M.; Saarma M.. Novel Agonist of GDNF Family Ligand Receptor RET for the Treatment of Experimental Neuropathy. 2016, bioRxiv: 061820, DOI: 10.1101/061820. [Google Scholar]
- Ivanova L.; Tammiku-Taul J.; Sidorova Y.; Saarma M.; Karelson M. Small-Molecule Ligands as Potential GDNF Family Receptor Agonists. ACS Omega 2018, 3, 1022–1030. 10.1021/acsomega.7b01932. [DOI] [PMC free article] [PubMed] [Google Scholar]
- García-Sosa A. T.; Mancera R. L. Free Energy Calculations of Mutations Involving a Tightly Bound Water Molecule and Ligand Substitutions in a Ligand-Protein Complex. Mol. Inf. 2010, 29, 589–600. 10.1002/minf.201000007. [DOI] [PubMed] [Google Scholar]
- Park J. G.; Sill P. C.; Makiyi E. F.; Garcia-Sosa A. T.; Millard C. B.; Schmidt J. J.; Pang Y.-P. Serotype-Selective, Small-Molecule Inhibitors of the Zinc Endopeptidase of Botulinum Neurotoxin Serotype A. Bioorg. Med. Chem. 2006, 14, 395–408. 10.1016/j.bmc.2005.08.018. [DOI] [PubMed] [Google Scholar]
- García-Sosa A. T.; Tulp I.; Langel K.; Langel U. Peptide-Ligand Binding Modeling of siRNA with Cell-Penetrating Peptides. BioMed Res. Int. 2014, 257040. 10.1155/2014/257040. [DOI] [PMC free article] [PubMed] [Google Scholar]
- Goodman K. M.; Kjær S.; Beuron F.; Knowles P. P.; Nawrotek A.; Burns E. M.; Purkiss A. G.; George R.; Santoro M.; Morris E. P.; McDonald N. Q. RET Recognition of GDNF-GFRα1 Ligand by a Composite Binding Site Promotes Membrane-Proximal Self-Association. Cell Rep. 2014, 8, 1894–1904. 10.1016/j.celrep.2014.08.040. [DOI] [PubMed] [Google Scholar]
- Parkash V.; Goldman A. Comparison of GFL-GFRα complexes: further evidence relating GFL bend angle to RET signalling. Acta Crystallogr. 2009, 65, 551–558. 10.1107/s1744309109017722. [DOI] [PMC free article] [PubMed] [Google Scholar]
- Genheden S.; Ryde U. The MM/PBSA and MM/GBSA methods to estimate ligand-binding affinities. Expert Opin. Drug Discovery 2015, 10, 449–461. 10.1517/17460441.2015.1032936. [DOI] [PMC free article] [PubMed] [Google Scholar]
- Li J.; Abel R.; Zhu K.; Cao Y.; Zhao S.; Friesner R. A. The VSGB 2.0 model: a next generation energy model for high resolution protein structure modeling. Proteins 2011, 79, 2794–2812. 10.1002/prot.23106. [DOI] [PMC free article] [PubMed] [Google Scholar]
- Leppänen V.-M.; Bespalov M. M.; Runeberg-Roos P.; Puurand Ü.; Merits A.; Saarma M.; Goldman A. The structure of GFRα1 domain 3 reveals new insights into GDNF binding and RET activation. EMBO J. 2004, 23, 1452–1462. 10.1038/sj.emboj.7600174. [DOI] [PMC free article] [PubMed] [Google Scholar]
- Protein Data Bank . Research Collaboratory for Structural Bioinformatics. http://www.pdb.org/pdb/home/home.do, 2018. [DOI] [PMC free article] [PubMed]
- Gao C.; Grøtli M.; Eriksson L. A. Defects in the calcium-binding region drastically affect the cadherin-like domains of RET tyrosine kinase. Phys. Chem. Chem. Phys. 2016, 18, 8673–8681. 10.1039/c6cp00042h. [DOI] [PubMed] [Google Scholar]
- a Sastry G. M.; Adzhigirey M.; Day T.; Annabhimoju R.; Sherman W. Protein and ligand preparation: Parameters, protocols, and influence on virtual screening enrichments. J. Comput.-Aided Mol. Des. 2013, 27, 221–234. 10.1007/s10822-013-9644-8. [DOI] [PubMed] [Google Scholar]; b Schrödinger Release 2016-3: Schrödinger Suite 2016-3 Protein Preparation Wizard, Epik; Schrödinger, LLC: New York, NY, 2016; Impact; Schrödinger, LLC: New York, NY, 2016; Prime; Schrödinger, LLC: New York, NY, 2016.
- Schrödinger Release 2016-3: Maestro, version 10.7; Schrödinger, LLC: New York, NY, 2016.
- Trott O.; Olson A. J. AutoDock Vina: improving the speed and accuracy of docking with a new scoring function, efficient optimization and multithreading. J. Comput. Chem. 2010, 31, 455–461. 10.1002/jcc.21334. [DOI] [PMC free article] [PubMed] [Google Scholar]
- Schrödinger Release 2016-3: LigPrep; Schrödinger, LLC, New York, NY, 2016.
- Morris G. M.; Huey R.; Lindstrom W.; Sanner M. F.; Belew R. K.; Goodsell D. S.; Olson A. J. AutoDock4 and AutoDockTools4: Automated docking with selective receptor flexibility. J. Comput. Chem. 2009, 30, 2785–2791. 10.1002/jcc.21256. [DOI] [PMC free article] [PubMed] [Google Scholar]
- Schrödinger Release 2017-3: Desmond Molecular Dynamics System; D. E. Shaw Research: New York, NY, 2017; Maestro-Desmond Interoperability Tools, Schrödinger, New York, NY, 2017.
- Banks J. L.; Beard H. S.; Cao Y.; Cho A. E.; Damm W.; Farid R.; Felts A. K.; Halgren T. A.; Mainz D. T.; Maple J. R.; Murphy R.; Philipp D. M.; Repasky M. P.; Zhang L. Y.; Berne B. J.; Friesner R. A.; Gallicchio E.; Levy R. M. Integrated Modeling Program, Applied Chemical Theory (IMPACT). J. Comput. Chem. 2005, 26, 1752–1780. 10.1002/jcc.20292. [DOI] [PMC free article] [PubMed] [Google Scholar]
- Toukmaji A. Y.; Board J. A. Jr. Ewald Summation Techniques in Perspective: A Survey. Comput. Phys. Commun. 1996, 95, 73–92. 10.1016/0010-4655(96)00016-1. [DOI] [Google Scholar]
- Zielkiewicz J. Structural Properties of Water: Comparison of the SPC, SPCE, TIP4P, and TIP5P Models of Water. J. Chem. Phys. 2005, 123, 104501. 10.1063/1.2018637. [DOI] [PubMed] [Google Scholar]; J. Chem. Phys. 2006, 124, 109901. 10.1063/1.2178809
- Martyna G. J.; Klein M. L.; Tuckerman M. Nosé-Hoover chains: The canonical ensemble via continuous dynamics. J. Chem. Phys. 1992, 97, 2635–2643. 10.1063/1.463940. [DOI] [Google Scholar]
- Case D. A.; Berryman J. T.; Betz R. M.; Cerutti D. S.; Cheatham T. E. III; Darden T. A.; Duke R. E.; Giese T. J.; Gohlke H.; Goetz A. W.; Homeyer N.; Izadi S.; Janowski P.; Kaus J.; Kovalenko A.; Lee T. S.; LeGrand S.; Li P.; Luchko T.; Luo R.; Madej B.; Merz K. M.; Monard G.; Needham P.; Nguyen H.; Nguyen H. T.; Omelyan I.; Onufriev A.; Roe D. R.; Roitberg A.; Salomon-Ferrer R.; Simmerling C. L.; Smith W.; Swails J.; Walker R. C.; Wang J.; Wolf R. M.; Wu X.; York D. M.; Kollman P. A.. AMBER 2015; University of California: San Francisco, 2015.
- Wroblewska L.; Skolnick J. Can a physics-based, all-atom potential find a protein’s native structure among misfolded structures? I. Large scale AMBER benchmarking. J. Comput. Chem. 2007, 28, 2059–2066. 10.1002/jcc.20720. [DOI] [PubMed] [Google Scholar]
- Stephens P. J.; Devlin F. J.; Chabalowski C. F.; Frisch M. J. Ab Initio Calculation of Vibrational Absorption and Circular Dichroism Spectra Using Density Functional Force Fields. J. Phys. Chem. 1994, 98, 11623–11627. 10.1021/j100096a001. [DOI] [Google Scholar]
- Killian B. J.; Kravitz J. Y.; Somani S.; Dasgupta P.; Pang Y.-P.; Gilson M. K. Configurational Entropy in Protein-Peptide Binding:. J. Mol. Biol. 2009, 389, 315–335. 10.1016/j.jmb.2009.04.003. [DOI] [PMC free article] [PubMed] [Google Scholar]
Associated Data
This section collects any data citations, data availability statements, or supplementary materials included in this article.


