Abstract
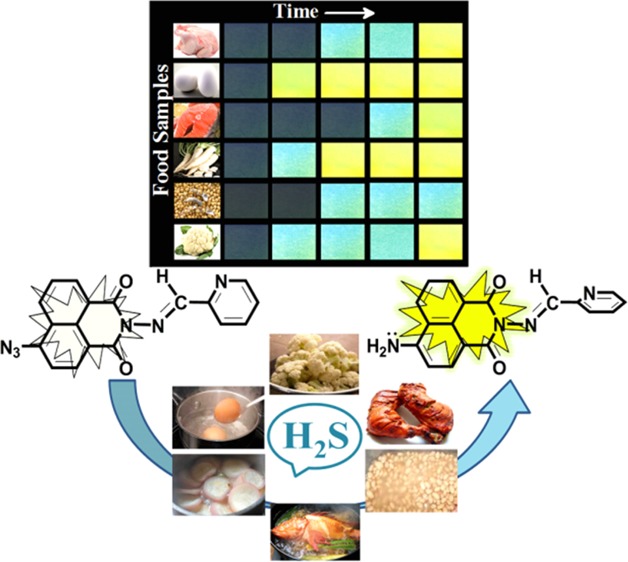
A unique method has been developed for comparative analysis of H2S produced from food samples from our daily diet, both qualitatively and quantitatively. The selective detection of H2S has been executed by introducing a simple chemodosimeter (PN-N3) that gives response on the basis of intramolecular charge transfer. UV–vis, fluorimetric, and NMR titrations were performed to demonstrate the sensing mechanism and electronic environment of PN-N3 in the presence of H2S. Density functional theory calculations were performed to validate the mechanism of azide (PN-N3) reduction to amine (PN-NH2) by the strong reducing power of H2S. The potentiality of this chemosensing method is that it could be treated as a simple, less-time-consuming, and cost-effective method for determining H2S in biological samples in the nanomolar range.
Introduction
Hydrogen sulfide (H2S) gas is though traditionally recalled with its unique obnoxious foul smell of rotten eggs,1,2 but nowadays it is in the limelight of scientific research field for its role as third endogenous gasotransmitter, after carbon monoxide (CO) and nitric oxide (NO).3−7 In a mammalian system, H2S is endogenously produced from cysteine (Cys) and homocysteine (Hcy) in a series of reactions mainly catalyzed by several enzymes: two pyridoxal-5′-phosphate (PLP)-dependent enzymes, cystathionine β-synthase (CBS)8 and cystathionine γ-lyase (CSE),9 as well as cysteineaminotransferase (CAT) and mercaptopyruvatesulfurtransferase (MST).10,11 Some sulfate-reducing bacteria, present in both the mouth and intestinal tract,12 can oxidize organic compounds or molecular hydrogen while reducing SO42– to H2S. The biological concentration level of H2S in blood plasma is 10–100 μM, whereas in the central nervous system, it is found to be in the range of 50–160 μM.13,14 A number of pathological and physiological15−18 processes, especially modulation of gastrointestinal, endocrine, and genitourinary systems19−23 and neuromodulation,24−26 possess direct involvement of H2S. Besides these, H2S can also act as a channel opener of adenosine 5′-triphosphate (ATP)-sensitive potassium channels (KATP) and some other potassium channels27,28 and as an antioxidant or scavenger toward reactive oxygen species (ROS).29 Numerous diseases show correlation with the abnormal level of H2S regulation in the mammalian body system.30−33
Along with this entire beneficial role, H2S, if present in higher concentration, can also be deadly harmful for the biological system by inducing shock, coma, and convulsion.34 Due to the power of reducibility and high solubility in lipids even at low concentration,35 H2S may prevent cellular respiration through complexation with cytochromes, which eventually leads to death.36 It is found that the β cells of pancreas in type 1 diabetes37 and human body inherited with trisomy 21 (Down’s syndrome)38 produces an excess of this gas. The manifestation of both advantageous and adverse effects of H2S undoubtedly demands that certain biological concentration level of this gas must be maintained in our body.
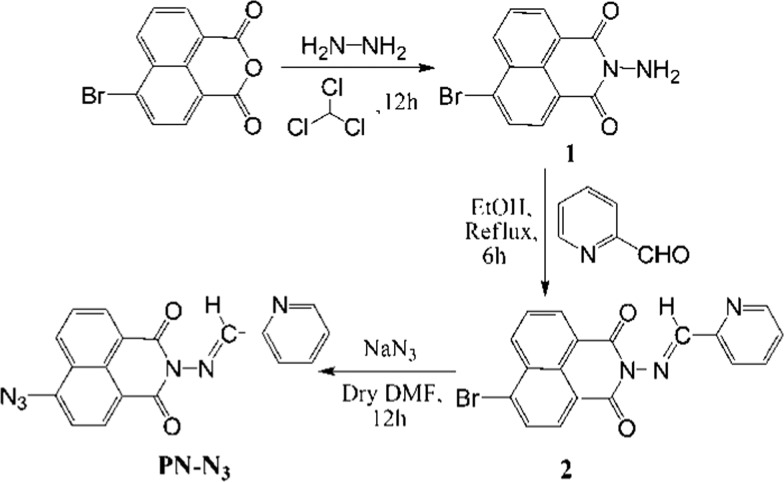
To the best of our knowledge, the quantitative estimation of H2S from food samples using the chemodosimetric method has not been studied so far, even though one of the main sources from which endogenous H2S is produced is food what we consume daily (comparison table, Table S1). Our research group has developed a unique method to monitor the comparative concentration of H2S in our daily diet. In this method, a new chemodosimetric probe, pyridine–naphthalimide conjugated azide (PN-N3), has been introduced to detect the gas very promptly through the fluorescence “turn-on” mechanism. Several traditional analytical methods, such as electrochemical methods,39−42 gas chromatography,43−45 colorimetric assay,46−48 and metal-induced sulfide precipitation49,50 have been used for detection of H2S. However, we took interest in chemosensors due to their high sensitivity, high quantum yield (QY, Φ), selectivity, and specificity toward the guest, and more significantly these probes are of low cost,51−55 portable and able to sense the target molecules in very less time. For designing the probes to detect H2S, the azide–H2S reaction chemistry is predominantly explored.56−60 Keeping in mind this mechanism, PN-N3 was synthesized with 86% yield through three simple steps of reactions starting from 4-bromo-1,8-naphthalic anhydride. The PN-N3 structure was confirmed by 1H NMR, 13C NMR, and mass spectral studies (Figures S1–S5, Supporting information).
Results and Discussion
Spectral Behavior of PN-N3 with H2S
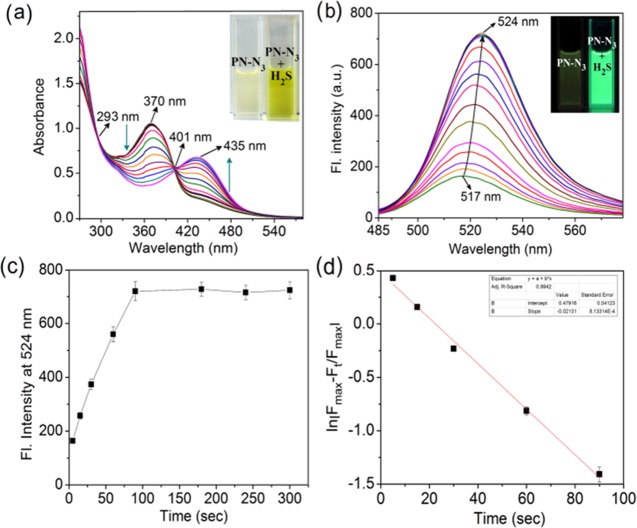
Absorbance and fluorescence titration spectra of PN-N3 with H2S up to 20 equiv were recorded in CH3CN/H2O (1:8, v/v; pH 7.0; 10 mM phosphate-buffered saline). From Figure 1a, it has been observed that during successive addition of H2S, absorbance at 370 nm has been decreased along with an increase at 435 nm. Two clear isosbestic points at 293 and 401 nm support the formation of a new compound in the reaction between PN-N3 and H2S. A bathochromic shift of about 65 nm (370 → 435 nm) in absorbance spectra describes the nucleophilic addition of H2S to the azide moiety, which produces highly fluorescent PN-NH2 by blocking the intramolecular charge transfer (ICT) process. About 3-fold enhanced absorbance of PN-NH2 compared to that of PN-N3 has been noted at 435 nm upon saturation with H2S (Figure S6). Fluorimetric titration reveals that a 20 μM solution of PN-N3 is weakly fluorescent (Φ = 0.056) but an addition of 20 equiv H2S hiked up to 5-fold (Φ* = 0.314) turn-on response. A slight red shift from 517 to 524 nm (λmax = 435 nm) (Figure 1b) is probably due to the vibrant n−π* transition in the naphthalimide moiety of PN-NH2.
Figure 1.
(a) UV–vis absorption spectra of PN-N3 (20 μM) upon addition of H2S up to 20 equiv in CH3CN/H2O (1:8, v/v; pH 7.0; 10 mM phosphate buffer). (Inset) Visual changes of PN-N3 after addition of H2S. (b) Fluorescence emission spectra of PN-N3 (20 μM) after addition of H2S in CH3CN/H2O (1:8, v/v; pH 7.0; λmax = 435 nm). (Inset) Fluorescence turn-on of PN-N3 after addition of H2S. (c) Fluorescence intensity plot of probe PN-N3 as a function of time. (d) Pseudo-first-order kinetics plot for the reaction of PN-N3 with H2S.
pH titration shows that PN-N3 is independent of the pH of the solution, whereas PN-NH2 becomes nonfluorescent under acidic pH due to protonation of the −NH2 group (Figure S7). The detection limit of PN-N3 for H2S was measured to be 66 nM (Figure S8). Job’s plot analysis indicated 1:2 stoichiometric interaction of PN-N3 with H2S to give PN-NH2 (Figure S9). The kinetic profiles showed the completion of the reaction between PN-N3 and H2S within 90 s (Figure 1c). The pseudo-first-order rate constant (k′) has been calculated as k′ = 0.02 s–1 (Figure 1d) according to the equation61
| 1 |
where Ft and Fmax are the fluorescence intensities at 524 nm (λex = 435 nm) at time “t” and the maximum value obtained after the reaction is complete, respectively, and k′ is the observed pseudo-first-order rate constant.
Selectivity of PN-N3
Before moving to other relevant experiments, we checked the selectivity of PN-N3 toward H2S. The addition of various anions (HPO42–, HCO3–, OAc–, F–, Cl–, S2O3–, S2O42–, SO32–, SO42–) and biologically relevant ROS, RNS such as H2O2 and NO, along with ascorbic acid and l-cysteine, to the colorless solution of PN-N3 did not show any changes, whereas the addition of H2S turned immediately the colorless clear solution into lemon yellow. A strong green fluorescence has been shown for H2S when a similar test was performed under a UV lamp, but in the presence of other anions, ROS, RNS, and l-cysteine, the solution endured its inherent non-fluorescence (Figure S10a). Sensitivity of PN-N3 toward H2S in the gas phase was well accomplished by the dip stick method. The paper strips were soaked in the probe solution and exhibited bright lemon yellow color just after contacting with H2S (Figure S10b). This observation was also justified by absorbance and fluorescence titration studies (Figure S11).
NMR and Mass Titration
1H NMR titration was executed in CD3CN (Figure S12) to illustrate the interactions of PN-N3 with H2S. After the gradual addition of H2S to the probe, a new characteristic peak of the aromatic amine functional group was developed between 5.0 and 5.2 ppm. The conversion of azide to amine in the presence of 2 equiv of H2S made PN-NH2 more electron-rich and consequently the entire aromatic region shifted to upfield a little bit. The mass spectrum of the reaction mixture of PN-N3 and H2S has also been recorded, which gives a new peak at m/z: 317.2134, specifying the formation of PN-NH2 (Figure S13).
Theoretical Analysis
We performed time-dependent density functional theory (TD-DFT) calculations for the reactant and the product also (Figure S14). The investigation was done by quantum chemical calculations at the DFT level using the 6-311G+(d,p) basis set implemented in Gaussian 09 program. Solvent effects were incorporated using a CPCM solvent model (Tables S2 and S3).
The vertical electronic transitions, i.e., the calculated λmax, orbital transition, and oscillator strength (f), are listed in Tables S4, S5 and Figure S15. Provided transitions at 285 nm in PN-N3, 288 nm and 408 nm in PN-NH2 indicate the formation of two prominent isosbestic points in absorbance titration. The major transition in PN-N3 at 376 nm (S0 → S1, f = 0.8193) is very close to that observed at 370 nm experimentally. Lowering of the curve in titration signifies the termination of ICT. Furthermore, the energy gap between the highest occupied molecular orbital (HOMO) and lowest unoccupied molecular orbital (LUMO) of PN-N3 is smaller than that of PN-NH2, in good agreement with the greater stability of the latter (Figure 2). This theoretical study strongly correlates with the experimental findings.
Figure 2.
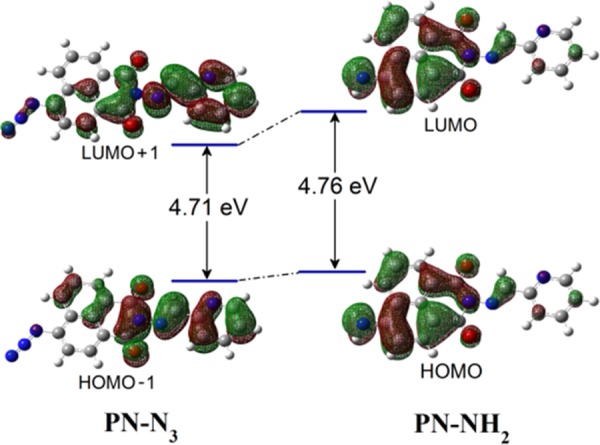
HOMO–LUMO distributions of PN-N3 and PN-NH2.
Potential Energy Surface (PES) Calculation
We also acquired the energies of different probable intermediates from potential energy surface (PES) calculations (Figure 3).62
Figure 3.
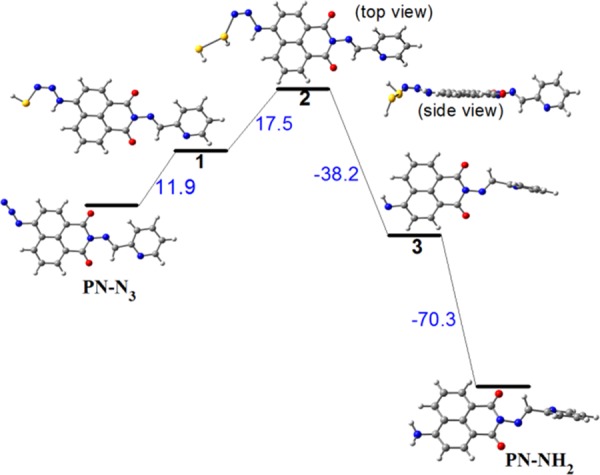
Calculated potential energy surfaces for the plausible mechanism of formation of PN-NH2 from PN-N3. Energies are reported in kcal/mol.
The highest energy (17.5 kcal/mol) occupying intermediate 2 has been achieved after the nucleophilic attack on PN-N3 by the hydrosulfide (HS–) ion. Then, the thermodynamically most stable (−70.3 kcal/mol) product PN-NH2 is formed via anionic intermediate 3.
Plausible Mechanism and Explanation
From all of the experimental and computational investigations outlined above, a plausible mechanism for HS–-mediated reduction of PN-N3 (Scheme 1) has been defined. On the basis of the high nucleophilicity of HS– (obtained from aq Na2S solution), it may be the active species required for azide reduction, rather than H2S.
Scheme 1. Fluorescence Turn-On of PN-N3 after Addition of H2S.
PN-N3 is weakly fluorescent, signifying the intramolecular charge transfer (ICT) from the pyridine to the naphthalimide moiety. In the first step of this reaction (Scheme S1), a nucleophilic attack of HS– occurs on the electrophilic center, i.e., the azide nitrogen of PN-N3, to produce anionic azidothiol intermediate 1, which is then rapidly protonated to form more electrophilic and neutral intermediate 2, ensuing the closure of ICT. Consequent attack of second equivalent of HS– on 2 produces deprotonated resonance-stabilized amine 3, which benefits a sharp n−π* transition in the naphthalimide moiety. Finally, the proton transfer facilitated by the solvent water results in the formation of strong fluorescent PN-NH2.
Quantitative Analysis
For comparative studies on the consumption of H2S in human body through nutrients, food samples were arbitrarily chosen from our daily diet, such as chicken, egg, fish, radish, soybean, and cauliflower.63,64 All of the samples except egg had been washed, cut into pieces, and set to boil in distilled water. In case of eggs, egg white was separated and boiled. The vapor produced from the food sample was allowed to come in contact of filter paper strips coated with our probe PN-N3 (Figure 4). The colorimetric changes in the strips were observed and recorded during 2 h with 30 min time interval.
Figure 4.
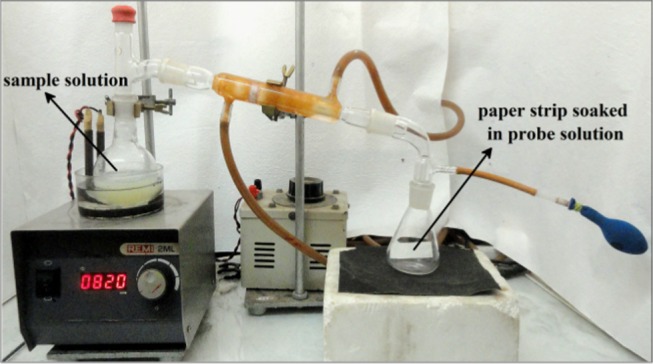
Apparatus setup for analysis of H2S produced from dietary samples.
The concentration of H2S produced from the chosen food samples was estimated on the basis of fluorimetric analysis. The difference between the fluorescence intensities of the paper strips at different time intervals could give a clear idea about whether the food samples can provide a higher, moderate, or lower amount of H2S after its consumption by the living system (Figure 5a).
Figure 5.
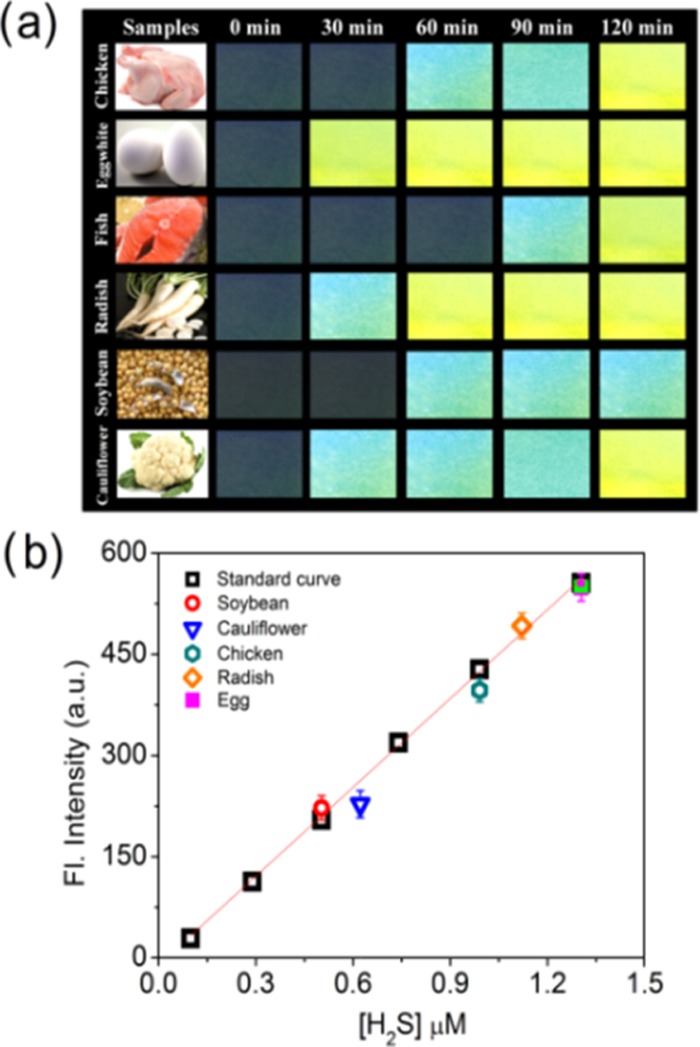
(a) Images of filter paper strips after consumption of H2S vapor produced from food samples at 30 min interval. (b) Estimation of the concentration of H2S produced from the food samples following the standard curve. Standard deviations (SDs) are given by error bars, where n = 3.
Three paper strips soaked with PN-N3 were allowed to keep contact with the exposure in commercially available Na2S solutions to display the different fluorescence intensities, indicating three different ranges of concentrations (Figure S16). Hence, a standard curve was obtained by plotting the fluorescence intensity of PN-N3 with Na2S with the respective concentration of H2S evolved (Figure 5b). This concentration versus fluorescence intensity graph could easily represent the amount of H2S produced from the food samples after their consumption by the living system, and here it was found to be in the range of 0.5–1.4 μM. A colorimetric assay has also been carried out with the help of the absorbance plot to further validate the fluorimetric estimation data (Figure S17).
Conclusions
In summary, we have successfully developed a new chemosensing method for comparative quantitative analysis of H2S produced by food samples from our daily diet. The chemodosimeter PN-N3 can selectively detect H2S at nanomolar range giving a vivid colorimetric and fluorimetric response in both solution and gaseous phases. The potentiality of PN-N3 is that it could be treated as a simple, less-time-consuming, cost-effective practical sensing system for determining H2S in biological samples. Our probe can also be used in pathological applications by developing an analyzing tool to detect the abnormal endogenous H2S level, which is responsible for various diseases.
Experimental Section
Materials and Instruments
4-Bromo-1,8-naphthalic anhydride, hydrazine hydrate, picolinaldehyde, sodium azide, chloroform, 2,2-dimethylformamide (DMF), ethanol, all of the anions, l-cysteine, homocysteine, glutathione and all other chemicals were purchased from Sigma-Aldrich Pvt. Ltd. (India) and obtained from commercial suppliers. All of the materials were used directly as purchased. The solvents were dried, maintaining the conditions of standard procedures. Elix Millipore water was used throughout the experiments. A Bruker 400 MHz instrument was employed for detailing 1H and 13C NMR spectra with the solvents CD3CN, CDCl3, dimethyl sulfoxide (DMSO)-d6 and D2O. Tetramethylsilane was used as an internal standard. Chemical shifts are given in δ ppm units and 1H–1H and 1H–C coupling constants in Hertz. The following abbreviations are used to describe spin multiplicities in 1H NMR spectra: s, singlet; d, doublet; t, triplet; and m, multiplet. A micromass Q-TOF micro instrument was used to record the mass spectrum using methanol as the solvent. A PerkinElmer model LS55 spectrophotometer and a Shimadzu UV-3101PC spectrophotometer were used for recording fluorescence and UV–vis spectra, respectively. A PerkinElmer 2400 series CHNS/O analyzer was used for elemental analysis of the compounds.
Synthesis of 1
Following a published procedure, compound 1 was synthesized.65 4-Bromo-1,8-naphthalic anhydride (1 g, 5.0 mmol) was stirred at room temperature in chloroform (10 mL) for 15 min, and then excess (3 mL) of hydrazine hydrate was added. The reaction mixture was then refluxed for 12 h and monitored with thin-layer chromatography (TLC). After cooling, a yellow solid was obtained, which was then filtered and dried at 100 °C. Yield: 90%. 1H NMR (CDCl3, 400 MHz): δ (ppm): 8.65–8.67 (m, 1H, J = 8 Hz), 8.57–8.59 (m, 1H, J = 8 Hz), 8.41–8.43 (d, 1H, J = 8 Hz), 8.03–8.05 (d, 1H, J = 8 Hz), 7.83–7.87 (m, 1H, J = 16 Hz), 5.52 (s, 2H). 13C NMR (CDCl3, 400 MHz): δ (ppm): 160.51, 133.96, 132.50, 131.63, 131.39, 131.08, 130.81, 128.33, 127.81, 122.50, 121.57, 77.48, 77.16, 76.84. Anal. Calcd for C12H7N2O2Br: C, 49.51; H, 2.42; N, 9.62; O, 10.99; found: C, 49.23; H, 2.51; N, 9.82; O, 11.00.
Synthesis of 2
Compound 1 and picolinaldehyde were dissolved in ethanol and refluxed for 24 h, monitoring with TLC. The solvent was evaporated under reduced pressure, and the crude product compound 2 was further purified by column chromatography (CHCl3/EtOAc = 6:1). Yield: 82%. 1H NMR (CDCl3, 400 MHz): δ (ppm): 8.73 (s, 3H), 8.62–8.72 (m, 1H, J = 40 Hz), 8.48–8.50 (d, 1H, J = 8 Hz), 7.38–7.40 (d, 1H, J = 8 Hz), 8.07–8.09 (d, 1H, J = 8 Hz), 7.83–7.91 (m, 2H, J = 32 Hz), 7.26–7.46 (m, 1H, J = 8 Hz). 13C NMR (CDCl3, 400 MHz): δ (ppm): 171.28, 150.03, 136.85, 133.94, 132.93, 132.05, 131.46, 128.41, 126.22, 122.70, 77.47, 77.15, 76.83. Anal. Calcd for C18H10N3O2Br: C, 56.86; H, 2.65; N, 11.05; O, 8.42; found: C, 56.81; H, 2.68; N, 11.02; O, 8.39.
Synthesis of PN-N3
To produce PN-N3 (Scheme 2), sodium azide was dissolved in dried DMF, followed by addition of compound 2 after 1 h. The reaction mixture was stirred at 50 °C under a nitrogen atmosphere, monitoring with TLC. After the consumption of starting material, the reaction mixture was treated with ice cold water and filtered under reduced pressure. The yellow solid residue obtained was washed with cold water and further used. Melting point 180 °C. Yield: 82%. 1H NMR (DMSO-d6, 400 MHz): δ (ppm): 8.79 (s, 2H), 8.48–8.60 (m, 3H), 8.25–8.27 (d, 1H, J = 8 Hz), 8.03–8.07 (t, 1H, J = 16 Hz), 7.88–7.93 (m, 1H, J = 20 Hz), 7.77–7.81 (t, 1H, J = 16 Hz), 7.63–7.66 (t, 1H, J = 12 Hz). 13C NMR (DMSO-d6, 400 MHz): δ (ppm): 171.91, 151.23, 150.14, 143.33, 137.45, 132.05, 131.96, 131.67, 128.69, 127.46, 126.65, 122.57, 121.85, 116.16, 40.13, 39.92, 39.71, 39.51, 39.29, 39.09, 38.88. Anal. Calcd for C18H10N6O2: C, 63.16; H, 2.94; N, 24.55; O, 9.35; found: C, 63.11; H, 2.96; N, 24.52; O, 9.35. Matrix-assisted laser desorption ionization (time-of-flight mass spectrometry): Anal. Calcd for C18H10N6O2: 342.09; found: 343.09 [M + H+], 100%.
Scheme 2. Stepwise Preparation of the PN-N3 Probe.
Absorbance and Fluorescence Studies
A stock solution of PN-N3 (20 μM) was prepared in acetonitrile–water. A H2S solution (from Na2S) of concentration 100 μM was prepared in Elix Millipore water. All experiments were carried out using CH3CN/H2O (1:8, v/v) maintaining the pH at 7.0 (10 mM phosphate buffer). During the titration, in the quartz optical cell of 1 cm optical path length, each time, a 20 μM solution of PN-N3 was filled and a stock solution of Na2S was gradually added into it until saturation. After 1–2 min of the addition of H2S solution, spectral data were recorded. For all fluorescence measurements, excitation was provided at 435 nm and emission was collected between 485 and 580 nm.
Measurement of Fluorescence Quantum Yield
The fluorescence quantum yields (QY) of PN-N3 (Φ) and PN-NH2 (Φ*) were determined relative to a reference compound fluorescein (Φr = 0.95 in 0.1 M NaOH) at pH 7.0 (10 mM phosphate buffer). The same excitation wavelength, gain, and slit band widths were applied for both samples. The QY was calculated using the following equation66
| 2 |
where Ar and As are the absorbance of the reference and sample solution at the reference excitation wavelength, FAr and FAs are the corresponding integrated fluorescence intensities, and η and η0 are the solvent refractive indexes of the sample and reference, respectively.
Calculation of Limit of Detection (LOD)
From the fluorescence titration data, the detection limit of PN-N3 for H2S was calculated. The standard deviation for the fluorescence intensity was determined from the measurements of the emission intensity of four individual receptors without H2S 10 times. The evaluation was done by following the equation67
| 3 |
where K = 2 or 3 (here, we took 3), SD is the standard deviation of the blank receptor solution, and S is the slope of the calibration curve.
Acknowledgments
Acknowledgments are given to SERB-DST, Govt. of India, by P.S. for her research grant [Project file no. SB/FT/CS-021/2014]. A.G. and S.D. are grateful to UGC and CSIR, India, respectively, for their research fellowship.
Supporting Information Available
The Supporting Information is available free of charge on the ACS Publications website at DOI: 10.1021/acsomega.8b01751.
1H NMR, 13C NMR, and MS spectra; additional spectroscopic data; supplementary fluorescence images; and theoretical calculation tables (PDF)
Author Contributions
† A.G. and S.D. contributed equally to this work.
The authors declare no competing financial interest.
Supplementary Material
References
- Bailey T. S.; Pluth M. D. Chemiluminescent Detection of Enzymatically Produced Hydrogen Sulfide: Substrate Hydrogen Bonding Influences Selectivity for H2S over Biological Thiols. J. Am. Chem. Soc. 2013, 135, 16697–16704. 10.1021/ja408909h. [DOI] [PMC free article] [PubMed] [Google Scholar]
- Wan Q.; Song Y.; Li Z.; Gao X.; Ma H. In vivo monitoring of hydrogen sulfide using a cresyl violet-based ratiometric fluorescence probe. Chem. Commun. 2013, 49, 502–504. 10.1039/C2CC37725J. [DOI] [PubMed] [Google Scholar]
- Abe K.; Kimura H. The possible role of hydrogen sulfide as an endogenous neuromodulator. J. Neurosci. 1996, 16, 1066–1071. 10.1523/JNEUROSCI.16-03-01066.1996. [DOI] [PMC free article] [PubMed] [Google Scholar]
- Kimura H.; Nagai Y.; Umemura K.; Kimura Y. Physiological roles of hydrogen sulfide: synaptic modulation, neuroprotection and smooth muscle relaxation. Antioxid. Redox Signaling 2005, 7, 795–803. 10.1089/ars.2005.7.795. [DOI] [PubMed] [Google Scholar]
- Ritter J. M. Human pharmacology of hydrogen sulfide, putative gaseous mediator. Br. J. Clin. Pharmacol. 2010, 69, 573–575. 10.1111/j.1365-2125.2010.03690.x. [DOI] [PMC free article] [PubMed] [Google Scholar]
- Wang R. Physiological implications of hydrogen sulfide: a whiff exploration that blossomed. Physiol. Rev. 2012, 92, 791–896. 10.1152/physrev.00017.2011. [DOI] [PubMed] [Google Scholar]
- Wang R. The gasotransmitter role of hydrogen sulfide. Antioxid. Redox Signaling 2003, 5, 493–501. 10.1089/152308603768295249. [DOI] [PubMed] [Google Scholar]
- Singh S.; Padovani D.; Leslie R. A.; Chiku T.; Banerjee R. Relative contribution of cystathionine-synthase and -cystathionase to H2S biogenesis via alternative trans-sulfuration reactions. J. Biol. Chem. 2009, 284, 22457–22466. 10.1074/jbc.M109.010868. [DOI] [PMC free article] [PubMed] [Google Scholar]
- Chiku T.; Padovani D.; Zhu W.; Singh S.; Vitvitsky V.; Banerjee R. H2S biogenesis by human cystathionine gamma-lyase leads to the novel sulfur metabolites lanthionine and homolanthionine and is responsive to the grade of hyperhomocysteinemia. J. Biol. Chem. 2009, 284, 11601–11612. 10.1074/jbc.M808026200. [DOI] [PMC free article] [PubMed] [Google Scholar]
- Lin V. S.; Chang C. J. Fluorescent probes for sensing and imaging biological hydrogen sulfide. Curr. Opin. Chem. Biol. 2012, 16, 595–601. 10.1016/j.cbpa.2012.07.014. [DOI] [PMC free article] [PubMed] [Google Scholar]
- Shibuya N.; Tanaka M.; Yoshida M.; Ogasawara Y.; Togawa T.; Ishii K.; Kimura H. 3-Mercaptopyruvate sulfurtransferase produces hydrogen sulfide and bound sulfane sulfur in the brain. Antioxid. Redox Signaling 2009, 11, 703–714. 10.1089/ars.2008.2253. [DOI] [PubMed] [Google Scholar]
- Figliuolo V. R.; Dos Santos L. M.; Abalo A.; Nanini H.; Santos A.; Brittes N. M.; Bernardazzi C.; de Souza H. S. P.; Vieira L. Q.; Coutinho-Silva R.; Coutinho C. M. L. M. Sulfate-reducing bacteria stimulate gut immune responses and contribute to inflammation in experimental colitis. Life Sci. 2017, 189, 29–38. 10.1016/j.lfs.2017.09.014. [DOI] [PubMed] [Google Scholar]
- Papapetropoulos A.; Pyriochou A.; Altaany Z.; Yang G.; Marazioti A.; Zhou Z.; et al. Hydrogen sulfide is an endogenous stimulator of angiogenesis. Proc. Natl. Acad. Sci. U.S.A. 2009, 106, 21972–21977. 10.1073/pnas.0908047106. [DOI] [PMC free article] [PubMed] [Google Scholar]
- Chen Y. H.; Yao W. Z.; Geng B.; Ding Y. L.; Lu M.; Zhao M. W.; Tang C. S. Endogenous hydrogen sulfide in patients with COPD. Chest 2005, 128, 3205–3211. 10.1378/chest.128.5.3205. [DOI] [PubMed] [Google Scholar]
- Baskar R.; Bian J. Hydrogen sulfide gas has cell growth regulatory role. Eur. J. Pharmacol. 2011, 656, 5–9. 10.1016/j.ejphar.2011.01.052. [DOI] [PubMed] [Google Scholar]
- Yang G.; Wu L.; Jiang B.; Yang W.; Qi J.; Cao K.; Meng Q.; Mustafa A. K.; Mu W.; Zhang S.; Snyder S. H.; Wang R. H2S as a physiologic vasorelaxant: hypertension in mice with deletion of cystathionine gamma-lyase. Science 2008, 322, 587–590. 10.1126/science.1162667. [DOI] [PMC free article] [PubMed] [Google Scholar]
- Cai Y.; Li L.; Wang Z.; Sun J. Z.; Qin A.; Tang B. Z. A sensitivity tunable tetraphenylethene-based fluorescent probe for directly indicating the concentration of hydrogen sulfide. Chem. Commun. 2014, 50, 8892–8895. 10.1039/C4CC02844A. [DOI] [PubMed] [Google Scholar]
- Calvert J. W.; Jha S.; Gundewar S.; Elrod J. W.; Ramachandran A.; Pattillo C. B.; Kevi C. G.; Lefer D. J. Hydrogen Sulfide Mediates Cardioprotection Through Nrf2 Signaling. Circ. Res. 2009, 105, 365–374. 10.1161/CIRCRESAHA.109.199919. [DOI] [PMC free article] [PubMed] [Google Scholar]
- Martelli A.; Testai L.; Breschi M. C.; Blandizzi C.; Virdis A.; Taddei S.; Calderone V. Hydrogen sulphide: novel opportunity for drug discovery. Med. Res. Rev. 2012, 32, 1093–1130. 10.1002/med.20234. [DOI] [PubMed] [Google Scholar]
- Mancardi D.; Penna C.; Merlino A.; Del Soldato P.; Wink D. A.; Pagliaro P. Physiological and pharmacological features of the novel gasotransmitter: hydrogen sulfide. Biochim. Biophys. Acta 2009, 1787, 864–872. 10.1016/j.bbabio.2009.03.005. [DOI] [PMC free article] [PubMed] [Google Scholar]
- Li L.; Rose P.; Moore P. K. Hydrogen sulfide and cell signaling. Annu. Rev. Pharmacol. Toxicol. 2011, 51, 169–187. 10.1146/annurev-pharmtox-010510-100505. [DOI] [PubMed] [Google Scholar]
- d’Emmanuele di Villa Bianca R.; Sorrentino R.; Maffia P.; Mirone V.; Imbimbo C.; Fusco F.; De Palma R.; Ignarro L. J.; Cirino G. Hydrogen sulfide as a mediator of human corpus cavernosum smooth-muscle relaxation. Proc. Natl. Acad. Sci. U.S.A. 2009, 106, 4513–4518. 10.1073/pnas.0807974105. [DOI] [PMC free article] [PubMed] [Google Scholar]
- Hoffman M.Hydrogen Sulfide: Potential help for ED. WebMD, March 2, 2009.
- Boehning D.; Snyder S. H. Novel neural modulators. Annu. Rev. Neurosci. 2003, 26, 105–131. 10.1146/annurev.neuro.26.041002.131047. [DOI] [PubMed] [Google Scholar]
- Kimura H. Hydrogen sulfide as a neuromodulator. Mol. Neurobiol. 2002, 26, 13–19. 10.1385/MN:26:1:013. [DOI] [PubMed] [Google Scholar]
- Mao G. J.; Wei T. T.; Wang X. X.; Huan S. Y.; Lu D. Q.; Zhang J.; Zhang X. B.; Tan W.; Shen G. L.; Yu R. Q. High-Sensitivity Naphthalene-Based Two-Photon Fluorescent Probe Suitable for Direct Bio-imaging of H2S in Living Cells. Anal. Chem. 2013, 85, 7875–7881. 10.1021/ac401518e. [DOI] [PubMed] [Google Scholar]
- Yang W.; Yang G.; Jia X.; Wu L.; Wang R. Activation of KATP channels by H2S in rat insulin-secreting cells and the underlying mechanisms. J. Physiol. 2005, 569, 519–531. 10.1113/jphysiol.2005.097642. [DOI] [PMC free article] [PubMed] [Google Scholar]
- Jiang B.; Tang G.; Cao K.; Wu L.; Wang R. Molecular mechanism for H2S-induced activation of K (ATP) channels. Antioxid. Redox Signaling 2010, 12, 1167–1178. 10.1089/ars.2009.2894. [DOI] [PubMed] [Google Scholar]
- Sun W. H.; Liu F.; Chen Y.; Zhu Y. C. Hydrogen sulfide decreases the levels of ROS by inhibiting mitochondrial complex IV and increasing SOD activities in cardiomyocytes under ischemia/reperfusion. Biochem. Biophys. Res. Commun. 2012, 421, 164–169. 10.1016/j.bbrc.2012.03.121. [DOI] [PubMed] [Google Scholar]
- Eto K.; Asada T.; Arima K.; Makifuchi T.; Kimura H. Brain hydrogen sulfide is severely decreased in Alzheimer’s disease. Biochem. Biophys. Res. Commun. 2002, 293, 1485–1488. 10.1016/S0006-291X(02)00422-9. [DOI] [PubMed] [Google Scholar]
- Ichinohe A.; Kanaumi T.; Takashima S.; Enokido Y.; Nagai Y.; Kimura H. Cystathionine β-synthase is enriched in the brains of Down’s patients. Biochem. Biophys. Res. Commun. 2005, 338, 1547–1550. 10.1016/j.bbrc.2005.10.118. [DOI] [PubMed] [Google Scholar]
- Hu L. F.; Lu M.; Tiong C. X.; Dawe G. S.; Hu G.; Bian J. S. Neuroprotective effects of hydrogen sulfide on Parkinson’s disease rat models. Aging Cell 2010, 9, 135–146. 10.1111/j.1474-9726.2009.00543.x. [DOI] [PubMed] [Google Scholar]
- King A. L.; Polhemus D. J.; Bhushan S.; Otsuka H.; Kondo K.; Nicholson C. K.; Bradley J. M.; Islam K. N.; Calvert J. W.; Tao Y. X.; Dugas T. R.; Kelley E. E.; Elrod J. W.; Huang P. L.; Wang R.; Lefer D. J. Hydrogen sulfide cytoprotective signaling is endothelial nitric oxide synthase-nitric oxide dependent. Proc. Natl. Acad. Sci. U.S.A. 2014, 111, 3182–3187. 10.1073/pnas.1321871111. [DOI] [PMC free article] [PubMed] [Google Scholar]
- Adarsh N.; Krishnan M. S.; Ramaiah D. Sensitive Naked Eye Detection of Hydrogen Sulfide and Nitric Oxide by Aza-BODIPY Dyes in Aqueous Medium. Anal. Chem. 2014, 86, 9335–9342. 10.1021/ac502849d. [DOI] [PubMed] [Google Scholar]
- Reiffenstein R. J.; Hulbert W. C.; Roth S. H. Toxicology of hydrogen sulfide. Annu. Rev. Pharmacol. Toxicol. 1992, 32, 109–134. 10.1146/annurev.pa.32.040192.000545. [DOI] [PubMed] [Google Scholar]
- Chen C. Q.; Xin H.; Zhu Y. Z. Hydrogen sulfide: third gaseous transmitter, but with great pharmacological potential. Acta Pharmacol. Sin. 2007, 28, 1709–1716. 10.1111/j.1745-7254.2007.00629.x. [DOI] [PubMed] [Google Scholar]
- Wang R. Toxic Gas, Lifesaver. Sci. Am. 2010, 66–71. 10.1038/scientificamerican0310-66. [DOI] [PubMed] [Google Scholar]
- Kamoun P. H2S, a new neuromodulator. Méd. Sci. 2004, 20, 697–700. 10.1051/medsci/2004206-7697. [DOI] [PubMed] [Google Scholar]
- Lawrence N. S.; Deo R. P.; Wang J. J. Electrochemical determination of hydrogen sulfide at carbon nanotube modified electrodes. Anal. Chim. Acta 2004, 517, 131–137. 10.1016/j.aca.2004.03.101. [DOI] [Google Scholar]
- Doeller J. E.; Isbell T. S.; Benavides G.; Koenitzer J.; Patel H.; Patel R. P.; Lancaster J. R. Jr.; Darley-Usmar V. M.; Kraus D. W. Polarographic measurement of hydrogen sulfide production and consumption by mammalian tissues. Anal. Biochem. 2005, 341, 40–51. 10.1016/j.ab.2005.03.024. [DOI] [PubMed] [Google Scholar]
- Searcy D. G.; Peterson M. A. Hydrogen sulfide consumption measured at low steady state concentrations using a sulfidostat. Anal. Biochem. 2004, 324, 269–275. 10.1016/j.ab.2003.09.037. [DOI] [PubMed] [Google Scholar]
- Richardson C. J.; Magee E. A.; Cummings J. H. A new method for the determination of sulphide in gastrointestinal contents and whole blood by microdistillation and ion chromatography. Clin. Chim. Acta 2000, 293, 115–125. 10.1016/S0009-8981(99)00245-4. [DOI] [PubMed] [Google Scholar]
- Furne J.; Saeed A.; Levitt M. D. Whole tissue hydrogen sulfide concentrations are orders of magnitude lower than presently accepted values. Am. J. Physiol. 2008, 295, R1479–R1485. 10.1152/ajpregu.90566.2008. [DOI] [PubMed] [Google Scholar]
- Radford-Knoery J.; Cutter G. A. Determination of carbonyl sulfide and hydrogen sulfide species in natural waters using specialized collection procedures and gas chromatography with flame photometric detection. Anal. Chem. 1993, 65, 976–982. 10.1021/ac00056a005. [DOI] [Google Scholar]
- Bérubé P. R.; Parkinson P. D.; Hall E. R. Measurement of reduced sulphur compounds contained in aqueous matrices by direct injection into a gas chromatograph with a flame photometric detector. J. Chromatogr. A 1999, 830, 485–489. 10.1016/S0021-9673(98)00882-6. [DOI] [Google Scholar]
- Lei W.; Dasgupta P. K. Determination of sulfide and mercaptans in caustic scrubbing liquor. Anal. Chim. Acta 1989, 226, 165. 10.1016/S0003-2670(00)80915-0. [DOI] [Google Scholar]
- Hughes M. N.; Centelles M. N.; Moore K. P. Making and working with hydrogen sulfide: The chemistry and generation of hydrogen sulfide in vitro and its measurement in vivo: a review. Free Radic. Biol. Med. 2009, 47, 1346–1353. 10.1016/j.freeradbiomed.2009.09.018. [DOI] [PubMed] [Google Scholar]
- Jiménez D.; Martínez-Máñez R.; Sancenón F.; Ros-Lis J. V.; Benito A.; Soto J. A New Chromo-chemodosimeter Selective for Sulfide Anion. J. Am. Chem. Soc. 2003, 125, 9000–9001. 10.1021/ja0347336. [DOI] [PubMed] [Google Scholar]
- Lynn E. G.; Austin R. C. Hydrogen sulfide in the pathogenesis of atherosclerosis and its therapeutic potential. Expert Rev. Clin. Pharmacol. 2011, 4, 97–108. 10.1586/ecp.10.130. [DOI] [PubMed] [Google Scholar]
- Ishigami M.; Hiraki K.; Umemura K.; Ogasawara Y.; Ishii K.; Kimura H. A source of hydrogen sulfide and a mechanism of its release in the brain. Antioxid. Redox Signaling 2009, 11, 205–214. 10.1089/ars.2008.2132. [DOI] [PubMed] [Google Scholar]
- Das S.; Sarkar H. S.; Uddin M. R.; Rissanen K.; Mandal S.; Sahoo P. Differential detection and quantification of cyclic AMP and other adenosine phosphates in live cells. Chem. Commun. 2017, 53, 7600–7603. 10.1039/C7CC02935G. [DOI] [PubMed] [Google Scholar]
- Liu S.; Zhang L.; Yang T.; Yang H.; Zhang K. Y.; Zhao X.; Lv W.; Yu Q.; Zhang X.; Zhao Q.; Liu X.; Huang W. Development of upconversion luminescent probe for ratiometric sensing and bioimaging of hydrogen sulfide. ACS Appl. Mater. Interfaces 2014, 6, 11013–11017. 10.1021/am5035158. [DOI] [PubMed] [Google Scholar]
- Wu Z.; Liang D.; Tang X. Visualizing hydrogen sulfide in mitochondria and lysosome of living cells and in tumors of living mice with positively charged fluorescent chemosensors. Anal. Chem. 2016, 88, 9213–9218. 10.1021/acs.analchem.6b02459. [DOI] [PubMed] [Google Scholar]
- Wu Z.; Feng Y.; Geng B.; Liua J.; Tang X. Fluorogenic sensing of H2S in blood and living cells via reduction of aromatic dialkylamino N-oxide. RSC Adv. 2014, 4, 30398–30401. 10.1039/C4RA03677H. [DOI] [Google Scholar]
- Zhao C.; Zhang X.; Li K.; Zhu S.; Guo Z.; Zhang L.; Wang F.; Fei Q.; Luo S.; Shi P.; Tian H.; Zhu W.-H. Förster Resonance Energy Transfer Switchable Self-Assembled Micellar Nanoprobe: Ratiometric Fluorescent Trapping of Endogenous H2S Generation via Fluvastatin-Stimulated Upregulation. J. Am. Chem. Soc. 2015, 137, 8490–8498. 10.1021/jacs.5b03248. [DOI] [PubMed] [Google Scholar]
- Peng H.; Cheng Y.; Dai C.; King A. L.; Predmore B. L.; Lefer D. J.; Wang B. A fluorescent probe for fast and quantitative detection of hydrogen sulfide in blood. Angew. Chem., Int. Ed. 2011, 50, 9672–9675. 10.1002/anie.201104236. [DOI] [PMC free article] [PubMed] [Google Scholar]
- Lippert A. R.; New E. J.; Chang C. J. Reaction-based fluorescent probes for selective imaging of hydrogen sulfide in living cells. J. Am. Chem. Soc. 2011, 133, 10078–10080. 10.1021/ja203661j. [DOI] [PubMed] [Google Scholar]
- Zhang P.; Li J.; Li B.; Xu J.; Zeng F.; Lv J.; Wu S. A logic gate-based fluorescent sensor for detecting H2S and NO in aqueous media and inside live cells. Chem. Commun. 2015, 51, 4414–4416. 10.1039/C4CC09737H. [DOI] [PubMed] [Google Scholar]
- Zhou G.; Wang H.; Ma Y.; Chen X. A NBD fluorophore-based colorimetric and fluorescent chemosensor for hydrogen sulfide and its application for bioimaging. Tetrahedron 2013, 69, 867–870. 10.1016/j.tet.2012.10.106. [DOI] [Google Scholar]
- Chen T.; Zheng Y.; Xu Z.; Zhao M.; Xu Y.; Cui J. A red emission fluorescent probe for hydrogen sulfide and its application in living cells imaging. Tetrahedron Lett. 2013, 54, 2980–2982. 10.1016/j.tetlet.2013.03.133. [DOI] [Google Scholar]
- Sarkar H. S.; Ghosh A.; Das S.; Maiti P. K.; Maitra S.; Mandal S.; Sahoo P. Visualisation of DCP, a nerve agent mimic, in Catfish brain by a simple chemosensor. Sci. Rep. 2018, 8, 3402 10.1038/s41598-018-21780-5. [DOI] [PMC free article] [PubMed] [Google Scholar]
- Henthorn H. A.; Pluth M. D. Mechanistic insights into the H2S-mediated reduction of aryl azides commonly used in H2S detection. J. Am. Chem. Soc. 2015, 137, 15330–15336. 10.1021/jacs.5b10675. [DOI] [PMC free article] [PubMed] [Google Scholar]
- Germs A. C. Hydrogen sulphide production in eggs and egg products as a result of heating. J. Sci. Food Agric. 1973, 24, 7–16. 10.1002/jsfa.2740240103. [DOI] [PubMed] [Google Scholar]
- Hussain B.; Sultana T.; Sultana S.; Mahboob S.; Farooq M.; Al-Ghanim K.; Nadeem S. First report on fish cysteine as a biomarker of contamination in the river Chenab, Pakistan. Environ. Sci. Pollut. Res. 2016, 15495–15503. 10.1007/s11356-016-6711-4. [DOI] [PubMed] [Google Scholar]
- Wang W.; Rusin O.; Xu X.; Kim K. K.; Escobedo J. O.; Fakayode S. O.; Fletcher K. A.; Lowry M.; Schowalter C. M.; Lawrence C. M.; Fronczek F. R.; Warner I. M.; Strongin R. M. Detection of homocysteine and cysteine. J. Am. Chem. Soc. 2005, 127, 15949–15958. 10.1021/ja054962n. [DOI] [PMC free article] [PubMed] [Google Scholar]
- Williams A. T. R.; Winfield S. A.; Miller J. N. Relative fluorescence quantum yields using a computer-controlled luminescence spectrometer. Analyst 1983, 108, 1067–1071. 10.1039/an9830801067. [DOI] [Google Scholar]
- Das S.; Sarkar H. S.; Uddin M. R.; Mandal S.; Sahoo P. A chemosensor to recognize N-acyl homoserine lactone in bacterial biofilm. Sens. Actuators, B 2018, 259, 332–338. 10.1016/j.snb.2017.12.040. [DOI] [Google Scholar]
Associated Data
This section collects any data citations, data availability statements, or supplementary materials included in this article.


