

Abstract
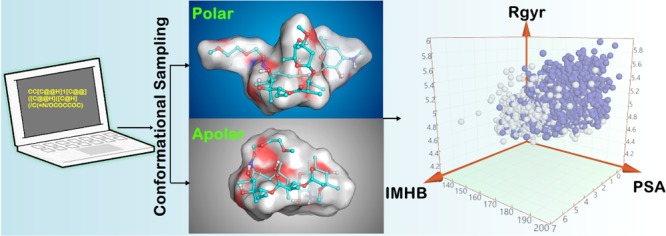
Conformational flexibility is a major determinant of the properties of macrocycles and other drugs in beyond rule of 5 (bRo5) space. Prediction of conformations is essential for design of drugs in this space, and we have evaluated three tools for conformational sampling of a set of 10 bRo5 drugs and clinical candidates in polar and apolar environments. The distance-geometry based OMEGA was found to yield ensembles spanning larger structure and property spaces than the ensembles obtained by MOE-LowModeMD (MOE) and MacroModel (MC). Both MC and OMEGA but not MOE generated different ensembles for polar and apolar environments. All three conformational search methods generated conformers similar to the crystal structure conformers for 9 of the 10 compounds, with OMEGA performing somewhat better than MOE and MC. MOE and OMEGA found all six conformers of roxithromycin that were identified by NMR in aqueous solutions, whereas only OMEGA sampled the three conformers observed in chloroform. We suggest that characterization of conformers using molecular descriptors, e.g., the radius of gyration and polar surface area, is preferred to energy- or root-mean-square deviation-based methods for selection of biologically relevant conformers in drug discovery in bRo5 space.
Introduction
Half of all protein targets thought to be involved in human diseases have been classified as difficult to drug1,2 with small molecules that comply with Lipinski’s rule of 5 (Ro5).3,4 Recent investigations have highlighted that macrocycles (here defined as having ≥12 atoms in the macrocycle ring)5,6 and other compounds residing in beyond rule of 5 (bRo5) chemical space,7−9 provide improved opportunities for modulation of difficult-to-drug targets.5,6,10 Since macrocycles are more prone to adopt disk- and spherelike conformations than non-macrocycles, they appear to be particularly well-suited to bind to targets that have large, flat, or groove-shaped binding sites,6,7 e.g., protein–protein interactions.11,12 Macrocyclization has also been suggested to contribute to improved cell permeability and intestinal absorption for compounds in bRo5 space.5,10,13,14 These two suggestions are consistent with the observed enrichment of macrocycles among oral drugs and clinical candidates in bRo5 space.8 Compounds in bRo5 space are likely to have more complex structures than those of Ro5 compliant molecules, and their synthesis will consequently be more challenging. This is a particular issue for macrocycles as the macrocyclization step is often sensitive to small structural variations and subject to low yields.15 It is therefore important to be able to predict the conformational preferences of macrocycles prior to synthesis to assess conformation-dependent properties, such as aqueous solubility, cell-permeability, and binding to targets and off-targets. Synthetic efforts can then focus on compounds with favorable predicted properties.
Recent publications indicate that interest in conformational sampling of macrocycles is increasing.16−25 Although a complete review of the literature is beyond the scope of this paper, studies of conformational sampling are characterized by the choice of sampling algorithm, the dataset of investigated structures, and the strategy used to evaluate the results. Algorithmic approaches to macrocycle conformational sampling include distance geometry (DG),16,17 dihedral angle-based sampling,21 molecular dynamics (MD),18,19 and inverse kinematics.20 A variety of datasets have been used to validate these methods: 19 macrocycles from three chemical classes [cyclo(Gly)x peptides, cyclodextrins, and cyclic peptide natural products],16 a diverse set of 67 macrocycles,20 and a set of 37 polyketides.21 Conformational sampling with different algorithms is usually evaluated by comparison of their ability to reproduce conformations observed in the solid state.17,25 The ability of different algorithms to reproduce the target-bound conformation of macrocycles has been discussed recently,22−24 and results have also been evaluated with regard to the structural diversity of conformational spaces sampled.25 Several studies have focused on the conformation adopted by the macrocycle core only,19−21 thereby omitting the conformation of attached side chains, which, however, are essential for target engagement as well as all other properties of the macrocycle.
Despite recent advances, it remains unclear how conformational sampling should be used to find relevant conformers of macrocycles. Hence, questions such as how the influence of the environment should best be incorporated in sampling and how relevant conformers can be identified among the theoretically reasonable pool of conformers remain to be answered. For further insights, we have evaluated the performance of MacroModel (MC),19 MOE-LowModeMD (MOE),18 and a novel method implemented most recently in OMEGA.26 We chose MC and MOE as they are used frequently and may be viewed as standard methods for sampling of macrocycles. MOE is based on a specifically designed MD approach, whereas MC is based on the perturbation of low frequency vibrational modes, and their output ensembles may depend on the starting three-dimensional (3D) conformation. Then, we selected OMEGA because it samples conformational space in a completely different manner than MC and MOE. OMEGA uses a DG method that is expected to explore conformational space in a more comprehensive manner, independent of the starting point. For results to be relevant to drug discovery, we selected a set of 10 drugs and clinical candidates of high structural complexity, including macrocycles and non-macrocyclic analogues. Importantly, the selected compounds reside in bRo5 chemical space where conformational flexibility has been proposed to be essential to allow them to adjust their properties to the surrounding environment.27−30 For example, conformations with intramolecular hydrogen bonds (IMHBs) present a less polar surface in an apolar environment, such as a cell membrane, whereas conformations lacking IMHBs expose a more polar surface in an aqueous environment.
Evaluating the accuracy, here, the reproduction of solid-state structures, by a new method in comparison to existing ones, is mandatory but not sufficient for applications in drug discovery. It is also essential to know (a) if and how conformational sampling is influenced by the dielectric constant of the solvent, (b) how molecular properties vary across the conformational space sampled, and (c) if the minimum energy conformer (MEC) is representative (or not) of the conformations populated by the compound in crystal structures of different origins, or in different solutions. To address these topics, we performed conformational sampling in polar and apolar environments. We evaluated conformational ensembles by comparison to solid-state structures and by assessing the variation across three molecular descriptors in both media. The radius of gyration (Rgyr) is an index of molecular dimensions and shape, the polar surface area (PSA) quantifies the polar regions of a molecule, and the number of intramolecular hydrogen bonds (IMHBs) heavily influences the whole molecular property profile. Conventional, extensive molecular dynamics (eMD) simulations were also performed for a subset of the drugs and clinical candidates in our dataset. Finally, NMR spectroscopy was used to determine how conformational preferences are influenced by the solvent for the erythronolide roxithromycin.
Results and Discussion
Dataset of Drugs and Clinical Candidates
We selected a dataset of five macrocyclic erythronolide antibacterial drugs, three macrocyclic Hepatitis C virus (HCV) NS3/4a protease inhibitors, and two non-macrocyclic HCV NS3/4a protease inhibitors (Figure 1). This set includes drugs and clinical candidates of high complexity that originate from natural products or from structure-based design. It allowed investigation of conformational sampling for 14- to 20-membered macrocycles, with up to three complex side chains pendant to the macrocyclic core.
Figure 1.

Structures of erythronolides and HCV NS3/4A protease inhibitors used in this study. Important structural differences amongst the erythronolides are shown in pink. Peptide backbones are indicated in red for the protease inhibitors, nonpeptidic atoms forming part of the macrocycles are in blue.
At least one crystal structure is available for each of the 10 selected drugs and clinical candidates (Table 1), allowing comparison to the conformational ensembles generated by the three search methods. Multiple crystal structures in which the compounds adopt different conformations have been reported for all erythronolides and the two non-macrocyclic HCV protease inhibitors, indicating that they may be conformationally flexible also in solution. Molecular weights ranged from 680 Da for telaprevir to 837 Da for roxithromycin, in the range of >600–700 Da where conformational flexibility has been suggested to be essential for drugs to display both adequate aqueous solubility and cell permeability.27,28,31 The macrocycles had 7–13 rotatable bonds in their side chains, and the two non-macrocyclic protease inhibitors had 18 and 19 rotatable bonds, respectively. For those compounds with multiple crystal structures showing two or more distinct conformations (here defined as root-mean-square deviation (RMSD) >0.75 Å between conformations), the maximum differences ranged from 0.93 Å RMSD for azithromycin to 6.13 Å RMSD for telithromycin.
Table 1. Crystal Structure Dataset for the Selected Erythronolides and HCV NS3/4A Protease Inhibitors.
| compound | MW (Da) | nRotBa | no. of structures | no. of conformationsb | max. RMSDc | IDd | resolution (Å) | R-factor (%) |
|---|---|---|---|---|---|---|---|---|
| erythromycin | 733.9 | 7 | 10 | 6 | 1.94 | 1YI2 | 2.65 | |
| 2J0D* | 2.75 | |||||||
| 3FRQ | 1.76 | |||||||
| QIFKEX | 2.92 | |||||||
| NAVTAF | 4.30 | |||||||
| LAPDEN* | 6.21 | |||||||
| clarithromycin | 748.0 | 8 | 14 | 3 | 3.13 | CIWJIC* | 3.36 | |
| NAVSUY01* | 6.16 | |||||||
| WANNUU | 4.50 | |||||||
| azithromycin | 749.0 | 7 | 7 | 2 | 0.93 | 1YHQ* | 2.40 | |
| GEGJAD* | 7.70 | |||||||
| roxithromycin | 837.1 | 13 | 3 | 3 | 4.60 | 1JZZ* | 3.8 | |
| FUXYOM | 4.70 | |||||||
| KAHWAT* | 1.68 | |||||||
| telithromycin | 812.0 | 11 | 5 | 5 | 6.13 | 1YIJ* | 2.60 | |
| 1P9X* | 3.40 | |||||||
| 4V7S | 3.25 | |||||||
| 4V7Z | 3.10 | |||||||
| 4WF9 | 3.43 | |||||||
| danoprevir | 729.8 | 11 | 3 | 1 | 3SU1 | 1.40 | ||
| grazoprevir | 768.9 | 10 | 4 | 1 | 3SUG | 1.80 | ||
| vaniprevir | 755.9 | 9 | 5 | 1 | 3SU4 | 2.26 | ||
| asunaprevir | 748.3 | 18 | 4 | 2 | 3.02 | 4WH6* | 1.99 | |
| MIYWOI* | 11.38 | |||||||
| telaprevir | 679.9 | 19 | 5 | 3 | 1.40 | 3SV6* | 1.40 | |
| 3SV7 | 1.55 | |||||||
| LERJID* | 4.69 |
Number of rotatable bonds calculated using Canvas.
Structures were clustered into conformations for which representative structures differed in RMSD by >0.75 Å.
RMSD between representative structures of the conformations displaying the largest structural variation for each compound.
The representative structures of the conformations displaying the largest variation for each compound have been indicated by an asterisk. RMSD values were calculated on the basis of all heavy atoms in the compounds.
Inspection of the conformations adopted by the erythronolides in the crystalline state shows that the macrocycles of erythromycin, the close analogue clarithromycin, and azithromycin maintain similar conformations across multiple crystal structures (Figure 2). The saccharide side chains of erythromycin and clarithromycin show more variability. Roxithromycin and telithromycin are different, with the multiple crystal structures showing significant conformational differences in the macrocyclic core and the attached side chains. The RMSDs between the least similar experimental conformations of these molecules are large (Table 1). The observed conformations also differ significantly in the number of IMHBs (roxithromycin, 0–2) or Rgyr (telithromycin, 4.90–7.63 Å). We expected that the strikingly different experimental conformations observed for roxithromycin and telithromycin would provide a challenging test system for conformational sampling algorithms.
Figure 2.

Overlays of the different conformations found in the crystalline state of each erythronolide. Overlays were generated by alignment of the heavy atoms in the macrocyclic core only for each erythronolide. The color used for the protein data bank (PDB) and Cambridge Structural Database (CSD) codes match those of the carbon atoms in the corresponding structures.
Only one crystal structure is available for each of the macrocyclic HCV NS3/4A protease inhibitors (Figure S1, Supporting Information), and they all originate from complexes with the protease. For the non-macrocyclic asunaprevir and telaprevir, the overlaid crystal structures show some variation between the small-molecule and protease complex crystal structures, most notably at the C-termini of these peptidomimetics. Consistent with known protease binding preferences, the peptidic backbones of both the macrocyclic and non-macrocyclic inhibitors adopt an extended β-strand conformation. In addition, the macrocycle linker provides an overall flat, disk-shaped conformation to the three macrocyclic inhibitors that matches the relatively flat binding site of the protease.
Conformational Sampling
The conformational spaces accessible to the 10 molecules in our set were explored with MC, MOE, and OMEGA, starting from the simplified molecular-input line-entry system (SMILES) codes of the compounds. The ionization state at physiological conditions (pH = 7.0) was used for all compounds. Sampling was performed both in apolar (vacuum, ε = 1) and polar (aqueous, ε = 80) environments to investigate how the polarity of the environment influenced the output. Conformations obtained within an energy window of 25 kcal/mol were retained, i.e., within a window that should be large enough to include all significant conformers and thus provide a comprehensive picture of the structure and property space exhibited by the different drugs. Conformations obtained from sampling with the three methods were energy-minimized using the molecular mechanics force field MMFF94s to ensure that the results were not affected by the use of different force fields for different methods.32
Comparison to Crystal Structures
As a DG-based conformational sampling method was recently implemented in OMEGA, we first evaluated OMEGA’s performance in comparison to that of MC and MOE with regards to how accurately crystal structures were reproduced. Comparison of the calculated minimum energy conformation of a compound to the experimentally determined crystal structure(s) using RMSD cutoffs of 2 and 4 Å, respectively, was used as the first criterion of accuracy (Figure 3A). The similarity between the sampled conformation most similar to the crystal structure (the minimum RMSD conformer, MRC) and that crystal structure was used as a second accuracy criterion (Figure 3B).
Figure 3.

MC, MOE, and OMEGA compared in terms of how accurately crystal structures are reproduced. (A) Accuracy in reproducing the crystal structure(s) of the 10 drugs and clinical candidates by the predicted minimum energy conformer (MEC) of each compound. (B) Accuracy in reproducing the crystal structure(s) by the conformer most similar to the crystal structure (the minimum RMSD conformer, MRC) for the 10 compounds. Both accuracies are given with RMSD cutoff of <2 and <4 Å for each of the three methods in apolar and polar environments, respectively. They were calculated from the data in Tables S1 and S2 in the Supporting Information.
The MECs predicted by the three methods reproduced the crystal structures with, at best, modest accuracy, on the basis of an RMSD cutoff of <2.0 Å (Figure 3A). Under the conditions used in this study, MC performed significantly better than MOE, which in turn performed better than OMEGA, in both environments. All methods predicted the crystal structures better in a polar environment than in vacuum. Nine of the 19 crystal structures of the five erythronolides were reproduced with an RMSD < 2.0 Å, with MC succeeding with all nine of these examples (Table S1, Supporting Information). With the exception of danoprevir, none of the methods were able to reproduce any of the eight crystal structures of the HCV NS3/4A protease inhibitors with <2.0 Å accuracy (Table S1, Supporting Information). However, when the RMSD cutoff was increased to the much more lenient <4.0 Å, all methods showed 70–95% accuracy in both environments, with OMEGA performing better than MC and MOE. Closer inspection of the overlays of the MECs calculated in water for the three macrocyclic protease inhibitors and the crystal structures revealed that the major structural differences were found in the orientation of the side chains, whereas the conformation of the macrocyclic core was reproduced with reasonable accuracy (often <1.0 Å RMSD, Table S3, Supporting Information). This was also the case for the macrocyclic cores of erythromycin, clarithromycin, and azithromycin, which all display limited variation across their different crystal structures. The cores of roxithromycin and telithromycin, which both show greater conformational difference across multiple structures, were reproduced less well by the three methods (Figure 2 and Table S3, Supporting Information). Just as for the overall structures, MC performed better than MOE and OMEGA in predicting the conformations of the macrocyclic cores.
The MRCs show how well each of the methods performs in generating a conformer similar to the experimental structure within a relatively tolerant energy window (here, chosen as <25 kcal/mol above the MEC). In an apolar environment, MRCs predicted by OMEGA reproduced the crystal structures significantly better than those predicted by MOE and MC when using the more demanding RMSD cutoff at <2 Å (Figure 3B). However, in a polar environment, all methods reproduced the crystal structures within 2.0 Å (accuracy >80%), with OMEGA performing marginally better than MC and MOE. The energies of the MRCs were in general significantly higher (>15 kcal/mol) than those of the MECs of the compound (Table S2, Supporting Information).
In summary, the MECs generated by the three methods reproduce the crystal structures of the 10 drugs and clinical candidates at best with modest accuracy, as judged by a <2 Å RMSD criteria. However, the cores in the eight macrocycles were usually reproduced with much better accuracy by the MECs, revealing the side chains as a significant source of uncertainty in conformational sampling. All methods found conformers (MRCs) close to the crystal structures, but they usually had significantly higher energies than those in the MEC. As judged by both accuracy criteria for reproduction of crystal structures, sampling carried out in a polar environment performed slightly better than in an apolar one. We conclude that OMEGA is complementary to MC and MOE as it performs better in finding a conformation close to that of crystal structures but worse as judged by the accuracy by which MECs reproduce crystal structures. OMEGA should therefore be considered as a viable method for conformational sampling of macrocycles and possibly also for other compounds with complex structures.
Comparison of Molecular Descriptors
We envisaged that property-based analysis of conformational ensembles could provide different information than comparisons based on RMSD values. Therefore, we first investigated a possible correlation between RMSD-based differences between conformations and variations in two 3D descriptors, Rgyr and PSA. This was done for the five drugs and clinical candidates in our dataset for which three or more distinct conformations are available in crystal structures (Table 1). Interestingly, only a weak correlation was observed between conformational differences (ΔRMSD) and differences in Rgyr, whereas no correlation was found between ΔRMSD and differences in PSA (Figure 4).
Figure 4.

Differences in (A) radius of gyration (Rgyr) and (B) polar surface area (PSA) plotted vs differences in RMSD for drugs and clinical candidates in the dataset that have three or more conformations. The crystal structure in which each of the five compounds adopts a conformation having the minimum Rgyr or 3D PSA, respectively, was chosen as reference. The reference value was then subtracted from the Rgyr and 3D PSA values, respectively, of the other conformations, and the differences were plotted vs the differences in RMSD.
To obtain additional information to that provided by RMSD values for the ensembles generated by MC, MOE, and OMEGA, we proceeded to calculate Rgyr, PSA, and the number of IMHBs for all conformers of the 10 compounds in our dataset. The calculated ranges and means for the three properties were then compared between conformational sampling methods and environments and also to the corresponding properties calculated from the crystal structure(s) of each compound.
Radius of Gyration (Rgyr)
The Rgyr of a compound in a specific conformation provides a numerical description of its size and shape and is calculated as the root-mean-square distance (RMSD) between the compound’s atoms and its center of mass. On the basis of studies of passive permeability, this 3D descriptor has been suggested to be a better surrogate for molecular size than MW, the 2D descriptor most typically used in this context.33
The calculated Rgyr ranges for the sampled conformations are small (<1 Å) for the first three erythronolides, somewhat larger for roxithromycin, and much larger for telithromycin (<2 Å), in particular, in a polar environment (Figures 5 and S2). This agrees well with the limited conformational flexibility inferred from the crystalline states of the first three and the greater flexibility observed for the latter two (Figure 2). Predicted Rgyr ranges are in general larger for the HCV protease inhibitors than for the erythronolides, ranging from approximately 0.7 Å for grazoprevir and vaniprevir (calculated with MC) up to >1.5 Å for danoprevir, vaniprevir, and asunaprevir (calculated with OMEGA). However, no major difference in the range of Rgyr was observed between the macrocyclic and non-macrocyclic protease inhibitors, tentatively indicating that they have similar flexibility. This finding is in line with a recent analysis of crystal structures from a wider set of bRo5 drugs and clinical candidates.7 OMEGA generally provides greater coverage of Rgyr space than MC, in particular for the erythronolides. Interestingly, all compounds in our dataset except for telithromycin had Rgyr ranges <7 Å, the value suggested as an upper cutoff for cell permeable small-molecule drugs; larger compounds often have poorer permeabilities.33 Thus, our results are largely consistent with the Rgyr cutoff of 7 Å for cell permeability and oral absorption.
Figure 5.

Radius of gyration (Rgyr) calculated for the erythronolides and HCV NS3/4A protease inhibitors. For each compound, Rgyr has been calculated for the conformation(s) adopted in the crystal structures and for the conformational ensembles generated by MC (green), MOE (pink), and OMEGA (yellow) in apolar and polar environments. Rgyr was calculated using the MOE software.34 Box plots show minimum and maximum values as whiskers; the boxes span the 25th–75th percentile range, and the MECs are indicated as black circles. Figure S2 shows these data plotted with a fixed scale for Rgyr for all 10 compounds.
Rgyr ranges are often smaller in apolar than in polar environments for ensembles from the three methods. Such an environmental influence is also pronounced for the median Rgyr values from OMEGA for all but azithromycin among the erythronolides but only for vaniprevir among the HCV protease inhibitors. MC and MOE show this dependence of median Rgyr on the environment for the majority of the protease inhibitors but not for the erythronolides. In contrast, the Rgyr values of the MECs for each compound do not show a consistent dependence on the environment.
The Rgyr ranges calculated from the ensembles obtained by the three methods in general include those of the crystal structures, both for the erythronolides and HCV protease inhibitors. Depending on the method used for sampling as well as on the specific drug investigated, the predicted and crystallographic median values may or may not be close in numerical value for the two classes of drugs. For example, all median Rgyr values for azithromycin and danoprevir are similar, whereas those for clarithromycin and telaprevir show significant variation. However, the Rgyr of the MEC shows even larger variation and is extremely dependent both on the drug and the method applied for sampling. Thus, in spite of their variation, the Rgyr values of the median conformations in the ensembles are closer to those of the crystal structures than those of the MECs.
Polar Surface Area
Polarity is a molecular property of great importance in drug discovery.35,36 It is thought to play a pivotal role in permeability and solubility and other absorption, distribution, metabolism, and excretion-related properties. Polar Surface Area (PSA) is a widely used descriptor of polarity and is commonly defined as the surface area of a molecule that arises from oxygen and nitrogen atoms, plus hydrogens attached to these atoms.
The predicted PSA ranges of the sampled conformations of the investigated compounds varied from approximately 30 to 60 Å2 between compounds and with the sampling method used to generate the ensembles (Figures 6 and S3). Interestingly, compounds such as erythromycin, clarithromycin, and azithromycin that displayed limited Rgyr ranges showed major variations in PSA between conformations (Figure S3). This observation further highlights the lack of correlation between variations in 3D structure and PSA discussed above (Figure 4). Ranges calculated from ensembles generated by OMEGA were generally larger than those obtained with MC and MOE, whereas only very minor differences between values calculated in apolar and polar environments were observed. Median and MEC PSA values were lower in apolar than polar environments for the ensembles from MC and OMEGA but not for MOE. Thus, the median and MEC conformations derived from MC and OMEGA are consistent with the idea that flexible compounds conformationally adapt to reduce their PSA in an apolar environment as compared to that in a polar one.
Figure 6.

Polar surface area (PSA) calculated for the erythronolides and HCV NS3/4A protease inhibitors. For each compound, PSA has been calculated for the conformation(s) adopted in the crystal structures and for the conformational ensembles generated by MC (green), MOE (pink), and OMEGA (yellow) in apolar and polar environments. PSA was calculated on the basis of the surface area of the molecule that arises from oxygen and nitrogen atoms, plus their attached hydrogen atoms, using the Schrödinger software.37,38 Box plots show minimum and maximum values as whiskers; the boxes span the 25th–75th percentile range, and the MECs are indicated as black circles. Figure S3 shows these data plotted with a fixed scale for PSA for all 10 compounds.
For the erythronolides, predicted PSA ranges included those of the crystal structures, with the exception of telithromycin for which all predicted ranges apart from the one obtained in an apolar environment by OMEGA were smaller than those of the crystal structures. With only two exceptions, the predicted PSA for the HCV protease inhibitors included the values of the crystal structures.
For both classes of drugs, the PSA of the MEC varies dramatically with the sampling method and the nature of the environment. Sometimes it is found within the 25th–75th percentiles (c.f. roxithromycin and telaprevir), but often it is located in the 0th–25th percentile. For the erythronolides, the median PSA values obtained from the conformational ensembles provide a better approximation of the median PSA of the crystal structures of each compound than the PSA of the MEC. However, such a correlation was not observed for the HCV protease inhibitors, possibly because there is only one crystal structure for each of the three macrocycles.
Intramolecular Hydrogen Bonding
Among the five erythronolides, all but telithromycin displayed up to two IMHBs in their crystal structures (Figure 7). The ensembles obtained by conformational sampling with OMEGA covered a larger conformational space, with both ranges and median values of IMHBs being higher than those for MC and MOE. As judged by comparison of the 25th–75th percentiles or the MECs, for each compound, all three methods generated ensembles having more IMHBs in an apolar than a polar environment but to various extents. OMEGA was more consistent in predicting this dependence on the environment, which is in line with how a conformationally flexible compound would be expected to adapt to its environment.27−30 The IMHB ranges predicted by all three methods, both in apolar and polar media, included the number of IMHBs observed in the crystal structures. Usually, the MECs of the different ensembles contained a larger number of IMHBs, than that observed in the crystal structures, in particular, MECs predicted by MC and OMEGA in vacuum.
Figure 7.

Number of IMHBs in the crystal structures and in the conformational ensembles generated by MC (green), MOE (pink), and OMEGA (yellow) in apolar and polar environments for the erythronolides. IMHBs were calculated using the Schrödinger software.37,38 Box plots show minimum and maximum values as whiskers; the boxes span the 25th–75th percentile range, and the MECs are indicated as black circles.
Neither the macrocyclic nor the non-macrocyclic HCV NS3/4A protease inhibitors displayed IMHBs in their crystal structures, most of which are complexed with the protease (Figure S4, Supporting Information). This behavior is consistent with the expected binding mode for peptidelike active site protease inhibitors where hydrogen bonds are instead formed between the inhibitor and the protease. However, the ensembles from conformational sampling of each inhibitor included conformations with up to a range of two to four IMHBs. As for the erythronolides, OMEGA sampled a conformational space with more IMHBs than MC and MOE and also had a higher degree of IMHB formation in an apolar than a polar environment.
Extensive MD (eMD) Simulations
Extensive molecular dynamics (eMD) simulations are often used to evaluate the molecular property space described by the “natural” fluctuations of a molecule, starting from a single conformation.39 We applied a standard eMD method,40 with CPU demands consistent with those in routine application in the context of a medicinal chemistry project, to a subset of the 10 compounds in our dataset. Our aim was to investigate whether methods for conformational sampling, such as MC, MOE, and OMEGA, explore a different molecular property space than that explored by eMD and to study whether molecular property ranges obtained from eMD varied when explicit solvents of different polarities were used in the simulations.
We selected six compounds that are structurally diverse but still representative of the full set of 10 drugs and clinical candidates (c.f. structures in Figure 1). For the erythronolides, we choose the parent compound erythromycin, the ring-expanded azithromycin, and roxithromycin, which has a flexible side chain attached to the macrocycle. The macrocyclic HCV NS3/4A protease inhibitors belong to two different structural classes, and one from each class was selected, i.e., danoprevir and grazoprevir. Asunaprevir, which constitutes a non-macrocyclic analogue of danoprevir, was also included. Starting from their SMILES structures, these six compounds were submitted to eMD simulations in explicit water and chloroform, the latter used as a model of an apolar environment. The stability of the systems was confirmed by the modest fluctuations of their potential energies (Figure S5A,B, Supporting Information). The trajectories of the six selected compounds were then used to evaluate the molecular property space populated by each compound and compared to that populated by the ensembles from OMEGA (Figure S6, Supporting Information), which samples the largest molecular property space of the three methods for conformational sampling evaluated herein (cf. above).
Rgyr and PSA space from the ensembles obtained by eMD were in general smaller than those for the ensemble from OMEGA, both in an apolar and polar environment (Figure S6, Supporting Information). In addition, the Rgyr and PSA ranges from eMD and OMEGA showed limited overlap for several compounds, revealing that eMD often samples a different property space than that by OMEGA. Both for Rgyr and PSA, the ranges from eMD often included the respective values for the crystal structures but major discrepancies were found for either or both properties for half of the selected compounds. Some influence of the polarity of the solvent on Rgyr and PSA was observed in the eMD simulations (Figure S6, Supporting Information). Thus, the Rgyr ranges and PSA medians were both smaller in chloroform than in water for the six compounds, with erythromycin and azithromycin PSA medians showing the largest differences.
Conformations of Roxythromycin in Chloroform and Water
To gain experimental insight into the conformational flexibility of macrocycles and the variation of their conformational landscape between apolar and polar environments, we studied the conformations of roxithromycin in chloroform and water by NMR spectroscopy. The solution ensembles were used as an independent set of data for comparison to the ensembles generated by MC, MOE, and OMEGA. Roxithromycin was selected as three X-ray crystal structures differing in RMSD by up to 4.6 Å have been reported (Table 1), indicating a significant molecular flexibility that should be challenging for conformational sampling. Previous NMR studies of roxithromycin concluded that its predominant solution conformation in chloroform resembles its geometry in one of its crystal structures (KAHWAT)41 and emphasized the importance of intramolecular hydrogen bonding in the stabilization of the macrolide conformation.42 NMR studies have also been performed in methanolic solution, suggesting that the conformation identified for chloroform remains dominant. The aqueous solution conformation of roxithromycin has so far not been studied nor the influence of the polarity of the environment on its overall molecular conformation.
As roxithromycin can be expected to exist as a dynamic ensemble of interconverting conformations in solution, we analyzed it in water and chloroform solutions using the NAMFIS algorithm43 that has previously been successfully applied for the description of the solution ensemble of various flexible macrocycles.44−51 Experimental population-averaged distances were determined by the acquisition of nuclear Overhauser enhancement (NOE) buildups at 900 MHz and by conversion of the initial buildup rates into interproton distances (Tables S6 and S7, Supporting Information). A theoretical ensemble covering the entire available conformational space was generated using an unrestrained Monte Carlo conformational search using water and chloroform solvation models. Monte Carlo simulations were used so that the solution ensembles obtained by NMR would be independent of the ensembles generated by MC, MOE, and OMEGA, thereby allowing validation of the output from these three methods by the results from NMR. Following redundant conformation elimination, conformations from all individual searches were combined and used as theoretical input for the NAMFIS analyses. Solution ensembles were determined by varying the probability of each conformation and fitting the back-calculated distances for each computationally predicted conformation to the experimentally determined population-averaged distances derived from the NMR studies in chloroform and water (Table S9, Supporting Information), respectively.
The best fit, providing the lowest RMSD of the experimental and probability-averaged theoretical data, was obtained for ensembles possessing three conformations in chloroform (Figure 8) and six conformations in water (Figure 9). The lower number and less diverse conformational families in chloroform as compared to those in water reveal a higher molecular flexibility in the more polar environment. In chloroform, the methoxy group of the oxime side chain forms a hydrogen bond to OH-11 of the macrocycle in all three conformations (Figure 8A). It should also be noted that the highest populated conformation in chloroform (71%) resembles the conformation observed in one of the crystal structures of roxithromycin (KAHWAT), with the polar functionalities being buried from solvent by intramolecular hydrogen bonds and the oxime chain oriented over the macrocycle (Figure 8B). This observation is in good agreement with those of previous investigations.42,52,53 In aqueous solution, the oxime chain shows higher flexibility and is solvent-exposed in a majority of the conformations, representing 82% of the solution ensemble (Figure 9A,B). Only two of the minor conformations in water display intramolecular hydrogen bonds to the oxime side chain, one of them (conformation 2) being found also in chloroform. The most populated conformation in water (59%) has some resemblance to the conformation observed in one of the crystal structures of roxithromycin (FUXYOM), with the major differences originating from the orientation of the two monosaccharides (Figure 9C). Interestingly, the target-bound structure of roxithromycin (1JZZ) is similar to one of the minor conformations (14%) observed in water (Figure 9D). The latter observation is consistent with the expectation54−56 that the protein-bound conformation of a flexible ligand should be measurably populated when free in aqueous solution. However, in contrast to earlier reports,57 the dominant conformation in chloroform shows lower similarity to the bioactive conformation of roxithromycin. Importantly, our observations demonstrate a major influence of solvent polarity on the conformation of roxithromycin, with a more rigid and closed ensemble being adopted in chloroform and a more flexible and solvent-exposed one being observed in water.
Figure 8.

Solution ensemble of roxithromycin in CDCl3, as determined by NAMFIS analysis, and comparison to one of the crystal structures of roxithromycin. (A) An overlay of the three conformations found in CDCl3 with the most populated one indicated in green (number 3). The conformation also found in D2O is indicated in blue (number 2). (B) Overlay of the most populated conformation (number 3, green) and the most similar crystal structure (CSD KAHWAT, orange); RMSD = 1.82 Å. Hydrogen bonds to the oxime side chain of roxithromycin are indicated by black dotted lines, whereas nonpolar hydrogen atoms have been omitted for clarity.
Figure 9.

Solution ensemble of roxithromycin in D2O, as determined by NAMFIS analysis and comparisons to two of the crystal structures of roxithromycin. (A, B) Overlays of the six conformations found in D2O, with the most populated one in green (number 4). For clarity, conformation 4 has been compared to four of the conformations in (A) and to one of the most different ones in (B). (C) Overlay of the most populated conformation (number 4, green) and the most similar crystal structure (CSD FUXYOM, orange); RMSD = 2.93 Å. (D) Overlay of solution conformation 2, with the crystal structure (PDB 1JZZ, orange) that is most similar to any of the six solution conformations; RMSD = 2.02 Å. Hydrogen bonds to the oxime side chain of roxithromycin are indicated by black dotted lines in (C) and (D), and nonpolar hydrogen atoms have been omitted for clarity in (A)–(D).
The MECs predicted by MC, MOE, and OMEGA for apolar and polar environments were unable to accurately reproduce the different conformations observed for roxithromycin in chloroform or water (Table S4, Supporting Information). However, conformational sampling did explore similar (RMSD < 2 Å) conformations within the energy window used in our study (<25 kcal/mol; Figure 10). OMEGA stood out by reproducing the three solution conformations found in chloroform, whereas MOE was able to reproduce one of the two minor conformations. In water, MOE reproduced all six solution conformations with higher frequencies than those of OMEGA whereas MC reproduced the major conformation (number 4) with high accuracy, as well as two of the minor conformations.
Figure 10.

Ability of conformations in the ensembles generated by MC, MOE, and OMEGA to reproduce the solution ensembles of roxithromycin in chloroform and water, as determined by NMR spectroscopy. Reproducibilities have been determined as the frequency of conformations found within an RMSD cutoff of <2 Å of each of the solution conformations. The population (in %) of each solution conformation, as determined by NMR spectroscopy, is stated below the number of the conformation.
As expected, roxithromycin populates a larger property space in water than in chloroform (Figure 11, PSA and IMHB panels). Comparison of Rgyr, PSA, and IMHBs for the major conformation identified by NMR spectroscopy to the predicted median values revealed that OMEGA had the best correlation for Rgyr, both for polar and apolar solutions. PSA was well predicted both by the medians of MC and OMEGA, whereas MC showed the best correlation for IMHBs in an apolar environment and OMEGA did so for polar environments. Median values from MOE differed more from those of the conformations populated in solution than those from MC and OMEGA, which agrees well with that MOE is influenced by the environment to a lesser extent than MC and OMEGA (cf. above). These observations indicate that conformational sampling by MC or OMEGA, followed by ranking of conformations by Rgyr and PSA and selection of the median conformations may constitute an approach to prediction of the properties of macrocycles in apolar and polar environments. However, median Rgyr and PSA conformations do not necessarily constitute an approximation of the 3D structure of the experimental conformations.
Figure 11.

Radius of gyration (Rgyr), polar surface area (PSA), and intramolecular hydrogen bonding (IMHB) for roxithromycin. The descriptors have been calculated for the conformations observed in the three crystal structures of roxithromycin, for the conformations adopted in apolar (CDCl3) and polar (D2O) solutions, as determined by NMR spectroscopy, and for the median conformations in the ensembles obtained by conformational sampling (CS) using MC (green), MOE (pink), and OMEGA (yellow) in apolar and polar environments. The population (in %) of each solution conformation, as determined by NMR spectroscopy, is stated adjacent to the corresponding descriptor values. The most populated conformations are indicated in red.
Conclusions
Conformational flexibility is required for bRo5 drugs to possess adequate aqueous solubility, cell permeability, and oral absorption, as well as potent target binding.27−30 To facilitate drug discovery, the prediction of biologically relevant conformers for drug candidates in bRo5 space is therefore of major interest.
To gain understanding of the influence of the polarity of the environment on the ensembles, we have applied three different computational methods for conformational sampling to a set of eight macrocyclic and two non-macrocyclic bRo5 drugs and clinical candidates, providing the following key findings. First, consistent with earlier studies,17,25 the experimentally determined conformations for the 10 compounds were usually not accurately reproduced by the MEC generated by the three computational methods. Instead, the experimental structures were often found at higher energies within the ensembles. OMEGA performed somewhat better than MC and MOE in sampling conformations structurally similar to those of the crystal structures. Second, as expected, different methods for conformational sampling generated different results from the same input. OMEGA in general provided ensembles of conformers describing a larger structure and property space than those described by ensembles of conformers provided by MC and MOE, which most likely explains its better performance in sampling conformations similar to crystal structures. MECs often differ significantly between these methods. Third, the impact of the polarity of the environment in governing the conformational behavior in bRo5 space cannot be neglected, as revealed by the NMR studies of roxithromycin. Both MC and OMEGA generated different ensembles for apolar and polar environments, whereas the output from MOE was less dependent on the environment. However, only OMEGA sampled conformational space that included the solution ensembles of roxithromycin in apolar and polar solutions, as determined by NMR spectroscopy.
The difference in performance shown by OMEGA, as compared to that shown by MC and MOE, in the current investigation most likely originates in the different algorithms implemented by the three methods. MOE is based on a specifically designed MD approach and MC is based on the perturbation of low frequency vibrational modes, whereas OMEGA decomposes molecules into its constituent atoms and generates different arrangements under distance constraints. The reconstruction of the molecules permits OMEGA to explore a larger conformational space than that covered by MC and MOE. In addition, OMEGA samples conformational space independent of the starting conformation, whereas ensembles generated by MC and MOE may depend on the starting conformation.
Our findings provide some guidance for the identification of conformers of bRo5 molecules for use in the prediction of properties that contribute to solubility and cell permeability. To maximize the likelihood of identifying biologically relevant conformers, simulations should be carried out in both polar and apolar media but the MECs are not good representatives of the biologically relevant conformations. Instead, molecular descriptors such as Rgyr and PSA appear to provide advantages compared with criteria based on energies and geometry (e.g., RMSD) for the selection or clustering of conformers. In fact, median conformations from ensembles ranked by Rgyr or PSA provided better estimates of the properties of conformations adopted in the solid state or in solution, in particular, for ensembles generated by MC and OMEGA.
Experimental Section
X-ray Crystal Structures
A dataset of crystal structures for 10 drugs and clinical candidates was assembled (Figure 1). It is composed of five macrocyclic erythronolides (erythromycin, clarithromycin, azithromycin, roxithromycin, and telithromycin) and five HCV NS3 protease inhibitors, three of which are macrocyclic (danoprevir, vaniprevir, and grazoprevir) and two are non-macrocyclic drugs (asunaprevir and telaprevir). All crystal structures of these 10 compounds were retrieved from the PDB (www.rcsb.org/pdb)58 and CSD (www.ccdc.cam.ac.uk)59 using searches by common name, synonyms, and chemical structure.
From the PDB, only crystal structures with a resolution <3 Å were included in the dataset, except for one structure for each of roxithromycin (1JZZ: 3.8 Å) and telithromycin (1P9X: 3.4 Å) in which the structures showed interesting conformations (see Results and Discussion). All structures found in the CSD for the 10 compounds were included in the dataset. The structures were imported and analyzed with the Maestro tool from the Schrödinger Suite.37 Hydrogen atoms were added according to the ionization state at pH 7.4 using the Epik tool.60 No further structural refinements were carried out.
Conformational Sampling
The simplified molecular-input line-entry system (SMILES) codes of the 10 compounds were obtained from the PubChem database.61 Stereochemistry in the SMILES was carefully cross-checked with both the DrugBank database62 and the U.S. Food and Drug Administration label. Initial conformations were generated by importing the SMILES codes into the Maestro module of the Schrödinger Suite.37 Chirality and protonation states were verified and corrected with Epik tool.60 The resulting conformations were used as input for conformational sampling with MOE-LowModeMD18 and MC (MacroModel−Large Scale Low Mode sampling),19 whereas the SMILES codes where used directly as input for OMEGA.26 Generation of starting conformations from SMILES codes in this manner is rapid and provides consistent input across structures and search methods.
For sampling of macrocyclic molecules, OMEGA uses a method for conformational sampling that relies on distance geometry with constraints.26 Initially, a molecule is decomposed into its constituent atoms and the heavy atoms and chiral hydrogen atoms are placed at random coordinates in a Cartesian space. This arrangement is minimized under distance constraints using eq 1. In eq 1, di,j represents interatomic distances and ci,j represents lower or upper distance constraints from a force field (OMEGA uses MMFF94s)32,63 whereas Vk represents tetrahedral constraints arising from planarity or atom or bond chirality.
| 1 |
If all constraints are met, a rough candidate conformation for the molecule is formed, which is then refined against MMFF94. The product of the refinement is a candidate conformation for the molecule at a local minimum in the MMFF94 potential energy surface. Candidate conformations are retained if they are unique in their geometry. At the conclusion of the calculation (when a preset number of DG attempts have been completed), the resulting ensemble of conformations is ranked by energy. High-energy conformations and duplicates, the latter based on heavy atom RMSD, are removed. More extensive details on the OMEGA algorithm are to be published soon.26
For each of the three methods, two different environments, vacuum (ε = 1) and aqueous (ε = 80.0) environment, were used. Either the Born solvation model64,65 (MOE and MC) or the Sheffield solvation model66 (OMEGA) were used to mimic an aqueous environment. The following settings were used throughout the study: energy window (ewindow, 25 kcal/mol), elimination of duplicate conformer threshold (RMSD, 0.75 Å), the total number of iterations (10 000 steps), and force field (MMFF94s). In MOE, the rejection limit was increased from the default 100–500; the search is deemed complete when this number of consecutive search iterations fails to identify a new conformation. For all search methods, the MM iteration limit, the maximum number of energy minimization steps performed during the minimization of each conformer, was set to 10 000 steps. Conformations obtained from sampling with all three methods were energy-minimized using the same molecular mechanics force field, i.e., MMFF94s.32
Extensive Molecular Dynamics (eMD) Simulations
The same initial conformers were used for conformational sampling (cf. above) for the six compounds selected for eMD simulations, as described in detail elsewhere.40 TIP3P water molecules (∼1500 water molecules) were added with a 10 Å buffering distance between the edges of the truncated octahedron box. For chloroform (ε = 4.8, frcmod.chcl3), a 30 Å buffering distance was used (approximately 1200–2000 solvent molecules in the box). MD production was run for 20 ns using a time step of 2 fs, and coordinates were saved every 10 ps (in total 2000 snapshots). Initial geometry optimization and MD simulations were performed using Gaussian 0967 and Amber 14 software,68 respectively.
Comparison of Conformers
To compare the conformations generated from different programs to the experimentally observed conformations from X-ray crystal structures and the ensembles determined by NMR spectroscopy, the RMSD metric was used as implemented in the OpenEye Toolkit (rmsd.py; root-mean-square deviation of all nonhydrogen atom positions).69
Structural properties such as the number of intramolecular hydrogen bonds (IMHBs) and polar surface area (PSA) were calculated using the Schrödinger software.37,38 Conformation-dependent radius of gyration (Rgyr) for all conformations was calculated using the MOE software.34
NMR Spectroscopy
NMR spectra were recorded on a 900 MHz BRUKER Avance III HD NMR spectrometer equipped with a TCI cryogenic probe at 25 °C for D2O and CDCl3 solutions. Assignments were based on NOESY/TOCSY walks, whereas NOESY buildups were acquired with seven mixing times varying between 100 and 700 ms. Spectra were acquired with 16 scans, 4096 points in the direct whereas 512 points in the indirect dimension, with d1 as 2.5 s and without solvent suppression. Interproton distances were calculated according to the initial rate approximation from the linear part of the buildups (r2 > 0.98) using the germinal methylene protons as an internal distance reference (1.78 Å). The nuclear Overhauser effect (NOE) peak intensities were calculated using normalization of both cross peaks and diagonal peaks according to ([cross peak1 × cross peak2]/[diagonal peak1 × diagonal peak2])0.5. Initial NOE buildup rates were converted into distances using the equation rij = rref(σref/σij)(1/6), where rij is the distance between protons i and j in angstrom and σij is the normalized intensity obtained from NOESY experiments. Further information is provided in the Supporting Information.
NAMFIS Analysis
Unrestrained conformational searches were performed using the Monte Carlo algorithm with intermediate torsion sampling, 50 000 Monte Carlo steps, and RMSD cutoff set to 2.0 Å, followed by molecular mechanics energy minimization with the software Macromodel (v.9.1), as implemented in the Schrödinger package. For energy minimization, the Polak–Ribiere type conjugate gradient algorithm was used with 5000 maximum iteration steps. All conformations within 42 kJ/mol from the global minimum were saved. Conformational searches were done using the OPLS-2005 and the Amber* force field, with water and chloroform solvation models. The ensembles from the conformational searches using the different force fields were combined. Redundant conformations were eliminated by comparison of heavy atom coordinates applying an RMSD cutoff of 1–1.5 Å, giving input ensembles encompassing 62 versus 38 conformations, in water and chloroform, respectively, that were used in NAMFIS.
Solution ensembles were determined using the NAMFIS algorithm43,70 by fitting the experimentally measured distances and coupling constants to those back-calculated for the computationally predicted conformations. Distances involving methylene protons were treated as d = (((d1–6) + (d2–6))/2)−1/6 and those involving methyl protons according to d = (((d1–6) + (d2–6) + (d3–6))/3)−1/6. The validity of the output ensembles was confirmed using standard methods, that is, through evaluation of the reliability of the conformational restraints by the addition of 10% random noise to the experimental data, by the random removal of individual restraints, and by comparison of the experimentally observed and back-calculated distances. Since the orientations of oxime side chain and the sugars of roxithromycin are not equally well described by the experimental data as the macrocyclic core, and are less well predicted by the theoretical conformational search, only the NMR data of the macrocycle was included in the initial NAMFIS analyses (for details, see the Supporting Information). The goodness of the fit of the experimental to theoretical data was expressed as the sum of the square differences (SSDs) between the measured and modeled variables (a lower SSD reflects a better fit), as previously described by Snyder et al.70 Subsequent qualitative analysis of the NOEs observed between the protons of the macrocycle and those of the oxime chain as well as of the saccharides corroborated the conclusions that were drawn from the NAMFIS analyses. Further information about the NAMFIS analysis is provided in the Supporting Information.
Acknowledgments
This work was funded by grants from Janssen Biopharmacueticals and the Swedish Research Council (grant no. 2016-05160, J.K. and 2016-03602, M.E.). We thank Paul Jackson at Janssen R&D for support during this project and OpenEye scientific software and ChemAxon for providing free academic licenses. We are indebted to Renee DesJarlais for a rigorous and insightful review during manuscript preparation.
Supporting Information Available
The Supporting Information is available free of charge on the ACS Publications website at DOI: 10.1021/acsomega.8b01379.
Tabulated data and figures comparing calculated conformational ensembles to experimental structures for the 10 drugs and clinical candidates in the investigated dataset; tabulated data for the NMR-based structural determination of roxithromycin in chloroform and water (PDF)
Author Present Address
○ Department of Chemistry—BMC, Uppsala University, P.O. Box 576, SE-75123 Uppsala, Sweden (E.D.).
Author Contributions
The manuscript was written through contributions of all authors. All authors have given approval to the final version of the manuscript.
The authors declare no competing financial interest.
Supplementary Material
References
- Surade S.; Blundell T. L. Structural biology and drug discovery of difficult targets: the limits of ligandability. Chem. Biol. 2012, 19, 42–50. 10.1016/j.chembiol.2011.12.013. [DOI] [PubMed] [Google Scholar]
- Perola E.; Herman L.; Weiss J. Development of a rule-based method for the assessment of protein druggability. J. Chem. Inf. Model. 2012, 52, 1027–1038. 10.1021/ci200613b. [DOI] [PubMed] [Google Scholar]
- Hopkins A. L.; Groom C. R. The druggable genome. Nat. Rev. Drug Discovery 2002, 1, 727–730. 10.1038/nrd892. [DOI] [PubMed] [Google Scholar]
- Rask-Andersen M.; Masuram S.; Schiöth H. B. The druggable genome: evaluation of drug targets in clinical trials suggests major shifts in molecular class and indication. Annu. Rev. Pharmacol. Toxicol. 2014, 54, 9–26. 10.1146/annurev-pharmtox-011613-135943. [DOI] [PubMed] [Google Scholar]
- Giordanetto F.; Kihlberg J. Macrocyclic drugs and clinical candidates: what can medicinal chemists learn from their properties?. J. Med. Chem. 2014, 57, 278–295. 10.1021/jm400887j. [DOI] [PubMed] [Google Scholar]
- Villar E. A.; Beglov D.; Chennamadhavuni S.; Porco J. A. Jr.; Kozakov D.; Vajda S.; Whitty A. How proteins bind macrocycles. Nat. Chem. Biol. 2014, 10, 723–731. 10.1038/nchembio.1584. [DOI] [PMC free article] [PubMed] [Google Scholar]
- Doak B. C.; Zheng J.; Dobritzsch D.; Kihlberg J. How beyond rule of 5 drugs and clinical candidates bind to their targets. J. Med. Chem. 2016, 59, 2312–2327. 10.1021/acs.jmedchem.5b01286. [DOI] [PubMed] [Google Scholar]
- Doak B. C.; Over B.; Giordanetto F.; Kihlberg J. Oral druggable space beyond the rule of 5: insights from drugs and clinical candidates. Chem. Biol. 2014, 21, 1115–1142. 10.1016/j.chembiol.2014.08.013. [DOI] [PubMed] [Google Scholar]
- DeGoey D. A.; Chen H.-J.; Cox P. B.; Wendt M. D. Beyond the rule of 5: lessons learned from AbbVie’s drugs and compound collection. J. Med. Chem. 2018, 61, 2636–2651. 10.1021/acs.jmedchem.7b00717. [DOI] [PubMed] [Google Scholar]
- Driggers E. M.; Hale S. P.; Lee J.; Terrett N. K. The exploration of macrocycles for drug discovery--an underexploited structural class. Nat. Rev. Drug Discovery 2008, 7, 608–624. 10.1038/nrd2590. [DOI] [PubMed] [Google Scholar]
- Arkin M. R.; Tang Y.; Wells J. A. Small-molecule inhibitors of protein-protein interactions: progressing toward the reality. Chem. Biol. 2014, 21, 1102–1114. 10.1016/j.chembiol.2014.09.001. [DOI] [PMC free article] [PubMed] [Google Scholar]
- Scott D. E.; Bayly A. R.; Abell C.; Skidmore J. Small molecules, big targets: drug discovery faces the protein-protein interaction challenge. Nat. Rev. Drug Discovery 2016, 15, 533–550. 10.1038/nrd.2016.29. [DOI] [PubMed] [Google Scholar]
- Brandt W.; Haupt V. J.; Wessjohann L. A. Chemoinformatic analysis of biologically active macrocycles. Curr. Top. Med. Chem. 2010, 10, 1361–1379. 10.2174/156802610792232060. [DOI] [PubMed] [Google Scholar]
- Mallinson J.; Collins I. Macrocycles in new drug discovery. Future Med. Chem. 2012, 4, 1409–1438. 10.4155/fmc.12.93. [DOI] [PubMed] [Google Scholar]
- Marsault E.; Peterson M. L. Macrocycles are great cycles: applications, opportunities, and challenges of synthetic macrocycles in drug discovery. J. Med. Chem. 2011, 54, 1961–2004. 10.1021/jm1012374. [DOI] [PubMed] [Google Scholar]
- Bonnet P.; Agrafiotis D. K.; Zhu F.; Martin E. Conformational analysis of macrocycles: finding what common search methods miss. J. Chem. Inf. Model. 2009, 49, 2242–2259. 10.1021/ci900238a. [DOI] [PubMed] [Google Scholar]
- Hawkins P. C.; Nicholls A. Conformer generation with OMEGA: learning from the data set and the analysis of failures. J. Chem. Inf. Model. 2012, 52, 2919–2936. 10.1021/ci300314k. [DOI] [PubMed] [Google Scholar]
- Labute P. LowModeMD--implicit low-mode velocity filtering applied to conformational search of macrocycles and protein loops. J. Chem. Inf. Model. 2010, 50, 792–800. 10.1021/ci900508k. [DOI] [PubMed] [Google Scholar]
- Watts K. S.; Dalal P.; Tebben A. J.; Cheney D. L.; Shelley J. C. Macrocycle conformational sampling with MacroModel. J. Chem. Inf. Model. 2014, 54, 2680–2696. 10.1021/ci5001696. [DOI] [PubMed] [Google Scholar]
- Coutsias E. A.; Lexa K. W.; Wester M. J.; Pollock S. N.; Jacobson M. P. Exhaustive conformational sampling of complex fused ring macrocycles using inverse kinematics. J. Chem. Theory Comput. 2016, 12, 4674–4687. 10.1021/acs.jctc.6b00250. [DOI] [PMC free article] [PubMed] [Google Scholar]
- Wang Q.; Sciabola S.; Barreiro G.; Hou X.; Bai G.; Shapiro M. J.; Koehn F.; Villalobos A.; Jacobson M. P. Dihedral angle-based sampling of natural product polyketide conformations: application to permeability prediction. J. Chem. Inf. Model. 2016, 56, 2194–2206. 10.1021/acs.jcim.6b00237. [DOI] [PubMed] [Google Scholar]
- Chen I. J.; Foloppe N. Tackling the conformational sampling of larger flexible compounds and macrocycles in pharmacology and drug discovery. Bioorg. Med. Chem. 2013, 21, 7898–7920. 10.1016/j.bmc.2013.10.003. [DOI] [PubMed] [Google Scholar]
- Anighoro A.; de la Vega de León A.; Bajorath J. Predicting bioactive conformations and binding modes of macrocycles. J. Comput. Aided Mol. Des. 2016, 30, 841–849. 10.1007/s10822-016-9973-5. [DOI] [PubMed] [Google Scholar]
- Alogheli H.; Olanders G.; Schaal W.; Brandt P.; Karlen A. Docking of macrocycles: comparing rigid and flexible docking in Glide. J. Chem. Inf. Model. 2017, 57, 190–202. 10.1021/acs.jcim.6b00443. [DOI] [PubMed] [Google Scholar]
- Sindhikara D.; Spronk S. A.; Day T.; Borrelli K.; Cheney D. L.; Posy S. L. Improving accuracy, diversity, and speed with prime macrocycle conformational sampling. J. Chem. Inf. Model. 2017, 57, 1881–1894. 10.1021/acs.jcim.7b00052. [DOI] [PubMed] [Google Scholar]
- Hawkins P. C. D., Wlodek S., Eds.; OMEGA, version 3.0; OpenEye Scientific Software: Santa Fe, NM, in preparation, 2016.
- Matsson P.; Doak B. C.; Over B.; Kihlberg J. Cell permeability beyond the rule of 5. Adv. Drug Delivery Rev. 2016, 101, 42–61. 10.1016/j.addr.2016.03.013. [DOI] [PubMed] [Google Scholar]
- Whitty A.; Zhong M.; Viarengo L.; Beglov D.; Hall D. R.; Vajda S. Quantifying the chameleonic properties of macrocycles and other high-molecular-weight drugs. Drug Discovery Today 2016, 21, 712–717. 10.1016/j.drudis.2016.02.005. [DOI] [PMC free article] [PubMed] [Google Scholar]
- Rezai T.; Yu B.; Millhauser G. L.; Jacobson M. P.; Lokey R. S. Testing the conformational hypothesis of passive membrane permeability using synthetic cyclic peptide diastereomers. J. Am. Chem. Soc. 2006, 128, 2510–2511. 10.1021/ja0563455. [DOI] [PubMed] [Google Scholar]
- Caron G.; Ermondi G. Updating molecular properties during early drug discovery. Drug Discovery Today 2017, 22, 835–840. 10.1016/j.drudis.2016.11.017. [DOI] [PubMed] [Google Scholar]
- Sebastiano M. R.; Doak B. C.; Backlund M.; Poongavanam V.; Over B.; Ermondi G.; Caron G.; Matsson P.; Kihlberg J. Impact of dynamically exposed polarity on permeability and solubility of chameleonic drugs beyond the rule of 5. J. Med. Chem. 2018, 61, 4189–4202. 10.1021/acs.jmedchem.8b00347. [DOI] [PubMed] [Google Scholar]
- Halgren T. A. Merck molecular force field. I. Basis, form, scope, parameterization, and performance of MMFF94. J. Comput. Chem. 1996, 17, 490–519. . [DOI] [Google Scholar]
- Guimarães C. R. W.; Mathiowetz A. M.; Shalaeva M.; Goetz G.; Liras S. Use of 3D properties to characterize beyond rule-of-5 property space for passive permeation. J. Chem. Inf. Model. 2012, 52, 882–890. 10.1021/ci300010y. [DOI] [PubMed] [Google Scholar]
- Molecular Operating Environment (MOE), 2015.10; Chemical Computing Group ULC, 1010 Sherbooke St. West, Suite #910, Montreal, QC, Canada, H3A 2R7, 2016.
- Clark D. E. What has polar surface area ever done for drug discovery?. Future Med. Chem. 2011, 3, 469–484. 10.4155/fmc.11.1. [DOI] [PubMed] [Google Scholar]
- Caron G.; Ermondi G. Molecular descriptors for polarity: the need for going beyond polar surface area. Future Med. Chem. 2016, 8, 2013–2016. 10.4155/fmc-2016-0165. [DOI] [PubMed] [Google Scholar]
- Maestro, Schrödinger Release 2015-1; Schrödinger, LLC: New York, NY, 2016.
- QikProp, Schrödinger Release 2015-1; Schrödinger, LLC: New York, NY, 2016.
- Foloppe N.; Chen I. J. Conformational sampling and energetics of drug-like molecules. Curr. Med. Chem. 2009, 16, 3381–3413. 10.2174/092986709789057680. [DOI] [PubMed] [Google Scholar]
- Poongavanam V.; Olsen J. M.; Kongsted J. Binding free energy based structural dynamics analysis of HIV-1 RT RNase H-inhibitor complexes. Integr. Biol. 2014, 6, 1010–1022. 10.1039/C4IB00111G. [DOI] [PubMed] [Google Scholar]
- Bachet B.; Brassy C.; Mornon J. P. [O-(Dioxa-2,5 hexyl) oxime]-9 de l’erythromycine A hydratee. Acta Crystallogr., Sect. C: Cryst. Struct. Commun. 1988, 44, 112–116. 10.1107/S0108270187008540. [DOI] [Google Scholar]
- Gharbi-Benarous J.; Ladam P.; Delaforge M.; Girault J.-P. A conformational exploration of the protonated and unprotonated macrolide antibiotic roxithromycin: comparative study by molecular dynamics and NMR spectroscopy in solution. J. Chem. Soc., Perkin Trans. 2 1992, 1989–2006. 10.1039/p29920001989. [DOI] [Google Scholar]
- Cicero D. O.; Barbato G.; Bazzo R. NMR analysis of molecular flexibility in solution: a new method for the study of complex distributions of rapidly exchanging conformations. application to a 13-residue peptide with an 8-residue loop. J. Am. Chem. Soc. 1995, 117, 1027–1033. 10.1021/ja00108a019. [DOI] [Google Scholar]
- Erdélyi M.; Pfeiffer B.; Hauenstein K.; Fohrer J.; Gertsch J.; Altmann K.-H.; Carlomagno T. Conformational preferences of natural and C3-modified epothilones in aqueous solution. J. Med. Chem. 2008, 51, 1469–1473. 10.1021/jm7013452. [DOI] [PubMed] [Google Scholar]
- Erdélyi M. Application of the halogen bond in protein systems. Biochemistry 2017, 56, 2759–2761. 10.1021/acs.biochem.7b00371. [DOI] [PubMed] [Google Scholar]
- Andersson H.; Danelius E.; Jarvoll P.; Niebling S.; Hughes A. J.; Westenhoff S.; Brath U.; Erdelyi M. Assessing the ability of spectroscopic methods to determine the difference in the folding propensities of highly similar beta-hairpins. ACS Omega 2017, 2, 508–516. 10.1021/acsomega.6b00484. [DOI] [PMC free article] [PubMed] [Google Scholar]
- Danelius E.; Brath U.; Erdelyi M. Insight into beta-hairpin stability: interstrand hydrogen bonding. Synlett 2013, 24, 2407–2410. 10.1055/s-0033-1339670. [DOI] [Google Scholar]
- Danelius E.; Pettersson M.; Bred M.; Min J.; Waddell M. B.; Guy R. K.; Grotli M.; Erdelyi M. Flexibility is important for inhibition of the MDM2/p53 protein-protein interaction by cyclic [small beta]-hairpins. Org. Biomol. Chem. 2016, 14, 10386–10393. 10.1039/C6OB01510G. [DOI] [PubMed] [Google Scholar]
- Andersson H.; Demaegdt H.; Vauquelin G.; Lindeberg G.; Karlen A.; Hallberg M.; Erdelyi M.; Hallberg A. Disulfide cyclized tripeptide analogues of angiotensin IV as potent and selective inhibitors of insulin-regulated aminopeptidase (IRAP). J. Med. Chem. 2010, 53, 8059–8071. 10.1021/jm100793t. [DOI] [PubMed] [Google Scholar]
- Thepchatri P.; Cicero D. O.; Monteagudo E.; Ghosh A. K.; Cornett B.; Weeks E. R.; Snyder J. P. Conformations of Laulimalide in DMSO-d6. J. Am. Chem. Soc. 2005, 127, 12838–12846. 10.1021/ja042890e. [DOI] [PubMed] [Google Scholar]
- Jogalekar A. S. Conformations of stevastelin C3 analogs: computational deconvolution of NMR data reveals conformational heterogeneity and novel motifs. Biopolymers 2010, 93, 968–976. 10.1002/bip.21504. [DOI] [PubMed] [Google Scholar]
- Gharbi-Benarous J.; Delaforge M.; Artaud I.; Girault J.-P. Analysis of the 1H and 13C NMR spectra of the novel macrolide antibiotic roxithromycin. Structure and conformation in solution. Magn. Reson. Chem. 1990, 28, 846–855. 10.1002/mrc.1260281003. [DOI] [Google Scholar]
- Gharbi-Benarous J.; Ladam P.; Delaforge M.; Girault J.-P. Conformational analysis of major metabolites of macrolide antibiotics roxithromycin and erythromycin A with different biological properties by NMR spectroscopy and molecular dynamics. J. Chem. Soc., Perkin Trans. 2 1993, 2303–2321. 10.1039/p29930002303. [DOI] [Google Scholar]
- Jiménez-Barbero J.; Canales A.; Northcote P. T.; Buey R. M.; Andreu J. M.; Díaz J. F. NMR determination of the bioactive conformation of peloruside a bound to microtubules. J. Am. Chem. Soc. 2006, 128, 8757–8765. 10.1021/ja0580237. [DOI] [PubMed] [Google Scholar]
- Altschuh D.; Vix O.; Rees B.; Thierry J. C. A conformation of cyclosporin A in aqueous environment revealed by the X-ray structure of a cyclosporin-Fab complex. Science 1992, 256, 92. 10.1126/science.1566062. [DOI] [PubMed] [Google Scholar]
- Thepchatri P.; Eliseo T.; Cicero D. O.; Myles D.; Snyder J. P. Relationship among ligand conformations in solution, in the solid state, and at the Hsp90 binding site: Geldanamycin and radicicol. J. Am. Chem. Soc. 2007, 129, 3127–3134. 10.1021/ja064863p. [DOI] [PubMed] [Google Scholar]
- Bertho G.; Gharbi-Benarous J.; Delaforge M.; Girault J. P. Transferred nuclear Overhauser effect study of macrolide-ribosome interactions: correlation between antibiotic activities and bound conformations. Bioorg. Med. Chem. 1998, 6, 209–221. 10.1016/S0968-0896(97)10028-1. [DOI] [PubMed] [Google Scholar]
- Berman H. M.; Westbrook J.; Feng Z.; Gilliland G.; Bhat T. N.; Weissig H.; Shindyalov I. N.; Bourne P. E. The Protein Data Bank. Nucleic Acids Res. 2000, 28, 235–242. 10.1093/nar/28.1.235. [DOI] [PMC free article] [PubMed] [Google Scholar]
- Groom C. R.; Bruno I. J.; Lightfoot M. P.; Ward S. C. The Cambridge Structural Database. Acta Crystallogr., Sect. B: Struct. Sci., Cryst. Eng. Mater. 2016, 72, 171–179. 10.1107/S2052520616003954. [DOI] [PMC free article] [PubMed] [Google Scholar]
- MacroModel, Schrödinger Release 2015-1; Schrödinger, LLC: New York, NY, 2016.
- Kim S.; Thiessen P. A.; Bolton E. E.; Chen J.; Fu G.; Gindulyte A.; Han L.; He J.; He S.; Shoemaker B. A.; Wang J.; Yu B.; Zhang J.; Bryant S. H. PubChem substance and compound databases. Nucleic Acids Res. 2016, 44, D1202–D1213. 10.1093/nar/gkv951. [DOI] [PMC free article] [PubMed] [Google Scholar]
- Wishart D. S.; Knox C.; Guo A. C.; Shrivastava S.; Hassanali M.; Stothard P.; Chang Z.; Woolsey J. DrugBank: a comprehensive resource for in silico drug discovery and exploration. Nucleic Acids Res. 2006, 34, D668–D672. 10.1093/nar/gkj067. [DOI] [PMC free article] [PubMed] [Google Scholar]
- Spellmeyer D. C.; Wong A. K.; Bower M. J.; Blaney J. M. Conformational analysis using distance geometry methods. J. Mol. Graphics Modell. 1997, 15, 18–36. 10.1016/S1093-3263(97)00014-4. [DOI] [PubMed] [Google Scholar]
- Still W. C.; Tempczyk A.; Hawley R. C.; Hendrickson T. Semianalytical treatment of solvation for molecular mechanics and dynamics. J. Am. Chem. Soc. 1990, 112, 6127–6129. 10.1021/ja00172a038. [DOI] [Google Scholar]
- Qiu D.; Shenkin P. S.; Hollinger F. P.; Still W. C. The GB/SA continuum model for solvation. a fast analytical method for the calculation of approximate born radii. J. Phys. Chem. A 1997, 101, 3005–3014. 10.1021/jp961992r. [DOI] [Google Scholar]
- Grant J. A.; Pickup B. T.; Sykes M. J.; Kitchen C. A.; Nicholls A. A simple formula for dielectric polarisation energies: The Sheffield solvation Model. Chem. Phys. Lett. 2007, 441, 163–166. 10.1016/j.cplett.2007.05.008. [DOI] [Google Scholar]
- Frisch M. J.; Trucks G. W.; Schlegel H. B.; Scuseria G. E.; Robb M. A.; Cheeseman J. R.; Scalmani G.; Barone V.; Mennucci B.; Petersson G. A.; Nakatsuji H.; Caricato M.; Li X.; Hratchian H. P.; Izmaylov A. F.; Bloino J.; Zheng G.; Sonnenberg J. L.; Hada M.; Ehara M.; Toyota K.; Fukuda R.; Hasegawa J.; Ishida M.; Nakajima T.; Honda Y.; Kitao O.; Nakai H.; Vreven T.; Montgomery J. A.; Peralta J. E.; Ogliaro F.; Bearpark M.; Heyd J. J.; Brothers E.; Kudin K. N.; Staroverov V. N.; Kobayashi R.; Normand J.; Raghavachari K.; Rendell A.; Burant J. C.; Iyengar S. S.; Tomasi J.; Cossi M.; Rega N.; Millam J. M.; Klene M.; Knox J. E.; Cross J. B.; Bakken V.; Adamo C.; Jaramillo J.; Gomperts R.; Stratmann R. E.; Yazyev O.; Austin A. J.; Cammi R.; Pomelli C.; Ochterski J. W.; Martin R. L.; Morokuma K.; Zakrzewski V. G.; Voth G. A.; Salvador P.; Dannenberg J. J.; Dapprich S.; Daniels A. D.; Farkas O.; Foresman J. B.; Ortiz J. V.; Cioslowski J.; Fox D. J.. Gaussian 09, revision B.01; Gaussian, Inc.: Wallingford, CT, 2009.
- Case D. A.; Babin V.; Berryman J. T.; Betz R. M.; Cai Q.; Cerutti D. S.; Cheatham T. E.; Darden T. A.; Duke R. E.; Gohlke H.; Goetz A. W.; Gusarov S.; Homeyer N.; Janowski P.; Kaus J.; Kolossváry I.; Kovalenko A.; Lee T. S.; LeGrand S.; Luchko T.; Luo R.; Madej B.; Merz K. M.; Paesani F.; Roe D. R.; Roitberg A.; Sagui C.; Salomon-Ferrer R.; Seabra G.; Simmerling C. L.; Smith W.; Swails J.; Walker; Wang J.; Wolf R. M.; Wu X.; Kollman P. A.. Amber 14, 2014.
- OpenEye-Toolkits; OpenEye Scientific Software: Santa Fe, NM, 2016. http://www.eyesopen.com.
- Nevins N.; Cicero D.; Snyder J. P. A test of the single-conformation hypothesis in the analysis of NMR data for small polar molecules: A force field comparison. J. Org. Chem. 1999, 64, 3979–3986. 10.1021/jo9824450. [DOI] [Google Scholar]
Associated Data
This section collects any data citations, data availability statements, or supplementary materials included in this article.