Abstract
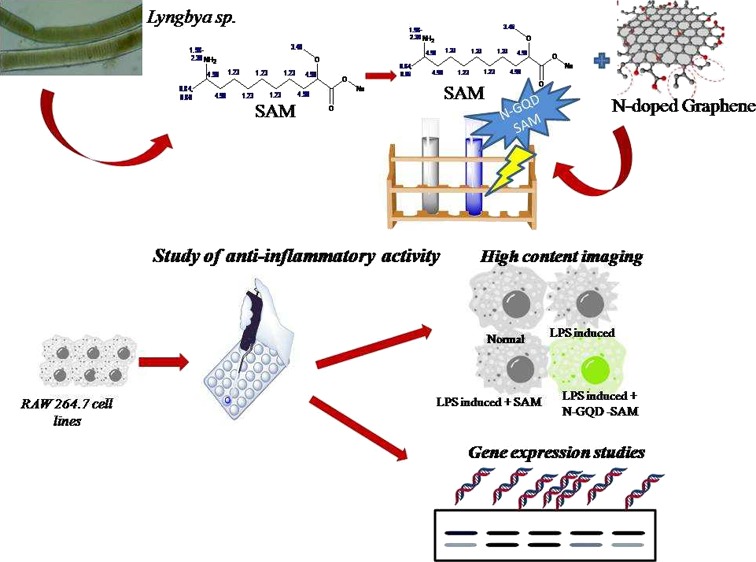
Marine cyanobacteria are renowned for producing bioactive secondary metabolites with great structural diversity via mixed biosynthetic pathways. Lyngbya sp., a marine cyanobacterium, produces many metabolites with anti-inflammatory potentials; nevertheless, its bioactive metabolites exercising providing protection against inflammation has been deciphered inadequate. In this study, the ethanolic fraction of the Lyngbya sp. extract was purified and identified as sodium 10-amino-2-methoxyundecanoate (SAM) using Fourier-transform infrared spectroscopy, nuclear magnetic resonance, and electron spray ionization-mass spectroscopy. SAM showed prominent inhibition of inflammation, which was analyzed by reactive oxygen species generation and nitric oxide (NO) inhibition assay. Furthermore, the anti-inflammatory potentials of SAM were evaluated in lipopolysaccharide (LPS)-induced RAW 264.7 macrophage cell lines by fluorescence-activated cell sorting analysis, which evidenced prominent decrease in COX-2 expression (∼90%) with SAM-treated cells than the control. Subsequently, a semiquantitative real-time polymerase chain reaction analysis also revealed the downregulation of COX-2, iNOS, TNF-α, NF-κß, IL-1α, IL-1ß, IL-4, and IL-6 gene expression in SAM-treated LPS-induced RAW 264.7 cells. To further enhance the delivery of SAM into the cells, it was combined with N-doped graphene quantum dots (N-GQDs) for the anti-inflammatory potentials. It resulted in improved downregulation of COX-2, iNOS, TNF-α, NF-κß, IL-1α, IL-1ß, IL-4, and IL-6 than cells treated with SAM alone. Conclusively, N-GQDs combined with SAM have the effective therapeutic potential as an inhibitor of inflammation by modulating the expression of different cytokine genes.
1. Introduction
Noncommunicable diseases such as cancer, rheumatoid arthritis, cardiovascular disease, asthma, and bronchitis are caused by inflammation.1 Macrophages play a vital role in signalling of inflammatory pathways and secrete cytokines (IL-1α, IL-1β, IL-4, IL-6, NF-κß, and TNF-α) and immune modulators including nitric oxide (NO) and cyclooxygenase (COX). The enzymes COX-2 and inducible nitric oxide synthase (iNOS) are mainly involved in the development of numerous inflammatory diseases.2 Hence, for targeting the expression of the above said enzymes, many nonsteroidal anti-inflammatory drugs (NSAIDs) are widely used as therapeutic drugs to inhibit the COX synthesis, which is involved in the prostaglandin biosynthesis. COX exists in two isoforms such as COX-1 (constitutive isoform) and COX-2 (inducible isoform). COX-2 specifically induces inflammation by macrophage cells, but its induction in normal tissues is undetectable, whereas COX-1 is constitutively expressed in normal human tissues.3 COX-1 is mainly responsible for producing physiological levels of prostaglandins to maintain housekeeping functions.4 COX-2 is induced after the proinflammatory cytokine stimulation for the production of prostaglandins, and thus, the inhibitors selectively required to reduce the amount of COX-2 to provide anti-inflammatory action should be more effective than the commonly used NSAIDs.5
Marine microorganisms are the natural, richest source for bioactive compounds that can be used to develop new therapeutics in the pharmaceutical industry because of their therapeutic potentials as antioxidant, anti-inflammatory, and antimicrobial agents and anticancer activity in humans.6 Among the marine organisms, cyanobacteria Lyngbya sp. are known to form bloom in the marine habitat and produce a harmful environment.7 However, their secondary metabolites have been reported to have a wide scope of biological activities.8 Interestingly, the genera Lyngbya alone produces a large number of bioactive molecules9 among which only few of their potentials were well explored and several products still remain unexplored. Lyngbya sp. isolated from the marine environment possesses enzymes involved in the nonribosomal polyketide synthetase and polyketide synthetase pathways, which are the vital indicators of production of a variety of secondary metabolites.10,11
In recent years, demand for the synthesis of fluorescent nanomaterials alternative to traditional dyes gained huge attention.12 In contrast to organic dyes, these nanomaterials have quantum size effect and overcome many shortcomings like low stability, weak fluorescence, and poor solubility in water.13 Among the different fluorescent nanomaterials to date, graphene quantum dots (GQDs) received huge interest because of their low toxicity, high photochemical stability, and excellent solubility in water.14 Because of these interesting properties, they are used in a variety of applications including bioimaging, catalysis, sensors, and solar cells. Subsequently, GQDs doped with heteroatoms, in particular nitrogen-doped GQDs (N-GQDs), have been actively investigated in recent years because of their optical and surface features.15 The doping of nitrogen provides large surface area to adsorb the analyte molecules because the surface energy of the system can be reduced by the doped nitrogen atoms ingrained in the lattice. It has been already demonstrated that GQDs have excellent low toxicity and are biocompatible agents for labeling stem cells.16 In addition to GQDs, the cytotoxicity of N-GQDs and graphene oxide (GO) for red blood cells is also studied. It was found that N-GQDs have much lower toxicity than GO.17 The N-GQDs have important features such as splendid water solubility, photostability, excitation dependent fluorescence, excellent biocompatibility, and high cell permeability. Because of such kinds of fascinating properties, N-GQDs can be used in biosensing, bioimaging, drug delivery, and other biological applications.13,18,19
Thus, in nutshell, this study is aimed to investigate on the structural elucidation and characterization of bioactive compounds from Lyngbya sp. using Fourier-transform infrared spectroscopy (FT-IR), nuclear magnetic resonance (NMR), and electron spray ionization-mass spectroscopy (ESI-MS) and to explore their anti-inflammatory action through inhibition of different cytokine expression in RAW 264.7 cell lines stimulated with a lipopolysaccharide (LPS). Further, the efficient delivery of compounds was improved by N-GQDs in macrophage cell lines.
2. Results and Discussion
2.1. Identification of Cyanobacteria
The morphology of Lyngbya sp. was observed under the light microscope, and it appeared as bluish-green long filamentous, segmented, and straight or somewhat wavelike filaments, which were about 40 μm wide with discrete visible, solid, and colorless sheaths (Figure 1). The morphological features were also similar to the features of the genera Lyngbya sp. that was already reported.20
Figure 1.
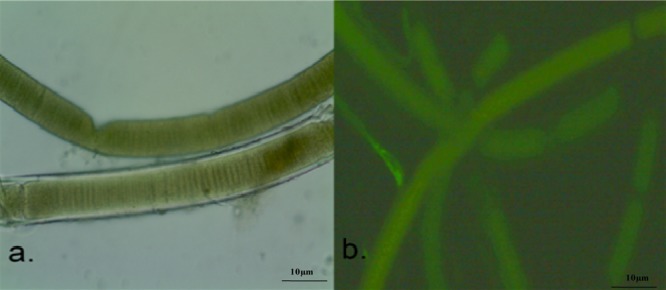
Microscopic observation of Lyngbya sp. (a) Light microscopy (40×) and (b) autofluorescence microscopy images of Lyngbya sp. at the emission range of 400–500 nm under a fluorescence microscope.
2.2. Extraction and Separation of the Compound from Lyngbya sp.
The dried sample of Lyngbya sp. (100 g) was used to extract the compound that was then separated using silica gel column chromatography with a hexane–ethanol–methanol gradient. The total dry weight of the ethanolic fraction of the separated bioactive compound was 6.4 mg/mL after column purification, which was used further for structural elucidation.
2.3. Structural Elucidation of the Bioactive Compound from Lyngbya sp.
The pure ethanolic fraction containing a single compound was characterized by high-performance liquid chromatography (HPLC) and FT-IR spectroscopy which revealed the presence of various functional groups appearing at different wave numbers (Figure S1). The functional groups present in the compound showed similarity to the known malyngamides and lyngbic acid derivatives.21 Further, for the elucidation and confirmation of the molecular structure of this purified compound, a NMR measurement was performed. The 1H NMR spectrum for the purified compound is shown in Figure S2, and the obtained peaks and their assignments are given in Table S1. The appearance of a singlet peak at 3.47 ppm indicates the presence of the −OCH3 group. The broad signal at 4.13 ppm corresponds to the NH2 group. The peak at 2.31 ppm is due to a C–H proton of the ester and methoxy-attached carbon. Another C–H peak appears at 1.99 ppm. At 0.85 ppm, the appearance of a doublet peak indicates that the −CH3 group was attached with one of the −CH groups. The CH3 group may be attached with the carbon bearing either the amine or methoxy group. The peak at 1.25 ppm corresponds to 10 protons at a similar environment. This is possible only if the five CH2 groups are present in a continuous manner. There is one CH2 group merged with the huge peak at 1.12 and this should correspond to C-3 protons. If the amine group is present in the C-2 position, it should form an intramolecular hydrogen bond. In such a case, the peak would be shifted to 8–10 ppm (deshielding). However, that peak appeared at 4.13 ppm, indicating that the NH2 group was present at the C-10 position, with carbon possessing a methyl group (C-11). We have also carried out two-dimensional (2D) NMR (Figure S3) to confirm the position of the amine group. The electrospray ionization mass spectroscopy (ESI-MS spectrum) (Figure S4) revealed the mass of the compound, sodium 10-amino-2-methoxyundecanoate (SAM), to be 253.09. On the basis of the above results, the structure was elucidated as SAM (Figure S5).
2.4. Effect of SAM in the NO Scavenging Assay
NO is produced by various cell types, which plays a key function during inflammation, where macrophages induce the expression of proinflammatory genes like iNOS through cytokines and produce NO. iNOS is generally responsible for sustained NO production at higher levels. NO functions as a host defence molecule which is toxic to infectious agents and may induce adverse reactions that could cause damage to other tissues of the host itself.22 The regulation of NO production serves as an important therapeutic target against inflammatory diseases. In this study, the cells treated with SAM affected NO production and exhibiting noticeable NO scavenging activity (IC50 value 117.98 ± 0.41 μg/mL) that prevents the induced inflammatory response.
2.5. Anti-Inflammatory Activity of SAM in RAW 264.7 Cell Lines
2.5.1. Cell Cytotoxicity Assay
The cytotoxic effect of SAM was determined at different concentrations (5–100 μg/mL) on LPS-stimulated RAW 264.7 cell lines. The result of this analysis demonstrated that there was no effect of SAM on cell viability up to 24 h (Figure S7). Therefore, 100 μg/mL of SAM was nontoxic, which was further used for the study of COX-2 expression.
2.5.2. Assay for COX-2 Expression Using Fluorescence-Activated Cell Sorting in RAW 264.7 Cell Lines Treated with SAM
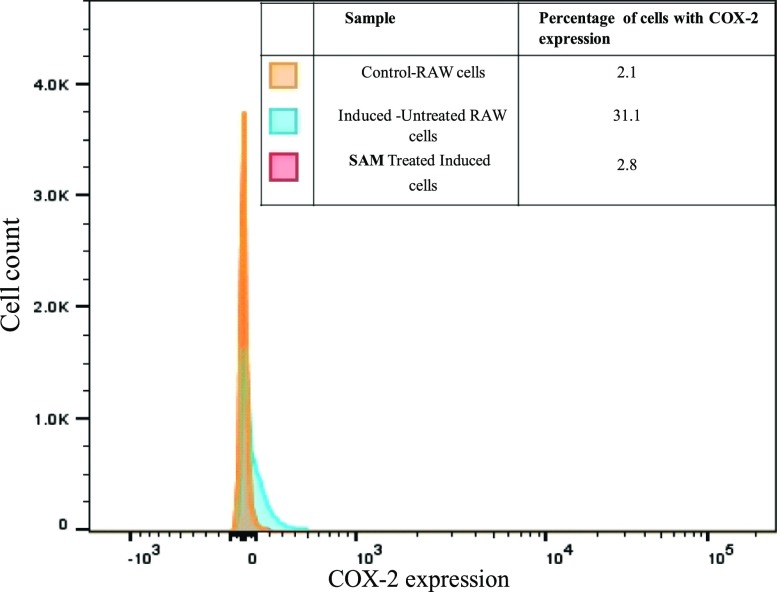
In vitro tests were designed using fluorescence-activated cell sorting (FACS) analysis to substantiate the interaction of SAM with COX-2 using LPS-stimulated RAW 264.7 cell lines, and interestingly, it was found that SAM exhibited pronounced anti-inflammatory activity. It was found already that SAM was noncytotoxic when tested with various concentrations (5–100 μg/mL) on RAW 264.7 cell lines. Hence, the nontoxic concentration (100 μg/mL) of SAM was further used to study the anti-inflammatory effect in LPS-induced RAW 264.7 cell lines that were stained using a COX-2-specific primary antibody with Alexa Fluor 488-labeled goat antimouse IgG (H + L) fluorescent secondary antibody to measure COX-2 expression by FACS analysis. The results showed upregulation of COX-2 expression (31.1%) in the RAW 264.7 cell lines which are challenged with LPS, whereas a remarkable decrease in the COX-2 expression was evidenced when the cells were treated with SAM (2.8%), which is almost equal to control RAW cell lines uninduced with LPS (2.1%) (Figure 2). Thus, the treatment with SAM clearly witnessed decreased COX-2 expression by in vitro model RAW 264.7 macrophage cells. Prostaglandin E2 (PGE2) is produced by COX-2 at the inflammatory site, which is an important mediator of inflammation. PGE2 production and induction of COX-2 activity are related to NO production.23 Thus, SAM could be a persuasive compound in preventing COX-2 expression for prospecting as a therapeutic in treating the diseases caused by inflammatory response like Alzheimer’s disease, cancer, and arthritis.
Figure 2.
Expression of COX-2 in RAW 264.7 cell lines induced with LPS by using FACS.
2.6. Characterization of N-GQDs by UV–Visible, Fluorescence, and Transmission Electron Microscopy Techniques
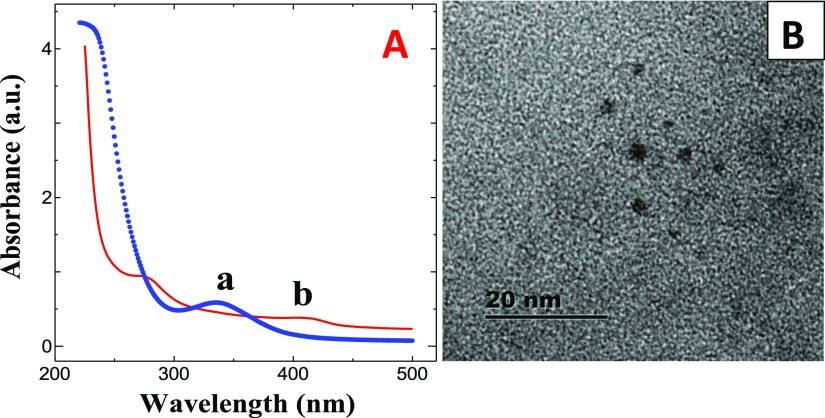
The synthesis of N-GQDs using citric acid and l-asparagine by pyrolysis is schematically shown in Scheme 1. The UV–vis spectra of N-GQDs and SAM are shown in Figure 3A. N-GQDs show the absorption maximum at 335 nm, corresponding to n−π* transition because of the presence of surface functional groups such as hydroxyl, amino, and carboxylate (Figure 3A). On the other hand, SAM showed the absorption peaks at 270 and 403 nm, corresponding to π–π* and n−π* transitions, respectively. Figure 3B shows the transmission electron microscopy (TEM) image of N-GQDs. It shows that the N-GQDs were spherical, and the size was found to be ∼3 nm. The N-GQDs showed blue luminescence under UV light. While varying the excitation wavelength, only the emission intensity varies but the emission maximum remains constant. This observation revealed that the size and surface states of as-synthesized N-GQDs were uniform and showed the maximum emission intensity at 440 nm when exciting at 355 nm.
Scheme 1. Scheme Showing the Synthesis of N-GQDs by the Pyrolysis Method.
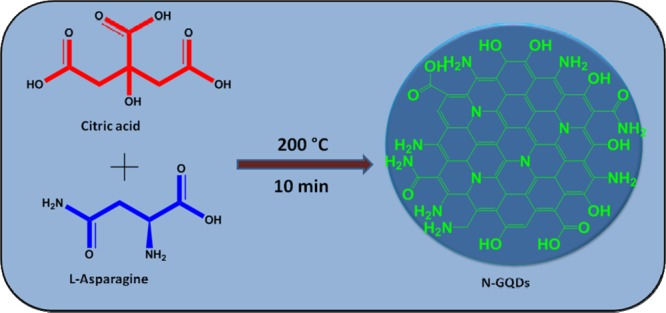
Figure 3.
(A) UV–visible absorption spectra of (a) N-GQDs and (b) SAM. (B) TEM image of N-GQDs.
The FT-IR spectrum of SAM (Figure 4a) showed a peak at 3360 cm–1 corresponding to N–H stretching vibration. The −C–H asymmetric and symmetric stretching vibrations appeared at 2980 and 2894 cm–1, respectively. The corresponding bending vibration peak appeared at 874 cm–1. The peak due to carbonyl stretching appeared at 1657 cm–1. The C–N stretching peak of SAM appeared at 1491 cm–1. The peak at 1401 cm–1 was due to C–O stretching. The corresponding CH2 rocking vibration peak appeared at 1259 cm–1. The −C–O–C– stretching vibration peak appeared at 1040 cm–1. The FT-IR spectrum of N-GQDs (Figure 4b) revealed that the broad band at 3436 cm–1 corresponds to −O–H and −N–H stretching vibrations. The peak at 2931 cm–1 was ascribed to the C–H stretching of N-GQDs. The peak at 1635 cm–1 indicates the presence of −C=O stretching. The peak corresponding to −C–N stretching appeared at 1497 cm–1. The −C–O bending and −C–O–C– stretching vibrations appeared at 1414 and 1080 cm–1, respectively. These results indicated that the formed GQDs had hydroxyl, amine, and carbonyl functional groups in the surface of N-GQDs. The FT-IR spectrum recorded for a mixture of SAM and N-GQDs is shown in Figure 4c. The different stretching peaks corresponding to N-GQDs and SAM appeared with a slight shift. In contrast to N-GQDs, the broad peak corresponding to −O–H and −N–H stretching vibration was shifted to 3420 cm–1. The peaks due to −C=O stretching and −C–O–C– stretching vibrations were shifted to 1638, 1406, and 1010 cm–1, respectively. The obtained shift in the different stretching frequencies is mainly due to the possible hydrogen bonding interaction between amine, carbonyl, and hydroxyl groups of N-GQDs and SAM.
Figure 4.
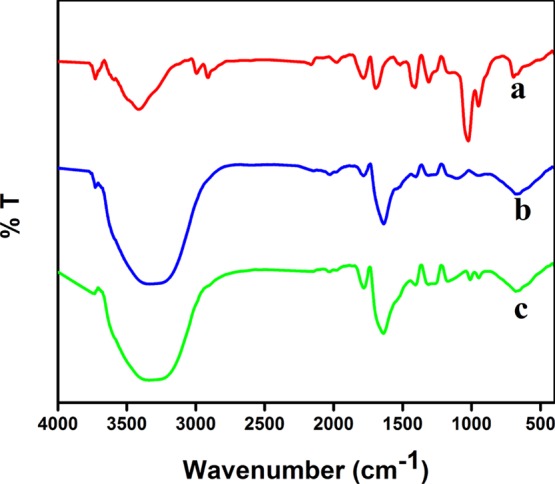
FT-IR spectra of (a) SAM, (b) N-GQDs, and (c) SAM combined with N-GQDs.
2.7. Anti-Inflammatory Effect of SAM Combined with N-GQDs in Macrophage RAW 264.7 Cell Lines
2.7.1. Studies of N-GQD Fluorescence Inside RAW 264.7 Cell Lines by Live Cell Imaging
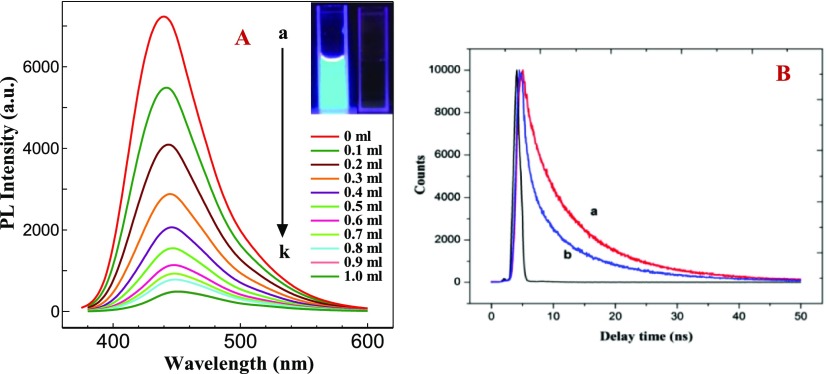
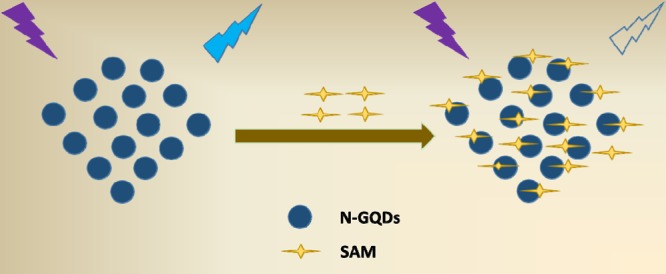
The emission spectra of N-GQDs with various concentrations of SAM are shown in Figure 5A. N-GQDs showed the emission maximum at 440 nm at an excitation of 355 nm. With the addition of various concentrations of SAM (each 0.1 mL addition), a systematic decrease in the emission intensity of N-GQDs was observed. After the addition of 1 mL of SAM, the emission intensity of N-GQDs was completely quenched (Figure 5A). The N-GQDs contain amide, amine, carboxyl, and hydroxyl as surface functional groups. These surface functional groups would have interacted with the surface functional groups of SAM (amine, hydroxyl, and carboxyl) through hydrogen bonding, which results in the nonradiative emission process through energy transfer. The fluorescence quenching of N-GQDs after the addition of SAM was explained by fluorescence resonance energy transfer (FRET) mechanism. The mechanism of FRET involves a donor fluorophore in an excited electronic state, which may transfer its excitation energy to a nearby acceptor chromophore in a nonradiative fashion through long-range dipole–dipole interactions. The fluorescence emission spectrum of the donor molecule must overlap the absorption or excitation spectrum of the acceptor chromophore. This is an important criterion for FRET to occur.24 As shown in Figure S6, the absorption spectrum of SAM overlaps with the emission spectrum of N-GQDs. This indicates that the FRET process exists in the fluorescence quenching phenomena. Further, this was confirmed by performing time-resolved fluorescence lifetime measurements of N-GQDs in the absence and presence of SAM. It is evident from Figure 5B that the lifetime (τ) of N-GQDs (τ1 = 9.747 ns) shows a significant change (τ2 = 9.041 ns) after the addition of 1 mg/mL SAM. This result further confirmed that the FRET process is involved in the fluorescence quenching of N-GQDs.
Figure 5.
(A) Emission spectra of an aqueous solution of N-GQDs (1 mg/mL) with various concentrations of SAM: (a) 1 mg/mL N-GQDs and (b–l) N-GQDs + 0.1–1 mL SAM. Inset: Photographs of (i) N-GQDs and (ii) N-GQDs + SAM. (B) Fluorescence decay curves for N-GQDs in the (a) absence and (b) presence of SAM.
The binding constant (KA) value can be calculated by using the double logarithm equation.25
where, F0 is the fluorescence intensity of N-GQDs alone and F is the fluorescence intensity of N-GQDs with SAM, KA is the binding constant and n is the number of binding sites, and [Q] represents the concentration of SAM. The values for KA and n can be derived from the intercept and slope, respectively. From Figure S8, KA and n values were calculated as KA = 8.841 × 10⁴ M–1 and 0.5926, respectively, suggesting the presence of a strong interaction between N-GQDs and SAM. The schematic representation showing the fluorescence quenching of N-GQDs in the presence of SAM is shown in Scheme 2.
Scheme 2. Schematic Representation for the Fluorescence Quenching of N-GQDs by SAM.
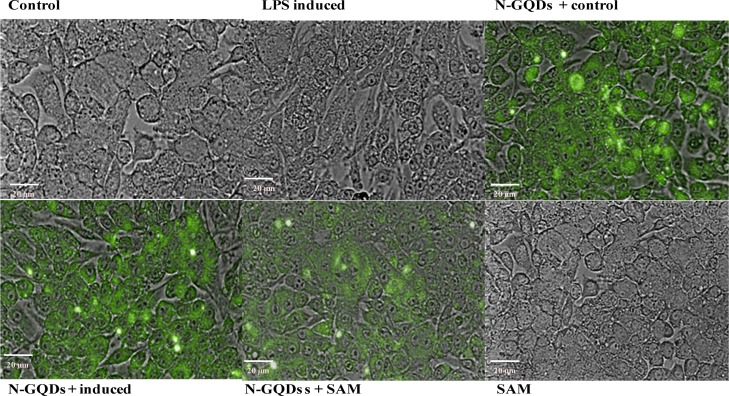
Live cell imaging was performed to analyze the fluorescence intensity of SAM and N-GQDs by high content screening (HCS). Similarly, SAM alone treated cell lines did not show fluorescence, which demonstrated the quenching property of SAM to N-GQDs. These results evidenced that the compound was delivered effectively into the RAW 264.7 cell line; it might be because of the interaction between the functional groups of SAM and N-GQDs (Figure 6). Further, changes in the morphology of RAW 264.7 cell lines were also noticed (Figure 6). The LPS-induced untreated cells were irregular in shape with pseudopodia, whereas N-GQDs + SAM and SAM alone LPS-induced treated cells showed a round shape morphology because of the suppression in the formation of pseudopodia by inhibiting the cell differentiation.26 Hence, the results are evidencing that SAM may act as a prominent drug for the treatment of the inflammatory diseases and that it can be delivered very effectively with the N-GQDs for better availability of SAM into the cells.
Figure 6.
HCS of the RAW 264.7 cell lines under different conditions. (Control = control group; LPS-induced = LPS-induced group; N-GQDs + control = control along with N-GQDs; N-GQDs + induced = LPS-induced treated with N-GQDs; N-GQDs + SAM = LPS-induced treated with SAM + N-GQDs and SAM = LPS-induced treated with SAM alone).
2.8. Anti-Inflammatory Activity of SAM along with N-GQDs in RAW 264.7 Cell Lines
2.8.1. Measurement of Intracellular Reactive Oxygen Species
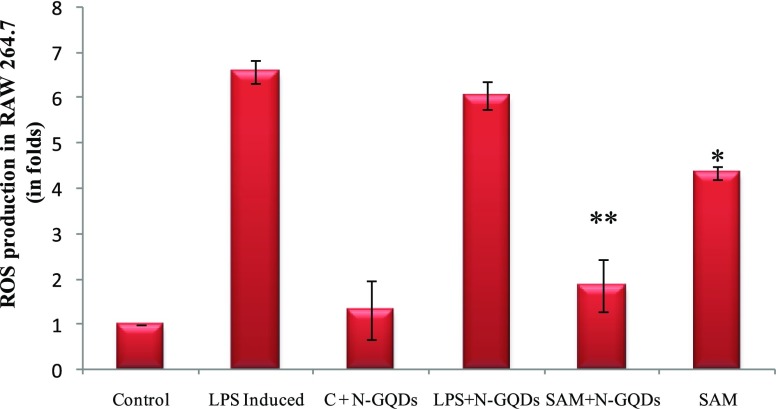
Reactive oxygen species (ROS) are very important inflammatory mediators. During inflammation, ROS can cause potential number of deleterious events like DNA damage and mutation.27,28 ROS are involved in various gene expressions related to inflammation by redox-based activation of NF-κß and the COX-2 signalling pathway. The effects of SAM and SAM + N-GQDs on ROS were determined by treating LPS-induced RAW 264.7 cell lines by 2,7-dichlorofluorescein diacetate (DCF-DA) (Figure 7). ROS generation in LPS-induced RAW 264.7 cells showed a significant increase (p < 0.01), whereas in SAM + N-GQDs treated cells, ROS generation had shown a more significant decrease in comparison to SAM alone (p < 0.05). Thus, the effective delivery of SAM + N-GQDs had resulted in the inhibition of ROS production.
Figure 7.
ROS assay of the SAM and SAM + N-GQDs in RAW 264.7 cell lines induced by LPS (*p < 0.05 & **p < 0.01). (Control = control group; LPS-induced = LPS-induced group; C + N-GQDs = Control along with N-GQDs; LPS + N-GQDs = LPS-induced treated with N-GQDs; SAM + N-GQDs = LPS-induced treated with SAM + N-GQDs and SAM = LPS-induced treated with SAM alone).
2.8.2. NO Inhibition Assay
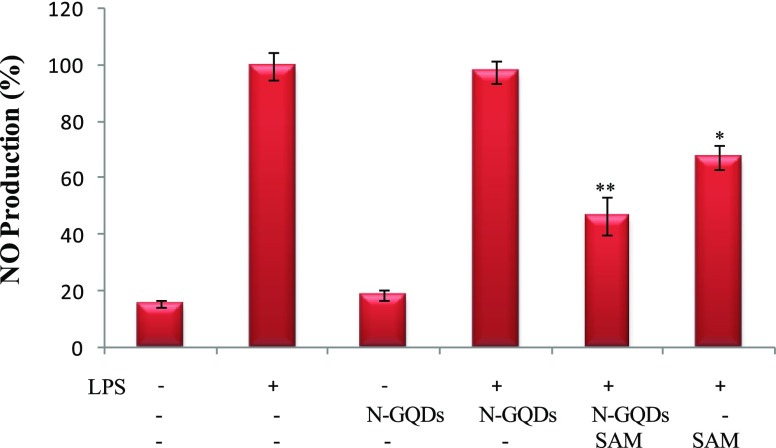
NO is a signalling molecule which is synthesized by NOS which is a proinflammatory enzyme. NO exerts inflammatory effects by stimulating COX-2 and iNOS.29 Excessive production of NO can cause inflammatory diseases by stimulating COX-2 or iNOS. The effect of SAM and SAM + N-GQDs on NO yield was tested in RAW 264.7 cell lines after LPS induction. NO yield significantly increased in LPS-induced RAW 264.7 cell lines, whereas the level of NO yield was most significantly decreased (p < 0.01) in LPS-induced treated with SAM + N-GQDs in comparison to SAM alone treated cells. SAM alone treated cells showed a significant decrease in the production of NO (Figure 8). These results clearly showed the better inhibition of NO by SAM + N-GQDs in comparison to phlorotannins extracted from edible brown algae Eisenia bicycles.30
Figure 8.
NO assay of SAM in RAW 264.7 macrophage cell lines by Griess reagent, (*p < 0.05 & **p < 0.01) (− denotes the absence of LPS and + denotes the presence of the LPS).
2.8.3. Effects of Combined SAM and N-GQDs Compound on LPS-Induced IL-1α, IL-1ß, IL-4, IL-6, COX-2, iNOS, TNF-α, and NF-κß mRNA Expressions in RAW 264.7 Cell Lines
Cytokines are small nonstructural proteins (8–40 kDa) which regulate host responses to infection and inflammation. These cytokines are involved in cell trafficking during inflammation in the immune organs. Immune response is developed by the secretion of cytokines by triggering cell-mediated, cytotoxic, or humoral immunity response. Nevertheless, many cytokines have both potentials, proinflammatory and anti-inflammatory. Major proinflammatory cytokines IL-1α and IL-1ß, which triggers identical biological response, and IL-6 and TNF-α promote the state of inflammation.31−33 IL-1 and TNF-α induce a variety of proinflammatory genes, such as phospholipase A2, COX-2, iNOS, NF-κß,34 and other cytokines and chemokines.31,35,36 IL-4 is the only proinflammatory cytokine that is induced at early stages of colonic injury in the gut of mice.37
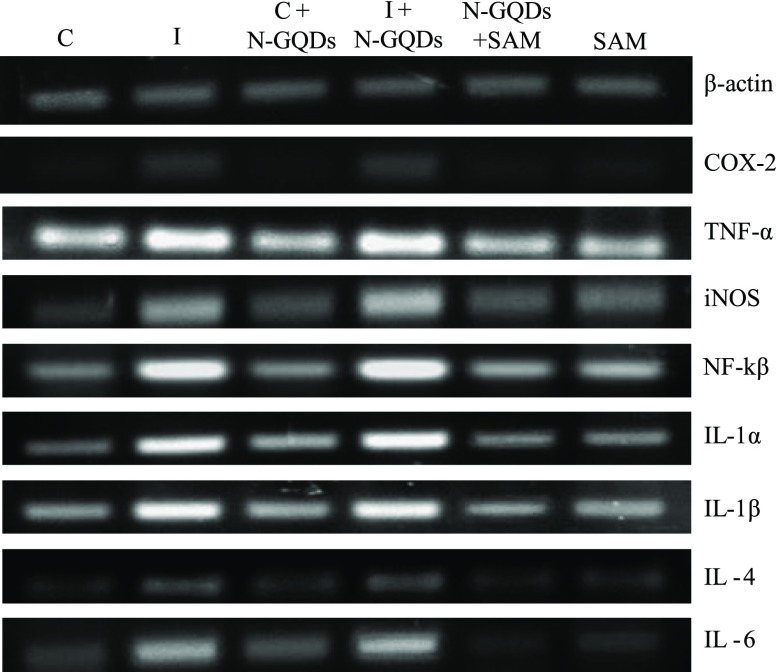
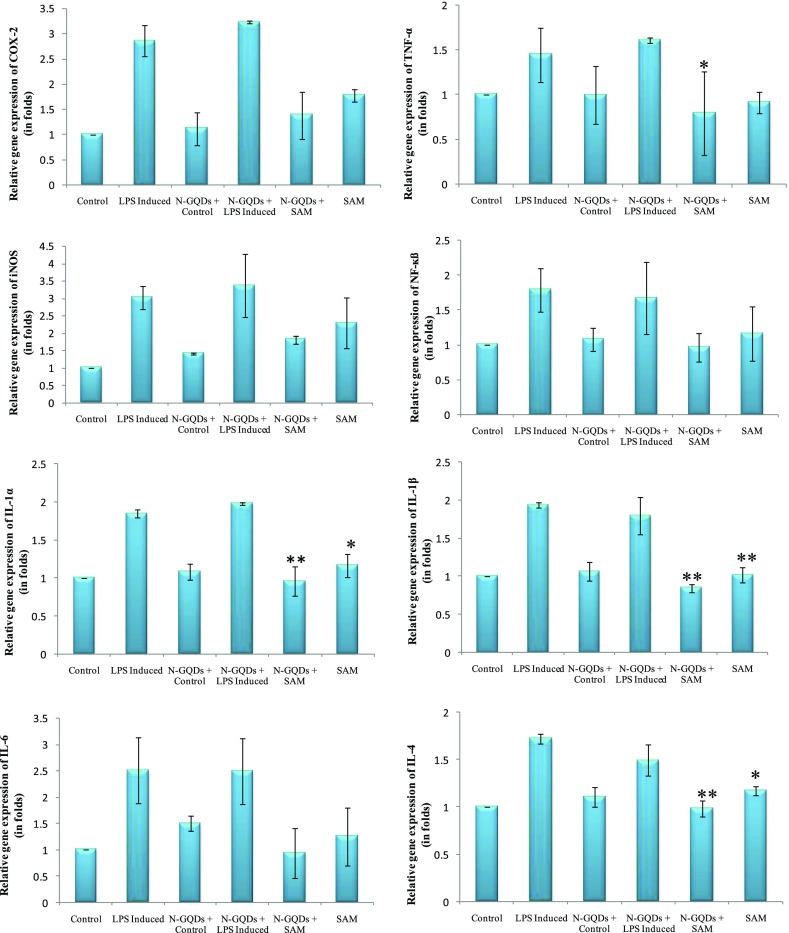
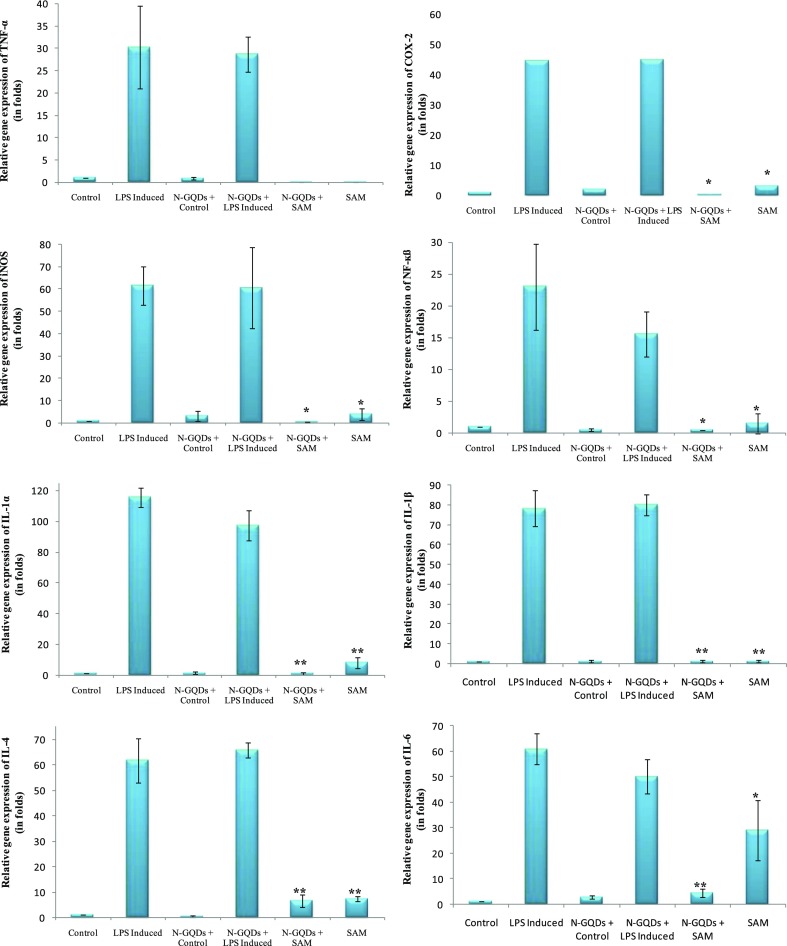
In the semiquantitative polymerase chain reaction (PCR) and real-time PCR (RT-PCR), RAW 264.7 cell lines were stimulated with LPS (1 μg/mL) and treated with SAM and combined with N-GQDs to analyze IL-1α, IL-1ß, IL-4, IL-6, COX-2, iNOS, TNF-α, and NF-κß gene expressions, and it was found that LPS-induced inflammation in RAW 264.7 cell lines causes upregulation of many modulators involved in the inflammatory cascade. In semiquantitative PCR, SAM was given as the treatment to LPS-induced RAW 264.7 cell lines and a significant downregulation of IL-1α, IL-1ß, and IL-4 (p < 0.05 and p < 0.01, respectively) was observed (Figure 9). A slight decrease was also seen in the expression of COX-2, TNF-α, NF-κß, and iNOS. However, the combination of SAM with N-GQDs had shown downregulation in all of the eight genes, whereas a significant downregulation was observed in the expression of COX-2, TNF-α, IL-1α, IL-4, and IL-1ß. It is noteworthy to mention that the combination of SAM and N-GQDs proved to be a more effective inhibition in the expression of IL-1α, IL-4, and IL-1ß (Figure 10). In RT-PCR, SAM showed that there was a significant downregulation in the expression of the inflammatory genes, whereas SAM + N-GQDs showed more a significant decrease in the expression of IL-1α, IL-1ß, IL-4, and IL-6 in comparison to COX-2, TNF-α, NF-κß, and iNOS genes (Figure 11).
Figure 9.
Gene expression study of the inflammatory genes (COX-2, TNF-α, iNOS, NF-κß, IL-1α, IL-1ß, IL-4, and IL-6) was carried out by using semiquantitative PCR. (Control = control group; LPS-induced = LPS-induced group; C + N-GQDs = control along with N-GQDs; LPS + N-GQDs = LPS-induced treated with N-GQDs; SAM + N-GQDs = LPS-induced treated with SAM + N-GQDs and SAM = LPS induced treated with SAM alone).
Figure 10.
Relative gene expression of COX-2, TNF-α, iNOS, NF-κβ, IL-1α, IL-1β, IL-4, and IL-6 genes in RAW 264.7 cell lines in different conditions [control (C), LPS-induced (I), normal + N-GQDs (N-GQDs + C), LPS-induced + N-GQDs (N-GQDs + LPS induced), LPS-induced + N-GQDs + SAM (N-GQDs + SAM), and LPS-induced treated with SAM (SAM)] by RT-PCR analysis (*p < 0.05; **p < 0.01).
Figure 11.
Relative gene expression of COX-2, TNF-α, iNOS, NF-κF, IL-1α, IL-1β, IL-4, and IL-6 genes in RAW 264.7 cell lines in different conditions [control (C), LPS induced (I), normal + N-GQDs (N-GQDs + C), LPS-induced + N-GQDs (N-GQDs + I), LPS-induced + N-GQDs + SAM (N-GQDs + SAM), and LPS-induced treated with SAM (SAM)] by RT-PCR analysis (*p < 0.05; **p < 0.01).
3. Conclusions
Conclusively, this study evidences the presence of SAM in Lyngbya sp., which has effective biological potential against inflammation; it has been explored for the first time. The bioactive metabolite SAM combined with N-GQDs exhibited the effective downregulation of COX-2, TNF-α, IL-1α, IL-1ß, and IL-4 expression in LPS-challenged RAW 264.7 macrophage cell lines. Thus, it is apparent that SAM could serve as a promising natural therapeutic molecule for alleviating the complications of inflammatory diseases. N-GQDs proved as a good drug delivery molecule for enhancing the availability of the bioactive compound SAM into the cells.
4. Methods
4.1. Algal Sample Collection and Identification
The cyanobacteria samples were collected from Gulf of Mannar, Rameshwaram, Tamil Nadu, India. The samples were identified based on morphological characteristics as described earlier by Rippka et al. (1979).20 The dimension of the cyanobacterial isolate was measured using a compound light microscope (Eppendorf, Germany) with a 40× nonimmersion objective and ocular lens (10×) with a calibrated optical micrometer. The samples were washed with sea water and air-dried at room temperature 27 °C followed by drying at 45 °C in a hot air oven for 60 min and frozen with methanol until further extraction.
4.2. Extraction and Separation of the Compound from Lyngbya sp.
The freeze-dried cyanobacterial samples (100 g) were lyzed by liquid nitrogen and then kept in methanol/chloroform (ratio 1:2) at room temp (27 ± 1 °C) overnight and extracted using a Whatman filter paper. Further, the extract was separated using silica gel (mesh size 230–400) by column chromatography using 100% hexane–ethanol–methanol gradient.
4.3. Structural Elucidation of Compounds by Reversed Phase-HPLC, FT-IR, NMR, and ESI-MS Analysis
To check the purity of the compound, reversed phase-HPLC analytical method was carried out using a RP-HPLC (Shimadzu, Japan) system in a binary mode, coupled to a UV detector, where 20 μL the purified fraction was injected into a C-18 column. The mobile phase used for this experiment was HPLC grade methanol: water (0.2 v/v %) at a ratio of 80:20 delivered at a flow rate of 0.4 mL/min, and a detector was set at 250 nm. Further, FT-IR (Shimadzu, Japan) spectra were also analyzed to identify functional groups of the purified fractions. Further, NMR spectra were also recorded on a Bruker AVANCE DRX300 spectrometer (Bruker Daltonics, Germany). The spectra were referenced to a residual solvent signal with resonances at δH/C 7.26/77.1 (CDCl3). Low-resolution ESI-MS spectra were obtained on a Thermo Finnigan LCQ Advantage mass spectrometer (Thermo Finnigan, USA). The steady-state and time-resolved fluorescence measurements were carried out using an Edinburg, FLS980 spectrofluorimeter.
4.4. Biological Activities of the Compound SAM
4.4.1. NO Radical Scavenging Assay of the Ethanolic Compound
To check the in vitro anti-inflammatory activity, the NO scavenging potential of SAM was assayed according to Tsai et al. (1997).38 The quantities of nitrate or nitrite can be determined by using Griess reagent.39 Briefly, serially diluted 60 μL of SAM was mixed with sodium nitroprusside (10 mM) in phosphate-buffered saline (PBS) added into a 96-well plate and further incubated at 28 °C under illumination for 2 h. NO reacts with oxygen and produces nitrate or nitrite that can be quantified after the addition of Griess reagent at the absorption maximum of 540 nm. Ascorbic acid was used as the standard, and the NO scavenging effect of the compound was calculated by the given formula
where A0 and A1 are the absorbances of the control and sample reaction, respectively.
4.5. Studies of the Anti-Inflammatory Activity of SAM Using RAW 264.7 Cell Lines
4.5.1. Cell Culture and Cell Cytotoxicity Activity
The RAW 264.7 cell line was procured from National Centre for Cell Sciences (NCCS) Pune, India. The cells were cultured in Dulbecco’s modified Eagle’s medium (DMEM) supplemented with 10% fetal bovine serum (FBS) along with 1% antibiotics and incubated in a CO2 incubator at 37 °C. The RAW 264.7 cell lines were grown in DMEM medium containing 10% FBS, and 1 × 10⁴ cells/well were seeded into a 96-well plate and further incubated at 37 °C for 24 h. The cells were then treated with different concentrations (10–100 μL of SAM). After incubation (24 h), 10 μL of 3-(4,5-dimethylthiazol-2-yl)-2,5-diphenyltetrazolium bromide was added to the wells and mixed properly and incubated for 2 h. After 2 h of incubation, solubilizing buffer was added into the wells and the absorbance of the resultant color was measured at 570 nm using an ELISA reader (BioTek, US).
4.5.2. Assay for COX-2 Expression by FACS Analysis
The cells (1 × 10⁶ cells/well) were plated in a 6-well plate and cultured in DMEM supplemented with 10% FBS and 1% antibiotic in a 5% CO2 incubator at 37 °C to analyze the effect of SAM on the expression of COX-2 using RAW 264.7 cell lines. After preincubation for 1 h, with SAM, which was dissolved in dimethyl sulfoxide, LPS (1 μg/mL) was added and incubated for 12 h. Uninduced and untreated cells served as the control for the expression of COX-2. After the incubation, PBS was used to wash the cells, trypsinized, and fixed with 70% ethanol. All of the RAW 264.7 cell lines were washed using bovine serum albumin (BSA; 5 mg/mL) and were further pelleted. The primary antibody COX-2 (Santa Cruz F2513, USA) was provided in a dilution (1:2500) to the pellet and then kept for 30 min incubation in dark. The secondary antibody Alexa Fluor 488 goat anti mouse IgG (H + L) 1 in 5000 dilution (Invitrogen, Life technologies, USA) was given to the cells after washing with BSA/PBS solution and further incubated (30 min). After the incubation, the cells were again washed with BSA/PBS and then resuspended in PBS (400 μL) and were analyzed by flow cytometry (BD FACS Aria III, BD Biosciences, USA). The COX-2 expression in the treated cells in comparison with control cells was also analyzed using FlowJo software and expressed as percentage.
4.6. Synthesis of N-GQDs
The preparation of N-GQDs is as follows. Citric acid (0.75 g) and 0.25 g of l-asparagine were mixed and ground well using a mortar. The reaction mixture was taken in a 100 mL beaker and pyrolyzed on a heating mantle. Initially, the colorless solid melts to a pale yellow liquid. After 10 min, a dark yellow residue was formed, which suggests the formation of N-GQDs. The obtained product was then cooled to room temperature, and it was dissolved in 50 mL of NaOH solution (10 mg/mL) and stored in a standard measuring flask.
4.7. Procedure for Spectral and TEM Analysis
In a 170 mL flask, known amounts of N-GQDs and SAM were added. Each solution (2.5 mL) was transferred to the quartz cell and the absorbance was measured, and the same procedure was used for emission measurements. High-resolution (HR-TEM images of GQDs were obtained from a JEOL JEM 2100 Advanced Analytical HR-TEM instrument, operating at 200 kV. For the TEM measurement, the sample was prepared by dropping 2 μL of N-GQDs on the carbon-coated copper grid.
4.8. Anti-Inflammatory Study of SAM Combined with N-GQDs in Macrophage 264.7 Cell Lines
4.8.1. Live Cell Imaging of RAW 264.7 Cell Lines Treated with SAM and N-GQDs by HCS Analysis
RAW 264.7 cell lines (5 × 10³) were seeded into 96-cell carrier plates (PerkinElmer) with DMEM medium. The cells were induced with LPS and incubated for 2 h. Then, the cells were treated with SAM alone and SAM + N-GQDs compound and incubated for 12 h. The cells were washed with PBS twice and analyzed by HCS analysis. The fluorescence intensity of N-GQDs was specific to the emission range (270–700 nm).
4.8.2. Quantification of the Intracellular ROS Level
Intracellular reactive oxygen scavenging levels were quantified by the DCF-DA assay.40 The RAW 264.7 cell lines were seeded into a 96-well plate at 1 × 10⁴ cells/well. After 6 h of incubation, the cells were induced with LPS (1 mg/mL) and kept for 1 h incubation; then, the cells were treated with SAM and SAM + N-GQDs and kept for 24 h incubation. Then, the cells were washed with PBS and incubated with DCF-DA (25 μM) for 45 min in an incubator. The cells were washed with PBS once again and the fluorescence intensity was measured at Ex/Em = 485/540 nm (Biotek, US).
4.8.3. NO Inhibition Assay
The NO scavenging potential of RAW 264.7 cell lines was estimated by using Griess reagent38 (Sigma) that quantifies nitrite concentration in the medium. The RAW 264.7 cell lines were seeded into a 96-well plate and incubated for 6 h at 37 °C. Further, the cells were induced with LPS (1 mg/mL) and incubated for 1 h; further, the cells were treated with SAM and SAM + N-GQDs and incubated for 24 h. After incubation, 100 μL of Griess reagent (Sigma) was added into the wells and incubated for 10 min; and the absorbance was measured at the wavelength of 540 nm and normalized against DMEM culture medium used as blank (Biotek, US).
4.8.4. Semiquantitative PCR and RT-PCR Analysis
The expressions of cytokines IL-1α, IL-1ß, IL-4, IL-6, COX-2, iNOS, TNF-α, and NF-κß genes (Table S2) were studied in LPS-induced RAW 264.7 cell lines which were treated with SAM and N-GQDs. The RAW 264.7 cell lines were seeded into six different groups: Control cells (untreated and uninduced), LPS-induced cells, control cells provided with N-GQDs, LPS-induced and N-GQDs, LPS-induced N-GQDs and SAM treated cells, and LPS-induced SAM alone treated cells. The cells were incubated for 12 h, and the total RNA was isolated from the cells by TRIzol method according to the manufacture protocol. The extracted RNA was DNase-treated and quantified by a biophotometer (Eppendorf, Germany); RNA (3 μg) was used for cDNA synthesis using oligo dT primers. The mRNA expressions of IL-1α, IL-1ß, IL-4, IL-6, COX-2, iNOS, TNF-α, and NF-κß were measured using semiquantitative PCR. The PCR reaction was carried out in a mastercycler (Eppendrof, Germany) at the exponential phase of 32 PCR cycles at 95 °C for 30 s (denaturation), 55 °C for 30 s (annealing), and 72 °C for 45 s (extension). The amplified products were electrophoresed in 2% agarose gel by electrophoresis. Further, the expression levels of band intensities of the genes were analyzed by the densitometry software ImageJ. The mRNA expressions of the genes were measured using RT-PCR also. The RT-PCR was carried out in a thermo cycler (ABI PRISM 7000 Sequence Detection System, Thermo Fiesher) at 50 °C for 2 min, 95 °C for 3 min, 95 °C for 15 s, 60 °C for 1 min, and 60–95 °C for 20 min for 20 cycles. The data were analyzed by using the following equation 2–ΔΔCT, where ΔΔCT = (CT,target – CT,actin)time x – (CT,target – CT,actin)time 0.41
Acknowledgments
The authors thank the SERB, Department of Science and Technology, New Delhi (ref. no SB/EMEQ-128/2013) and DBT, Department of Biotechnology, New Delhi (ref. no: BT/PR15677/AAQ/3/799/2016) for the financial support, DST-PURSE program of MKU for the instrumentation facility and School of Chemistry for providing NMR & ESI MS; UGC-SAP and UGC-UPE Programme for FACS analysis. D.J.N. and S.A.J. thank the SERB, Department of Science and Technology, New Delhi (no. EMR/2016/002898, dated 25-01-2017) for the financial support.
Supporting Information Available
The Supporting Information is available free of charge on the ACS Publications website at DOI: 10.1021/acsomega.8b02085.
HPLC and FT-IR analysis of the compound; 1H NMR and 13C NMR of purified SAM; 2D-NMR analysis of SAM; ESI-MS analysis of SAM; structural analysis of SAM; absorption spectra and emission spectrum; cell survival assay of SAM on RAW 264.7 macrophage; binding constant plot for fluorescence quenching of N-GQDs in the presence of SAM; structural validation of SAM by NMR analysis; and list of primers used for RT-PCR analysis (PDF)
Author Contributions
P.V. and S.A.J. designed the experiment; R.S.K., D.J.N., and. G.S. conducted the experiments; P.V., S.A.J., and B.A. analyzed the data; and R.S.K., J.N., and P.V. wrote the manuscript. All of the authors revised the manuscript.
The authors declare no competing financial interest.
Supplementary Material
References
- Heo S.-J.; Yoon W.-J.; Kim K.-N.; Ahn G.-N.; Kang S.-M.; Kang D.-H.; Affan A.; Oh C.; Jung W.-K.; Jeon Y.-J. Evaluation of anti-inflammatory effect of fucoxanthin isolated from brown algae in lipopolysaccharide-stimulated RAW 264.7 macrophages. Food Chem. Toxicol. 2010, 48, 2045–2051. 10.1016/j.fct.2010.05.003. [DOI] [PubMed] [Google Scholar]
- Kim S. Y.; Jeong H. J.; Kim D. W.; Kim M. J.; An J. J.; Sohn E. J.; Kang H. W.; Shin M. J.; Ahn E. H.; Kwon S. W.; Kim D.-S.; Cho S.-W.; Park J.; Eum W. S.; Choi S. Y. Transduced PEP-1-FK506BP inhibits the inflammatory response in the Raw 264.7 cell and mouse models. Immunobiology 2011, 216, 771–781. 10.1016/j.imbio.2010.12.008. [DOI] [PubMed] [Google Scholar]
- Zidar N.; Odar K.; Glavac D.; Jerse M.; Zupanc T.; Stajer D. Cyclooxygenase in normal human tissues - is COX-1 really a constitutive isoform, and COX-2 an inducible isoform?. J. Cell. Mol. Med. 2009, 13, 3753–3763. 10.1111/j.1582-4934.2008.00430.x. [DOI] [PMC free article] [PubMed] [Google Scholar]
- Orlando B. J.; Lucido M. J.; Malkowski M. G. The Structure of Ibuprofen Bound to Cyclooxygenase-2. J. Struct. Biol. 2015, 189, 62–66. 10.1016/j.jsb.2014.11.005. [DOI] [PMC free article] [PubMed] [Google Scholar]
- Michaux C.; Charlier C. Structural Approach for COX-2 Inhibition. Mini-Rev. Med. Chem. 2004, 4, 603–615. 10.2174/1389557043403756. [DOI] [PubMed] [Google Scholar]
- Iwamoto C.; Yamada T.; Ito Y.; Minoura K.; Numata A. Cytotoxic Cytochalasans from a Penicillium Species Separated from a Marine Alga. Tetrahedron 2001, 57, 2997–3004. 10.1016/s0040-4020(01)00153-3. [DOI] [Google Scholar]
- Dennison W. C.; O’Neil J. M.; Duffy E.; Oliver P.; Shaw G.. Blooms of the Cyanobacterium Lyngbya Majuscula in Coastal Waters of Queensland. In Proceeding of the International Symposium on Marine Cyanobacteria, November 1997; Charpy L.; Larkum A. W. D., Eds.; Institut Oceanographique: Paris, 1999.
- Berry J. P.; Gantar M.; Gawley R. E.; Rein K. S.. Isolation of Bioactive Metabolites from a Lyngbya Species Isolated from Periphyton of the Florida Everglades. In Harmful Algae (2002); Steidinger K. A.; Landsberg J. H.; Tomas C. R.; Varg G. A., Eds.; Florida Fish and Wildlife Conservation Commission, Florida Institute of Oceanography, and Intergovernmental Oceanographic Commission of UNESCO: St. Petersburg, FL: 2004; pp 192-194.
- Marner F.-J.; Moore R. E.; Hirotsu K.; Clardy J. Majusculamides A and B, Two Epimeric Lipodipeptides from Lyngbya Majuscula Gomont. J. Org. Chem. 1977, 42, 2815–2819. 10.1021/jo00437a005. [DOI] [Google Scholar]
- Moore R. E. Cyclic Peptides and Depsipeptides from Cyanobacteria: A Review. J. Ind. Microbiol. 1996, 16, 134–143. 10.1007/bf01570074. [DOI] [PubMed] [Google Scholar]
- Sharp K.; Arthur K. E.; Gu L.; Ross C.; Harrison G.; Gunasekera S. P.; Meickle T.; Matthew S.; Luesch H.; Thacker R. W.; Sherman D. H.; Paul V. J. Phylogenetic and Chemical Diversity of Three Chemotypes of Bloom-Forming Lyngbya Species (Cyanobacteria: Oscillatoriales) from Reefs of Southeastern Florida. Appl. Environ. Microbiol. 2009, 75, 2879–2888. 10.1128/aem.02656-08. [DOI] [PMC free article] [PubMed] [Google Scholar]
- Dong Y.; Shao J.; Chen C.; Li H.; Wang R.; Chi Y.; Lin X.; Chen G. Blue luminescent graphene quantum dots and graphene oxide prepared by tuning the carbonization degree of citric acid. Carbon 2012, 50, 4738–4743. 10.1016/j.carbon.2012.06.002. [DOI] [Google Scholar]
- Deng W.; Goldys E. M. Chemical sensing with nanoparticles as optical reporters: from noble metal nanoparticles to quantum dots and upconverting nanoparticles. Analyst 2014, 139, 5321–5334. 10.1039/c4an01272k. [DOI] [PubMed] [Google Scholar]
- Ying Y.; He P.; Ding G.; Peng X. Ultrafast Adsorption and Selective Desorption of Aqueous Aromatic Dyes by Graphene Sheets Modified by Graphene Quantum Dots. Nanotechnology 2016, 27, 245703. 10.1088/0957-4484/27/24/245703. [DOI] [PubMed] [Google Scholar]
- Yan X.; Cui X.; Li L.-s. Synthesis of Large, Stable Colloidal Graphene Quantum Dots with Tunable Size. J. Am. Chem. Soc. 2010, 132, 5944–5945. 10.1021/ja1009376. [DOI] [PubMed] [Google Scholar]
- Wang S.; Cole I. S.; Li Q. The Toxicity of Graphene Quantum Dots. RSC Adv. 2016, 6, 89867–89878. 10.1039/c6ra16516h. [DOI] [Google Scholar]
- Wang T.; Zhu S.; Jiang X. Toxicity mechanism of graphene oxide and nitrogen-doped graphene quantum dots in RBCs revealed by surface-enhanced infrared absorption spectroscopy. Toxicol. Res. 2015, 4, 885–894. 10.1039/c4tx00138a. [DOI] [Google Scholar]
- Zhu S.; Zhang J.; Qiao C.; Tang S.; Li Y.; Yuan W.; Li B.; Tian L.; Liu F.; Hu R.; Gao H.; Wei H.; Zhang H.; Sun H.; Yang B. Strongly Green-Photoluminescent Graphene Quantum Dots for Bioimaging Applications. Chem. Commun. 2011, 47, 6858–6860. 10.1039/c1cc11122a. [DOI] [PubMed] [Google Scholar]
- Baker S. N.; Baker G. A. Luminescent Carbon Nanodots: Emergent Nanolights. Angew. Chem., Int. Ed. 2010, 49, 6726–6744. 10.1002/anie.200906623. [DOI] [PubMed] [Google Scholar]
- Rippka R.; Stanier R. Y.; Deruelles J.; Herdman M.; Waterbury J. B. Generic Assignments, Strain Histories and Properties of Pure Cultures of Cyanobacteria. J. Gen. Microbiol. 1979, 111, 1–61. 10.1099/00221287-111-1-1. [DOI] [Google Scholar]
- Gross H.; McPhail K. L.; Goeger D. E.; Valeriote F. A.; Gerwick W. H. Two Cytotoxic Stereoisomers of Malyngamide C, 8-Epi- Malyngamide C and 8-O-Acetyl-8-Epi-Malyngamide C, from the Marine Cyanobacterium Lyngbya Majuscule. Phytochemistry 2010, 71, 1729–1735. 10.1016/j.phytochem.2010.07.001. [DOI] [PMC free article] [PubMed] [Google Scholar]
- Coleman J. W. Nitric Oxide in Immunity and Inflammation. Int. Immunopharmacol. 2001, 1, 1397–1406. 10.1016/s1567-5769(01)00086-8. [DOI] [PubMed] [Google Scholar]
- Evert B. A.; Salmon T. B.; Song B.; Jingjing L.; Siede W.; Doetsch P. W. Spontaneous DNA Damage inSaccharomyces cerevisiaeElicits Phenotypic Properties Similar to Cancer Cells. J. Biol. Chem. 2004, 279, 22585–22594. 10.1074/jbc.m400468200. [DOI] [PubMed] [Google Scholar]
- Salmon T. B.; Evert B. A.; Song B.; Doetsch P. W. Biological Consequences of Oxidative Stress-Induced DNA Damage in Saccharomyces Cerevisiae. Nucleic Acids Res. 2004, 32, 3712–3723. 10.1093/nar/gkh696. [DOI] [PMC free article] [PubMed] [Google Scholar]
- MacMicking J.; Xie Q.-w.; Nathan C. Nitric Oxide and Macrophage Function. Annu. Rev. Immunol. 1997, 15, 323–350. 10.1146/annurev.immunol.15.1.323. [DOI] [PubMed] [Google Scholar]
- Jung H. A.; Jin S. E.; Ahn B. R.; Lee C. M.; Choi J. S. Anti-inflammatory activity of edible brown alga Eisenia bicyclis and its constituents fucosterol and phlorotannins in LPS-stimulated RAW264.7 macrophages. Food Chem. Toxicol. 2013, 59, 199–206. 10.1016/j.fct.2013.05.061. [DOI] [PubMed] [Google Scholar]
- Chang Y.-C.; Li P.-C.; Chen B.-C.; Chang M.-S.; Wang J.-L.; Chiu W.-T.; Lin C.-H. Lipoteichoic acid-induced nitric oxide synthase expression in RAW 264.7 macrophages is mediated by cyclooxygenase-2, prostaglandin E2, protein kinase A, p38 MAPK, and nuclear factor-κB pathways. Cell. Signalling 2006, 18, 1235–1243. 10.1016/j.cellsig.2005.10.005. [DOI] [PubMed] [Google Scholar]
- Lakowicz J. R.Principles of Fluorescence Spectroscopy, 2nd ed.; Kluwer: New York. 1999. [Google Scholar]
- Gao J.; Guo Y.; Wang J.; Wang Z.; Jin X.; Cheng C.; Li Y.; Li K. Spectroscopic analyses on interaction of o-Vanillin-d-Phenylalanine, o-Vanillin-l-Tyrosine and o-Vanillin-l-Levodopa Schiff Bases with bovine serum albumin (BSA). Spectrochim. Acta, Part A 2011, 78, 1278–1286. 10.1016/j.saa.2010.12.077. [DOI] [PubMed] [Google Scholar]
- Kang S.-R.; Han D.-Y.; Park K.-I.; Park H.-S.; Cho Y.-B.; Lee H.-J.; Lee W.-S.; Ryu C. H.; Ha Y. L.; Lee D. H.; Kim J. A.; Kim G.-S. Suppressive Effect on Lipopolysaccharide-Induced Proinflammatory Mediators byCitrus aurantium L.in Macrophage RAW 264.7 Cells via NF-κB Signal Pathway. J. Evidence-Based Complementary Altern. Med. 2011, 2011, 1–12. 10.1155/2011/248592. [DOI] [PMC free article] [PubMed] [Google Scholar]
- Dinarello C. A. Proinflammatory Cytokines. Chest 2000, 118, 503–508. 10.1378/chest.118.2.503. [DOI] [PubMed] [Google Scholar]
- Borish L. C.; Steinke J. W. Cytokines and chemokines. J. Allergy Clin. Immunol. 2003, 111, S460–S475. 10.1067/mai.2003.108. [DOI] [PubMed] [Google Scholar]
- teinke J. W.; Borish L. Cytokines and chemokines. J. Allergy Clin. Immunol. 2006, 117, S441–S445. 10.1016/j.jaci.2005.07.001. [DOI] [PubMed] [Google Scholar]
- Lawrence T. The Nuclear Factor NF-kB Pathway in Inflammation. Cold Spring Harbor Perspect. Biol. 2009, 1, a001651. 10.1101/cshperspect.a001651. [DOI] [PMC free article] [PubMed] [Google Scholar]
- Voronov E.; Carmi Y.; Apte R. N. The role IL-1 in Tumor-Mediated Angiogenesis. Front. Physiol. 2014, 114, 114. 10.3389/fphys.2014.00114. [DOI] [PMC free article] [PubMed] [Google Scholar]
- Dinarello C. A. The IL-1 Family and Inflammatory Diseases. Clin. Exp. Rheumatol. 2002, 20, S1–S13. [PubMed] [Google Scholar]
- Van Kampen C.; Gauldie J.; Collins S. M. Proinflammatory Properties of IL-4 in the Intestinal Microenvironment. Am. J. Physiol. Gastrointest. Liver Physiol. 2005, 288, G111–G117. 10.1152/ajpgi.00014.2004. [DOI] [PubMed] [Google Scholar]
- Tsai P.-J.; Tsai T.-H.; Yu C.-H.; Ho S.-C. Comparison of NO-Scavenging and NO-Suppressing Activities of Different Herbal Teas with those of Green Tea. Food Chem. 2007, 103, 181–187. 10.1016/j.foodchem.2006.08.013. [DOI] [Google Scholar]
- Marcocci L.; Maguire J. J.; Droylefaix M. T.; Packer L. The Nitric Oxide-Scavenging Properties of Ginkgo Biloba Extract EGb 761. Biochem. Biophys. Res. Commun. 1994, 201, 748–755. 10.1006/bbrc.1994.1764. [DOI] [PubMed] [Google Scholar]
- Leloup C.; Magnan C.; Benani A.; Bonnet E.; Alquier T.; Offer G.; Carriere A.; Periquet A.; Fernandez Y.; Fernandez A.; Casteilla L.; Penicaud L. Mitochondrial Reactive Oxygen Species are Required for Hypothalamic Glucose Sensing. Diabetes 2006, 55, 2084–2090. 10.2337/db06-0086. [DOI] [PubMed] [Google Scholar]
- Livak K. J.; Schmittgen T. D. Analysis of Relative Gene Expression Data Using Real-Time Quantitative PCR and the 2−ΔΔCT Method. Methods 2001, 25, 402–408. 10.1006/meth.2001.1262. [DOI] [PubMed] [Google Scholar]
Associated Data
This section collects any data citations, data availability statements, or supplementary materials included in this article.


