

Abstract
Background:
Smoking prevalence is declining at a slower rate in rural than urban settings in the United States (U.S.), and known predictors of smoking do not readily account for this trend difference. Given that socioeconomic and psychosocial determinants of health disparities accumulate in rural settings and that life-course disadvantages are often greater in women than men, we examined whether smoking trends are different for rural and urban men and women.
Method:
We used yearly cross-sectional data (n = 303,311) from the U.S. National Survey on Drug Use and Health (NSDUH) from 2007 through 2014 to compare cigarette smoking trends in men and women across rural and urban areas. Current smoking status was modelled using logistic regression controlling for confounding risk factors.
Results:
Regression derived graphs predicting unadjusted prevalence estimates and 95% confidence bands revealed that whereas the smoking trends of rural men, urban men, and urban women significantly declined from 2007 to 2014, the trend for rural women was flat. Controlling for demographic, socioeconomic and psychosocial predictors of smoking did not explain rural women’s significantly different trend from those of the other three groups.
Conclusion:
Rural women lag behind rural men, urban men and urban women in decreasing smoking, a health disparity finding that supports the need for tobacco control and regulatory policies and interventions that are more effective in reducing smoking among rural women.
Keywords: Smoking trends, Tobacco control, Tobacco regulation, Smoking gender differences, Rural smoking
1. Introduction
Cigarette smoking is the leading cause of preventable disease and death in the world, and monitoring cigarette smoking trends is essential for prioritizing, designing, and assessing the effectiveness of tobacco control and regulatory policies (World Health Organization and Research for International Tobacco Control, 2008). Prevalence patterns of smoking in rural vs urban communities vary by country (Idris et al., 2007; Kaleta et al., 2012; Ross et al., 2008; Almeida et al., 2012; Palipudi et al., 2014). In economically developed countries, smoking and tobacco use tend to be higher in urban than rural settings (Idris et al., 2007; Kaleta et al., 2012). Likewise, cigarette smoking in the United States (U.S.) used to be higher in urban than rural settings at least until 1976 (Haenszel et al., 1956; Singh et al., 2012). Since then, as overall smoking prevalence declined in the U.S., cigarette smoking became more prevalent in rural than urban settings (Eberhardt et al., 2001; Agency for Healthcare Research and Quality, 2014). This differential smoking prevalence crossover between rural and urban areas is likely the result of the smoking epidemic taking hold and beginning to decline at a later time in rural than urban areas (see Lopez et al., 1994), which would also explain why lung-cancer rates in rural areas lagged behind and did not exceed those of urban areas until the 1980s for men and mid-1990s for women (Singh et al., 2012).
In the U.S. (Bolin et al., 2015) and globally (Scheil-Adlung, 2015), socio-structural inequities influence health behaviors and in turn impact morbidity and mortality (Hartley, 2004; Mansfield et al., 1999). Regardless of U.S. region, poverty rates are higher in rural than urban areas, there are proportionally more elderly people in rural than urban areas, educational attainment is lower among rural than urban residents, and although ethnic and racial diversity differs from region to region, the composition of the population is generally less diverse in rural than urban areas (Bolin et al., 2015). Given the higher poverty, lower educational attainment, and lower access to health care present in rural than urban areas, rural America consistently faces unique health disparities and is more likely to record behaviors that lead to adverse health effects, including cigarette smoking (Bolin et al., 2015; Hart et al., 2005; National Center for Health Statistics, 2012; Pettit and Nienhaus, 2010; The Rural Health Reform Policy Research Center, 2014; Weaver et al., 2013). However, recent attempts to model cigarette smoking trends in rural and urban populations demonstrate that well-established socioeconomic, psychosocial, and demographic risk factors for smoking do not fully account for rural disparities in smoking trends (Doescher et al., 2006; Doogan et al., 2017). Without a full understanding of the factors that inhibit smoking-trend declines in rural areas, tobacco control and regulatory efforts may fail to reach rural populations or be less effective in rural than urban settings.
The noted crossover of higher lung-cancer mortality (as a percentage of all deaths) in rural than urban communities, which was first noted among men and later among women, is consistent with the observation that smoking trends follow different rise-fall time-lines in men and women (Thun et al., 2012). In the U.S., as in other high-resource countries (Lopez et al., 1994; Thun et al., 2012), smoking became firmly established among women 25 to 30 years later than among men (U.S. Department of Health and Human Services, 1980), and while men’s smoking began to fall in the second half of the 1950s, women’s smoking continued to increase until the mid 1960s and did not decrease substantively until the start of the 1970s (Schuman, 1977). Although smoking prevalence started to decline earlier in men than women, U.S. men remain more likely to be smokers than women (Higgins et al., 2015; U.S. Department of Health and Human Services, 2014).
Given the unique smoking-trend crossover between rural and urban America (Haenszel et al., 1956; Agency for Healthcare Research and Quality, 2014), the relatively new finding that rural residency predicts smoking even after statistically adjusting for robust psychosocial, socioeconomic and demographic smoking risk factors that are more prevalent in rural than urban areas (Doescher et al., 2006; Doogan et al., 2017), and given that women’s smoking rise-fall cycles universally lag behind that of men (Lopez et al., 1994; Thun et al., 2012), the purpose of the present study was to investigate how gender may moderate rural, smoking-trend disparities. To our knowledge, differences between men and women in smoking prevalence time trends in rural and non-rural areas have not been previously reported. This study used the same database as in the earlier report by Doogan et al. (2017), where rural-urban differences in cigarette smoking trends were established after controlling for smoking risk factors, but in which gender by geographic setting interactions were not investigated. More specifically, we examined the extent to which rural disparities over time may differ for U.S. men and women, information that has the potential to be helpful with policy makers charged with protecting the public health against the adverse impacts of tobacco use.
2. Methods
2.1. Data source
Data came from the National Survey on Drug Use and Health (NSDUH)—a U.S. nationally representative cross-sectional survey that has been conducted annually since 1990. To ensure comparability with Doogan et al. (2017), we restricted our analyses to years 2007 through 2014, and to adults ( ≥ 18 years). We used participant weights included with the survey data to obtain results representative of the US population by correcting for selection probabilities, non-response, and poststratification (Center for Behavioral Health Statistics and Quality, 2014). Hereafter, references to “adjusted” or “unadjusted” models refer to covariate adjustment, rather than to weight adjustments for representativeness.
2.2. Measures
To maintain comparability with previous investigations (Doescher et al., 2006; Doogan et al., 2017), the dependent variable, ‘current smoking’, was defined as self-reported use of at least one cigarette in the past 30 days and at least 100 cigarettes lifetime. The key predictor variables were gender stratified by geographic setting (urban men, rural men, urban women, and rural women), time (survey year), and the interactions between time and each of the gender/setting groups. The NSDUH classifies “gender” only as male or female, which means that our gender categorization is limited and may misclassify transgendered individuals. Geographic setting was a county level classification from the Office of Management and Budget called the Rural Urban Continuum Codes (based on the 2000 Census data and 2013 statistical area classifications) (Cromartie and Parker, 2016). Respondents were classified as urban if they were from core counties that are part of an urbanized area with a population size > 10,000, or an outlying county with 25% or more of its labor force tied to a core county by commuting flows (Cromartie and Parker, 2016). Rural participants were those with homes not in an urban area. Time ranged from zero (year 2007) to seven (year 2014). The covariates included four polytomous variables, age, race, education, and income, and eight dichotomous conditions, unemployed, outdoor occupation, married, anxiety, depression, health insurance (any type), smokeless tobacco use, and substance abuse (see Table 1).
Table 1.
Descriptive statistics of the combined 2007–2014 sample, including percentages weighted to reflect the U.S. population.
| Male | Female | Overall | ||||||||
|---|---|---|---|---|---|---|---|---|---|---|
| Rural (n = 30,016) | Urban (n = 110,734) | Rural (n = 34,437) | Urban (n = 128,124) | Sample N | Adjusted % | |||||
| Sample N | Adjusted % | Sample N | Adjusted % | Sample N | Adjusted % | Sample N | Adjusted % | |||
| Age | ||||||||||
| 18–25 | 13,921 | 13.9% | 53,216 | 15.4% | 15,294 | 12.8% | 59,042 | 14.3% | 141,473 | 14.6% |
| 26–29 | 1993 | 6.2% | 8291 | 7.9% | 2298 | 5.7% | 9712 | 7.3% | 22,294 | 7.3% |
| 30–34 | 2180 | 7.1% | 9083 | 8.8% | 2702 | 7.4% | 10,816 | 8.5% | 24,781 | 8.5% |
| 35–49 | 6218 | 25.3% | 23,449 | 27.9% | 7468 | 25.0% | 27,915 | 26.9% | 65,050 | 27.0% |
| 50–64 | 3420 | 27.7% | 10,549 | 24.8% | 3975 | 27.6% | 12,720 | 24.6% | 30,664 | 25.2% |
| 65 + | 2284 | 19.7% | 6146 | 15.1% | 2700 | 21.6% | 7919 | 18.3% | 19,049 | 17.4% |
| Race | ||||||||||
| White | 23,402 | 83.4% | 66,966 | 64.9% | 26,695 | 82.7% | 75,344 | 64.3% | 192,407 | 67.6% |
| African American | 1777 | 6.8% | 14,247 | 11.5% | 2364 | 8.1% | 18,832 | 13.1% | 37,220 | 11.5% |
| Native American | 1081 | 1.3% | 968 | 0.3% | 1270 | 1.4% | 1156 | 0.3% | 4475 | 0.5% |
| Native Hawaiian/Pacific Islander | 149 | 0.2% | 512 | 0.3% | 160 | 0.2% | 590 | 0.3% | 1411 | 0.3% |
| Asian | 423 | 0.8% | 5228 | 5.2% | 511 | 1.0% | 5697 | 5.5% | 11,859 | 4.7% |
| Hispanic | 2247 | 6.0% | 19,707 | 16.5% | 2459 | 5.4% | 22,929 | 15.1% | 47,342 | 14.2% |
| Other | 937 | 1.5% | 3106 | 1.2% | 978 | 1.2% | 3576 | 1.3% | 8597 | 1.3% |
| Education | ||||||||||
| < High school | 6201 | 20.1% | 18,638 | 14.4% | 5551 | 16.4% | 17,676 | 13.1% | 48,066 | 14.5% |
| High school | 11,850 | 38.6% | 35,305 | 28.7% | 12,371 | 37.4% | 37,903 | 28.5% | 97,429 | 30.1% |
| Some college | 7659 | 23.5% | 30,939 | 25.0% | 10,688 | 28.1% | 39,934 | 27.5% | 89,220 | 26.2% |
| ≥ College | 4306 | 17.8% | 25,852 | 31.9% | 5827 | 18.1% | 32,611 | 30.9% | 68,596 | 29.2% |
| Income | ||||||||||
| ≤$20,000 | 7742 | 20.2% | 23,953 | 15.0% | 10,445 | 26.1% | 33,662 | 19.3% | 75,802 | 18.2% |
| $20,000 to $49,999 | 11,155 | 37.9% | 36,464 | 30.2% | 12,840 | 38.6% | 42,722 | 32.3% | 103,181 | 32.4% |
| $50,000 to $74,999 | 5006 | 18.5% | 18,168 | 17.5% | 5379 | 16.9% | 20,177 | 17.0% | 48,730 | 17.3% |
| ≥$75,000 | 6113 | 23.4% | 32,149 | 37.3% | 5773 | 18.5% | 31,563 | 31.4% | 75,598 | 32.1% |
| Unemployed | 2299 | 4.5% | 8946 | 5.0% | 1938 | 3.7% | 8270 | 3.9% | 21,453 | 4.4% |
| Outdoor occupation | 3923 | 11.2% | 9347 | 7.8% | 288 | 0.6% | 429 | 0.3% | 13,987 | 4.2% |
| Married | 11,587 | 58.7% | 38,205 | 55.1% | 14,532 | 55.1% | 46,852 | 50.7% | 111,176 | 53.5% |
| Anxiety | 1183 | 3.6% | 4288 | 3.7% | 3183 | 8.6% | 10,581 | 7.4% | 19,235 | 5.7% |
| Depression | 1467 | 4.9% | 5058 | 4.8% | 4137 | 11.9% | 12,899 | 9.7% | 23,561 | 7.5% |
| Health insurance | 23,135 | 82.6% | 85,505 | 83.0% | 28,088 | 84.6% | 106,205 | 86.7% | 242,933 | 84.7% |
| Smokeless tobacco use | 5087 | 13.4% | 8592 | 5.6% | 392 | 0.8% | 502 | 0.3% | 14,573 | 3.5% |
| Other substance abuse | 5243 | 10.9% | 19,405 | 12.2% | 3100 | 4.5% | 13,027 | 6.1% | 40,775 | 8.8% |
| Current cigarette use | 10,266 | 30.1% | 31,291 | 23.9% | 10,031 | 24.8% | 28,386 | 18.8% | 79,974 | 22.3% |
| Daily cigarette use | 6926 | 21.8% | 18,633 | 15.0% | 7398 | 18.9% | 18,707 | 12.8% | 51,664 | 14.9% |
2.3. Statistical analyses
In addition to reporting descriptive statistics for the total sample and gender by rural/urban setting, we used logistic regression to predict current smoking status with and without controlling for risk factors. In the ‘unadjusted’ model, we treated urban men as the referent group and entered the remaining gender stratified groups (i.e., rural men, urban women, and rural women), time, and all the possible two-way interactions (i.e., rural men x time, urban women x time, rural women x time) as the predictors. Urban men defined the referent or baseline group because historically urban men in the U.S., as well as in any other economically developed country (Kaleta et al., 2012; Lopez et al., 1994), preceded the other groups in the widespread uptake of cigarette smoking (Schuman, 1977). Within this model, gender-setting coefficients reflected intercept (2007) differences between each of the entered groups and urban men (referent group), the time coefficient revealed the smoking trend of urban men, and the three two-way interactions involving time supported examination of slope-trend differences of each gender-stratified group compared with urban men. We then fit a ‘covariate adjusted’ model to control for a comprehensive set of risk factors (see Table 2) (Doogan et al., 2017).
Table 2.
Unadjusted and fully adjusted multivariable logistic regression coefficients for a model of current smoking (National Survey on Drug Use and Health, years 2007–2014).
| Unadjusted model | Fully adjusted model | |||||
|---|---|---|---|---|---|---|
| OR | 95% CI | OR | 95% CI | |||
| (Intercept) | 0.350 | 0.335 | 0.361 | 0.437 | 0.399 | 0.479 |
| Rurality by sex (urban men) | ||||||
| Rural men | 1.334 | 1.233 | 1.442 | 1.040 | 0.953 | 1.136 |
| Urban women | 0.755 | 0.721 | 0.789 | 0.809 | 0.768 | 0.852 |
| Rural women | 0.951 | 0.871 | 1.038 | 0.797 | 0.729 | 0.872 |
| Time (urban men trend) | 0.974 | 0.965 | 0.982 | 0.983 | 0.973 | 0.992 |
| Rural men × time | 1.007 | 0.989 | 1.026 | 1.010 | 0.990 | 1.030 |
| Urban women × time | 0.992 | 0.981 | 1.003 | 0.989 | 0.978 | 1.001 |
| Rural women × time | 1.028 | 1.007 | 1.049 | 1.026 | 1.002 | 1.050 |
| Education (< high school) | ||||||
| High school | 0.773 | 0.742 | 0.806 | |||
| Some college | 0.600 | 0.573 | 0.628 | |||
| College grad | 0.281 | 0.267 | 0.295 | |||
| Income (< $20,000) | ||||||
| $20,000 to $49,999 | 0.917 | 0.886 | 0.948 | |||
| $50,000 to $74,999 | 0.749 | 0.716 | 0.785 | |||
| ≥$75,000 | 0.612 | 0.589 | 0.636 | |||
| Race/ethnicity (White) | ||||||
| African American | 0.592 | 0.562 | 0.623 | |||
| Native American | 0.966 | 0.827 | 1.127 | |||
| Native Hawaiian/Pacific Islander | 0.638 | 0.497 | 0.820 | |||
| Asian American | 0.434 | 0.395 | 0.477 | |||
| Hispanic | 0.342 | 0.321 | 0.363 | |||
| Other | 1.121 | 1.016 | 1.237 | |||
| Age (> 64) | ||||||
| 18–25 | 2.217 | 2.050 | 2.396 | |||
| 26–29 | 4.402 | 4.026 | 4.814 | |||
| 30–34 | 4.720 | 4.340 | 5.134 | |||
| 35–49 | 3.952 | 3.680 | 4.243 | |||
| 50–64 | 3.102 | 2.865 | 3.359 | |||
| Married | 0.593 | 0.576 | 0.612 | |||
| Unemployed | 1.328 | 1.260 | 1.400 | |||
| Depression | 1.224 | 1.152 | 1.301 | |||
| Anxiety | 1.524 | 1.435 | 1.620 | |||
| Substance abuse | 2.774 | 2.666 | 2.887 | |||
| Outdoor occupation | 1.166 | 1.096 | 1.240 | |||
| Smokeless tobacco use | 1.053 | 0.987 | 1.124 | |||
| Health insurance coverage | 0.707 | 0.680 | 0.735 | |||
For polytomous variables, the reference group is listed within parenthesis; for dichotomous variables, the coefficients refer to the conditions listed (coded as “1”).
To facilitate interpretation, we plotted predictions from the unadjusted and adjusted models to visualize prevalence trajectories along with their 95% confidence bands for all four groups. For predictions drawn from the covariate-adjusted model, we used the weight-adjusted mode (see the “Adjusted %” column of the overall population in Table 1) of categorical variables so the adjusted trends represented identical populations with the exception of the gender-region group. That is, with respect to our model and the covariates included in it, the only differences among the four trend lines in the adjusted prevalence plot are rural residence status, gender, or both. Note that the trend lines and 95% confidence bands would not change regardless of which geographic/gender group combination is used as the comparison referent group in the analyses.
3. Results
3.1. Descriptive analysis
The analytic sample included 303,311 participants who responded to all necessary survey items (or 98.5% of the 307,935, starting sample). The absolute percentage differences of missing data between men (2%), women (1%), rural (1.4%) and urban (1.5%) participants ranged from 0.1% to 1.0%. The urban and rural populations were represented by 238,858 (78.8%) and 64,453 (21.2%) respondents, respectively. Regarding gender by geographic status, the sample included 128,124 (42.2%) urban women, 34,437 (11.4%) rural women, 110,734 (36.5%) urban men, and 30,016 (9.9%) rural men. A total of 79,974 (26.4%) participants were classified as current cigarette smokers.
Table 1 presents descriptive statistics of the overall sample and across rural/urban status and gender, and includes percentages adjusted to reflect national characteristic distributions. Comparisons of the descriptive statistics show that overall in the years 2007–2014, rural men and women were near half as likely to graduate from college, and almost 1.5 times more likely to have annual incomes below $20,000 than their urban counterparts. Rates of anxiety and depression between rural and urban areas were similar for men and lower in men than women, but rural women were about 1.2 times as likely to be anxious or depressed than urban women. Substance abuse was more than twice as prevalent in men than women, and more prevalent in urban than rural participants. In addition, rural men and women were less racially diverse, older, more likely to have outdoor occupations, and more likely to use smokeless tobacco than their urban counterparts. Smoking prevalence varied across subgroups with rural men reporting the highest current (30.1%) and daily (21.8%) smoking rates, followed by rural women (current = 24.8%, daily = 18.9%), urban men (current = 23.9%, daily = 15.0%), and urban women (current = 18.8%, daily = 12.8%).
3.2. Multivariable analyses
3.2.1. Unadjusted model
Table 2 contains the coefficients and 95% CIs estimated for the unadjusted and adjusted multivariable logistic regression time trend models. Within the body of the manuscript, all ORs are reported followed by their 95% CIs in brackets. In 2007, in comparison to urban men, the odds of being a smoker were higher for rural men (OR = 1.334 [1.233–1.442]), lower for urban women (OR = 0.755 [0.721–0.789]) and no different for rural women (OR = 0.951 [0.871–1.038]). The time coefficient indicated near a 2.6% decrease in the overall odds of urban men smoking for each year following 2007 (OR = 0.976 [0.965–0.982]). The smoking trend of neither urban women (OR = 0.992 [0.981–1.003]) nor rural men (OR = 1.007 [0.989–1.003]) differed significantly from that of urban men, but the trend for rural women did not decline (see Fig. 1) and was significantly different than the trend for urban men (OR = 1.028 [1.007–1.049]).
Fig. 1.
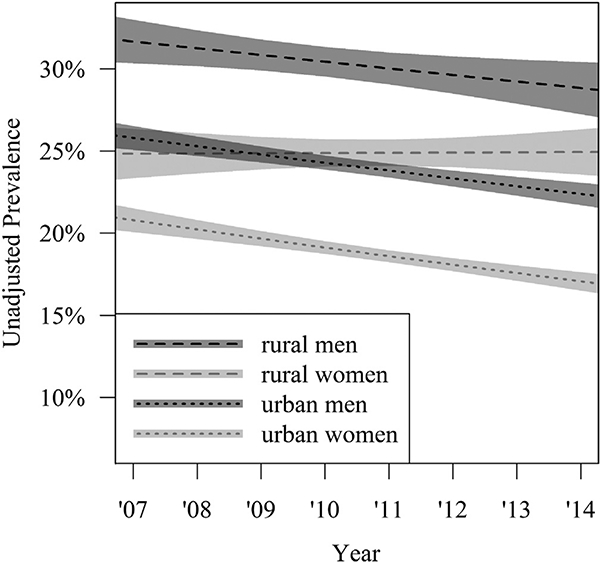
Covariate-unadjusted yearly current cigarette smoking prevalencetrends with 95% confidence bands for rural and urban men and women populations. Estimates are weight-adjusted to reflect the U.S. population.
Fig. 1 provides a visual representation of the unadjusted results. In 2007, smoking prevalence was lowest for urban women, lower in rural women than urban men, and highest among rural men. The only overlap between the four 95% CI bands around the unadjusted smoking trends was between urban men and rural women from 2007 to 2011. That is, in 2007, smoking was highest among rural men, not different between urban men and rural women, and significantly different for the latter two vs urban women. In 2014, smoking prevalence continued to be lowest for urban women and highest for rural men; but rural women and urban men flipped prevalence ranks such that rural women had a higher smoking prevalence than urban men. The 95% CI bands suggest that by 2014 smoking prevalence rates were highest in rural men, significantly higher in rural women compared to urban men, and significantly higher in urban men than urban women.
3.2.2. Covariate-adjusted model
In 2007, in comparison to urban men, the adjusted odds of being a smoker were no different for rural men (OR = 1.040 [0.953–1.136]), but lower for both urban women (OR = 0.809 [0.768–0.852]) and rural women (OR = 0.797 [0.729–0.872]). The time coefficient indicated a 1.7% per year decrease in the risk-adjusted, smoking odds of urban men (OR = 0.983 [0.978–0.992]). Neither the adjusted trend of rural men (OR = 1.010 [0.990–1.030]) nor urban women (OR = 0.989 [0.978–1.001]) differed significantly from the declining adjusted trend of urban men. On the other hand, the adjusted trend of rural women did not decline and was significantly different from the declining adjusted trend of urban men (OR = 1.026 [1.002–1.050]).
The adjusted results are represented in Fig. 2 by depicting the model’s four, covariate-adjusted smoking trend lines for men and women across rural and urban settings. In 2007, the two 95% CI error bands for rural and urban men overlap and start at a substantively higher smoking prevalence rate than the two bands for rural and urban women, which also overlap among themselves. The 95% CI error bands between rural men and urban men trends overlap continuously from 2007 to 2014. Conversely, the 95% CI error bands between rural women and urban women overlap from 2007 to 2010, but diverge from each other from 2011 to 2014 as the trend for rural women continues to remain flat and the trend for urban women continues to decline. From 2012 onward, the 95% CI error trend band for rural women begins to overlap with that of urban men, and by 2014, the 95% CI error bands for rural women, urban men, and rural men overlapped with each other.
Fig. 2.
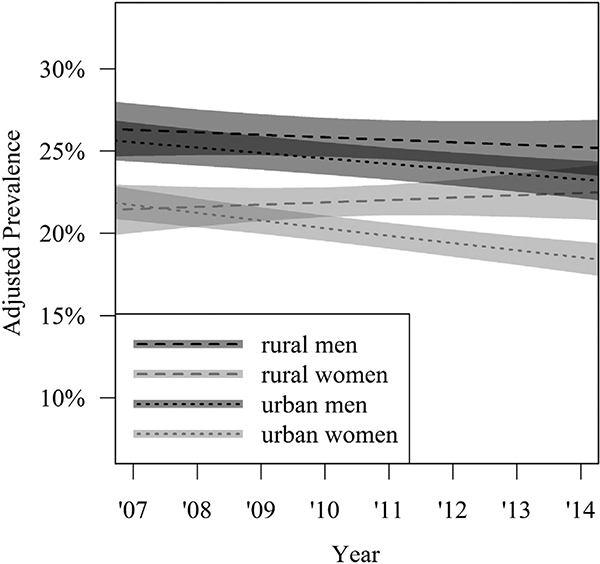
Rural and urban men and women current cigarette smoking prevalence, trends, and 95% confidence bands adjusted to a common characteristic profile, visualizing the unique contribution of rural residence and gender across time given our adjusted model. Estimates are weight adjusted to reflect the U.S. population.
4. Discussion
The present study is the first to demonstrate that recent annual smoking prevalence trends declined for urban men, rural men and urban women, but remained stationary for rural women. More specifically, we found a statistically significant declining trend for urban men that did not differ significantly from the declining trends of rural men and urban women. Conversely, the smoking trend of rural women did not decline and was significantly different from the trajectory observed for urban men. The evidence that rural women are not bene-fitting from the same reductions in smoking prevalence seen among other parts of the population is strong given that we used a nationally representative data set that spanned eight consecutive years, and the results remained significant even after adjusting for psychosocial, socioeconomic, and demographic smoking risk factors. Noteworthy is the striking contrast between rural and urban women, with the former showing no decline and the latter registering the steepest trend decline of all the groups.
Using the same data set and adjusting for the same risk factors, Doogan et al. (2017) reported that rural and urban smoking prevalence rates collapsed across genders did not differ between 2007 and 2010, but began separating thereafter with prevalence rates becoming increasingly greater in rural than urban settings between 2011 and 2014. Our results qualify these earlier findings to show that rural vs urban discrepancies were largely restricted to adjusted trend differences between rural and urban women. That is, whereas the adjusted smoking trend bands for rural and urban men continuously overlapped between 2007 and 2014, the adjusted smoking trends for rural and urban women overlapped only between 2007 and 2010, and then separated with the gap becoming progressively wider, as smoking prevalence rates remained flat among rural women but declined sharply among urban women between 2011 and 2014 (see Fig. 2, c.f., Doogan et al., 2017).
Our results suggest that rural women are at a delayed stage of the smoking epidemic with respect to urban women. The “four-stage model of the cigarette epidemic” was first proposed by Lopez et al. (1994), and was most recently updated by Thun et al. (2012). The original model described the relationship between male and female rise-fall cycles of smoking and smoking-attributable mortality (Lopez et al., 1994). The updated model recommends defining the four stages separately within each gender because male to female relationships may vary from country to country along degrees of economic development (Thun et al., 2012). Stage 1 is defined by the beginning of the epidemic, when smoking has just started to rise for any given population and gender. Stage 2 is characterized by a rapidly rising smoking prevalence and, due to the delay between smoking and detectable smoking-related health effects, a relatively low prevalence of smoking-attributable mortality. In stage 3, smoking prevalence is stable or beginning to decrease, but smoking-attributed mortality increases rapidly. Finally, stage 4 represents the period when both smoking prevalence rates and the percentage of smoking-attributed mortality decrease together. Although we did not examine smoking-attributable mortality, the relatively flat smoking-trend seen for rural women and the contrasting declining trend seen in urban women would suggest that rural and urban women are respectively in stages 3 and 4 of the smoking epidemic. Congruent with this reasoning is the finding that lung-cancer rates for rural and urban women were respectively increasing and decreasing in the mid-1990s (Singh et al., 2012). Therefore, our findings point tobacco control and regulation researchers and policy makers to the need to continue to monitor gendered smoking trends not only stratified by age, race, and educational status, which is relatively common, but also by rural and urban geography, which is rare.
The finding that rurality is a unique smoking vulnerability for women also aligns with the hypothesis that the cumulative effect of life-course disadvantages uniquely contributes to women’s smoking beyond socioeconomic and psychosocial determinants of smoking (Graham, 2009). That is, given that living in a rural community increases the likelihood of accumulating intersecting health-risk indicators (Weaver et al., 2013), and that this phenomenon held largely true for the rural women in our sample (they were the most likely to be poor, depressed and anxious; see Table 1), it is possible that non-modelled interactions among these risk factors, as well as non-modelled life-course disadvantages could explain the absence of a downward smoking trend in rural women.
Both differential smoking-initiation and smoking-cessation rates are likely contributors to the unique absence of smoking prevalence-trend declines found among rural women but present among the other three gender-setting groups. Regarding smoking initiation, Nelson et al. (2008) reported smoking rates for girls that steadily declined from 1976 to 1992, substantively increased from 1992 to 1997, and then fell to below 1992 levels by 2005. When these data were parsed by “metropolitan statistical area”, the overall down-up-down pattern remained but with noticeable and substantive slope differences between urban and rural adolescent girls. That is, from 1976 to 2005, rural girls accrued considerably less pronounced declines in smoking initiation than urban girls, urban boys, and rural boys (Nelson et al., 2008).
Regarding smoking cessation, recent data from the National Health Interview Survey (NHIS) indicate no gender differences in interest in quitting, quitting-attempts, and quit-success rates (U.S. Department of Health and Human Services, 2014). Similarly, time-trend statistics show that although quit-rates were substantially higher for men than women from 1965 to the early 1990s, smoking-cessation rate-differences between the genders disappeared by 2005 (U.S. Department of Health and Human Services, 2014). However, although we did not find any studies that explicitly reported smoking-cessation rates by rural and urban setting, other data may suggest that smoking-cessation rates are likely lower in rural than urban communities, and in rural women than rural men. For instance, rural smokers smoke more heavily than urban smokers (U.S. Department of Health and Human Services, 2014) and level of nicotine dependence is negatively associated with quitting success (Baker et al., 2007). In addition, individuals living in rural communities have lower access to health insurance, health-care services, and smoking cessation programs (Hutcheson et al., 2008), which might be particularly unfavorable to rural women given that clinical research shows that women have greater difficulties in quitting than men (Cepeda-Benito et al., 2004; Reynoso et al., 2005; Perkins, 2008; Smith et al., 2016, c.f. Jarvis et al., 2013) and women’s quitting success largely rests on having access to intensive smoking-cessation counseling (Cepeda-Benito et al., 2004). Whereas the NSDUH data allowed us to control for the influence of health insurance coverage in the adjusted model, the NSDUH data set does not include other potentially important variables, such as exposure to health-promoting communications, or access to health care.
Highly relevant to our findings is the fact that research evidence unequivocally demonstrates that tobacco-control policies, media campaigns, and comprehensive community and state-wide initiatives effectively prevent and reduce smoking among youth and adults (U.S. Department of Health and Human Services, 2014). The presence of a pronounced smoking prevalence decline among urban women but not rural women, as well as the maintenance of initiation rates observed for rural adolescent girls (Nelson et al., 2008), suggest that, in comparison to urban women, rural women might be less exposed to (or benefit less from) tobacco control and regulatory efforts, such as clean indoor air policies in workplaces and other public venues (York et al., 2010), smoking-cessation services (Vallone et al., 2009), or campaigns aimed at curbing youth smoking. For example, Vallone et al. (2009) reported that zip codes associated with lower levels of education, particularly for adolescent females, predicted lower familiarity with the Truth® smoking prevention campaign. To the extent that zip codes with low educational attainment are more likely to define rural than urban communities (United States Department of Agriculture ERS, 2017), Vallone et al.’s (2009) findings suggest that youth in rural areas, and particularly girls, are less likely to be reached by large-scale prevention efforts than youth living in urban areas.
This study has several limitations. The public use NSDUH data files lack the geographic identifiers that would have allowed us to adjust for the impact of state or local policy controls on tobacco use, which could have played a role in the result patterns we have observed. For instance, differential clean indoor air policies, excise taxes, or tobacco-control funding could all account for tobacco use differences between rural and urban areas, and across men and women (Golden et al., 2018). The NSDUH public use data also limits users to one useful measure of rur-ality, which is coarse with respect to geography (county-level) and with respect to the rural and urban gradients. More nuanced measures may have allowed us to learn, for example, whether gender vulnerability grows steadily with degrees of rurality, or if a threshold exists. Similarly, urban settings are not uniform and health-related behaviors and outcomes, including smoking, vary considerably across neighborhoods (Pampel et al., 2010; Sampson, 2012). Comparisons that examine in greater detail the intersectionality between poverty and the sociodemographic characteristics of different rural and urban communities and neighborhoods would help policy makers to use geography to fine tune and guide their approach to reduce tobacco use.
We already noted in the method section that the dichotomization of gender into male and female may have misclassified transgender persons, which would limit the interpretability of our findings and certainly prevents us from studying the full picture of the relationship between gender and smoking. Similarly, the NSDUH did not assess participants’ sexual orientation prior to 2015, which prevented us from including as a covariate LGBT status, a firmly established smoking risk vulnerability (Golden et al., 2018; Jamal et al., 2015).
5. Conclusions
The present results stress the need to treat rural women as a unique vulnerable population in the consideration of effective and equitable tobacco control, regulation, and health-related policies. Whereas future research efforts should study how or whether tobacco control and regulatory policies curb tobacco use in rural areas in general, and in rural women in particular, policy makers need not wait for further analysis to conclude that steps must be taken to ensure rural communities are included in tobacco control and regulatory efforts and that such efforts address and reach women.
Acknowledgments
Funding
This research was conducted as part of the ongoing work of the Tobacco Centers of Regulatory Science (TCORS) Vulnerable Populations Working Group, which is a collaborative effort supported by the National Institutes of Health (NIH) and Food and Drug Administration (FDA). Support came from TCORS award P50DA036114 from the National Institute on Drug Abuse (NIDA) and FDA, TCORS Award P50CA180908 from the National Cancer Institute (NCI) and FDA, Center for Evaluation and Coordination of Training and Research award U54CA189222 from NCI and FDA, Institutional Training Grant award T32DA07242 from NIDA, and Centers of Biomedical Research Excellence P20GM103644 award from the National Institute of General Medical Sciences. The content is solely the responsibility of the authors and does not necessarily represent the official views of the National Institutes of Health or Food and Drug Administration.
Footnotes
Conflicts of interest
None to declare.
References
- Agency for Healthcare Research and Quality, 2014. National Healthcare Quality and Disparities Report: Chartbook on Rural Health Care 2014. (Rockville, MD: ). [Google Scholar]
- Almeida L, Szklo A, Sampaio M, Souza M, Martins LF, Szklo M, ... Caixeta R, 2012. Global Adult Tobacco Survey data as a tool to monitor the WHO Framework Convention on Tobacco Control (WHO FCTC) implementation: the Brazilian case. Int. J. Environ. Res. Public Health 9, 2520–2536. http://dx.doi.org/10.3390/ ijerph9072520. [DOI] [PMC free article] [PubMed] [Google Scholar]
- Baker TB, Piper ME, McCarthy DE, Bolt DM, Smith SS, Kim SY, ... Hyland A, 2007. Time to first cigarette in the morning as an index of ability to quit smoking: implications for nicotine dependence. Nicotine Tob. Res 9, S555–70. 10.1080/14622200701673480. [DOI] [PMC free article] [PubMed] [Google Scholar]
- Bolin JN, Bellamy GR, Ferdinand AO, Vuong AM, Kash BA, Schulze A,Helduser JW, 2015. Rural healthy people 2020: new decade, same challenges. J. Rural. Health 31, 326–333. http://dx.doi.org/10.l l l l/jrh.12116. [DOI] [PubMed] [Google Scholar]
- Center for Behavioral Health Statistics and Quality, 2014. National Survey on Drug Use and Health: Methodological Summary and Definitions Substance Abuse and Mental Health Services Administration, Rockville, MD: (2015). [Google Scholar]
- Cepeda-Benito A, Reynoso JT, Erath S, 2004. Meta-analysis of the efficacy of nicotine replacement therapy for smoking cessation: differences between men and women. J. Consult. Clin. Psychol 72, 712–722. http://dx.doi.Org/10.1037/0022-006X.72.4.712. [DOI] [PubMed] [Google Scholar]
- Cromartie J, Parker T, 2016. USDA Economic Research Service - what is rural? http://www.ers.usda.gov/topics/rural economy-population/rural classifications/what-is-rural.aspx.
- Doescher MP, Jackson JE, Jerant A, Gary Hart L, 2006. Prevalence and trends in smoking: a national rural study. J. Rural. Health 22, 112–118. 10.1111/j.1748-0361.2006.00018.x. [DOI] [PubMed] [Google Scholar]
- Doogan NJ, Roberts ME, Wewers ME, Stanton CA, Keith DR, Galema DE, ... Higgings ST, 2017. A growing geographic disparity: rural and urban cigarette smoking trends in the United States. Prev. Med S0091–7435 (17), 30106–30108.http: //dx.doi.org/10.1016/j.ypmed .2017.03.011. [DOI] [PMC free article] [PubMed] [Google Scholar]
- Eberhardt M, Ingram D, Makuc D, 2001. Non-rural and Rural Health Chartbook National Center for Health Statistics, Hyattsville, MD. [Google Scholar]
- Golden SD, Kong AY, Lee JG, Ribisl KM, 2018. Disparities in cigarette tax exposure by race, ethnicity, poverty and sexual orientation, 2006–2014, USA. Prev. Med 108, 137–144. http://dx.doi.Org/10.1016/j.ypmed.2017.12.017. [DOI] [PMC free article] [PubMed] [Google Scholar]
- Graham H, 2009. Women and smoking: understanding socioeconomic influences. Drug Alcohol Depend. 104, Sll–6. http://dx.doi.Org/10.1016/j.drugalcdep.2009.02.009. [DOI] [PubMed] [Google Scholar]
- Haenszel W, Shimkin MB, Miller HP, 1956. Tobacco smoking patterns in the United States. Public Health Monogr. 45, 1–105. [PubMed] [Google Scholar]
- Hart LG, Larson EH, Lishner DM, 2005. Rural definitions for health policy and research. Am. J. Public Health 95, 1149–1155. 10.2105/AJPH.2004.042432. [DOI] [PMC free article] [PubMed] [Google Scholar]
- Hartley D, 2004. Rural health disparities, population health, and rural culture. Am. J. Public Health 94, 1675–1678. [DOI] [PMC free article] [PubMed] [Google Scholar]
- Higgins ST, Kurti AN, Redner R, White TJ, Gaalema DE, Roberts ME, Doogan NJ, Tidey JW, Miller ME, Stanton CA, Henningfield JE, Atwood GS, 2015. A literature review on prevalence of gender differences and intersections with other vulnerabilities to tobacco use in the United States, 2004–2014. Prev. Med 80, 89–100 (PMCID: PMC4592404). [DOI] [PMC free article] [PubMed] [Google Scholar]
- Hutcheson TD, Greiner KA, Ellerbeck EF, Jeffries SK, Mussulman LM, Casey GN, 2008. Understanding smoking cessation in rural communities. J. Rural. Health 24, 116–124. http://dx.d0i.0rg/l0.1111/j.1748-0361.2008.00147.x. [DOI] [PubMed] [Google Scholar]
- Idris BI, Giskes K, Borrell C, Benach J, Costa G, Federico B, ... Östergren PO, 2007. Higher smoking prevalence in urban compared to non-urban areas: time trends in six European countries. Health Place 13, 702–712. http://dx.doi.org/10.1016/j-heal thplace.2006.11.001. [DOI] [PubMed] [Google Scholar]
- Jamal A, Homa DM, O’Connor E, Babb SD, Caraballo RS, Singh T, Hu SS, King BA, 2015. Current cigarette smoking among adults—United States, 2005–2014. MMWR Morb. Mortal. Wkly Rep 64 (44), 1233–1240 (Nov 13). [DOI] [PubMed] [Google Scholar]
- Jarvis MJ, Cohen JE, Delnevo CD, Giovino GA, 2013. Dispelling myths about gender differences in smoking cessation: population data from the USA, Canada and Britain. Tob. Control 22, 356–360. 10.1136/tobaccocontrol-2011-050279. [DOI] [PubMed] [Google Scholar]
- Kaleta D, Makowiec-Dqbrowska T, Dziankowska-Zaborszczyk E, Fronczak A, 2012. Prevalence and socio-demographic correlates of daily cigarette smoking in Poland: results from the Global Adult Tobacco Survey (2009–2010). Int. J. Occup. Med. Environ. Health 25, 126–136. [DOI] [PubMed] [Google Scholar]
- Lopez AD, Collishaw N, Piha T, 1994. A descriptive model of the cigarette epidemic in developed countries. Tob. Control 3, 242–247. [Google Scholar]
- Mansfield CJ, Wilson JL, Kobrinski EJ, Mitchell J, 1999. Premature mortality in the United States: the roles of geographic area, socioeconomic status, household type, and availability of medical care. Am. J. Public Health 89, 893–898. [DOI] [PMC free article] [PubMed] [Google Scholar]
- National Center for Health Statistics, 2012. Health, United States, 2011: With Special Feature on Socioeconomic Status and Health. (Hyattsville, MD: ). [PubMed] [Google Scholar]
- Nelson DE, Mowery P, Asman K, Pederson LL, O’Malley PM, Malarcher A, ... Pechacek TF, 2008. Long-term trends in adolescent and young adult smoking in the United States: metapatterns and implications. Am. J. Public Health 98, 905–915. 10.2105/AJPH.2007.115931. [DOI] [PMC free article] [PubMed] [Google Scholar]
- Palipudi K, Rizwan SA, Sinha DN, Andes LJ, Amarchand R, Krishnan A, Asma S, 2014. Prevalence and sociodemographic determinants of tobacco use in four countries of the World Health Organization: South-East Asia region: findings from the Global Adult Tobacco Survey. Indian J. Cancer 51, S24–30. 10.4103/0019-509X.147446. [DOI] [PubMed] [Google Scholar]
- Pampel FC, Krueger PM, Denney JT, 2010. Socioeconomic disparities in health behaviors. Annu. Rev. Sociol 36, 349–370. [DOI] [PMC free article] [PubMed] [Google Scholar]
- Perkins KA, 2008. Sex differences in nicotine reinforcement and reward: influences on the persistence of tobacco smoking In: The Motivational Impact of Nicotine and Its Role in Tobacco Use. Springer, US, pp. 143–169. [DOI] [PubMed] [Google Scholar]
- Pettit ML, Nienhaus AR, 2010. The current scope of health disparities in the U.S.: a review of literature. Health Educ. 42, 47–55. [Google Scholar]
- Reynoso J, Susabda A, Cepeda-Benito A, 2005. Gender differences in smoking cessation. J. Psychopathol. Behav. Assess 27, 227–234. [Google Scholar]
- Ross H, Zaloshnja E, Levy DT, Tôle D, 2008. Results from the Albanian Adult Tobacco Survey. Cent. Eur. J. Public Health 16, 182–188. [DOI] [PubMed] [Google Scholar]
- Sampson RJ, 2012. Great American City: Chicago and the Enduring Neighborhood Effect. University of Chicago Press, Chicago, IL. [Google Scholar]
- Scheil-Adlung X, 2015. Global evidence on inequities in rural health protection. New data on rural deficits in health coverage for 174 countries In: ESS Working Paper. ILO, Geneva: (No 47). [Google Scholar]
- Schuman LM, 1977. Patterns of smoking behavior. Res. Smok. Behav 17, 46–50. [PubMed] [Google Scholar]
- Singh GK, Siahpush M, Williams SD, 2012. Changing urbanization patterns in U.S. lung cancer mortality, 1950–2007. J. Community Health 37, 412–420. http://dx.doi.org/10.1007/sl 0900-011-9458-3. [DOI] [PMC free article] [PubMed] [Google Scholar]
- Smith PH, Bessette AJ, Weinberger AH, Sheffer CE, McKee SA, 2016. Sex/ gender differences in smoking cessation: a review. Prev. Med 92, 135–140. 10.1016/j.ypmed.2016.07.013. [DOI] [PMC free article] [PubMed] [Google Scholar]
- The Rural Health Reform Policy Research Center, 2014. The 2014 update of the Rural Non-Rural Chartbook. https://ruralhealth.und.edu/projects/health-reform-policy-research-center/pdf/2014-rural-urban-chartbook-u pdate.pdf. [Google Scholar]
- Thun M, Peto R, Boreham J, Lopez AD, 2012. Stages of the cigarette epidemic on entering its second century. Tob. Control 21, 96–101. http://dx.doi.org/10.1136/ tobaccocontrol-2011-050294. [DOI] [PubMed] [Google Scholar]
- U.S. Department of Health and Human Services, 1980. The Health Consequences of Smoking for Women. A Report of the Surgeon General Centers for Disease Control and Prevention, Atlanta, GA. [Google Scholar]
- U.S. Department of Health and Human Services, 2014. The Health Consequences of Smoking—50 Years of Progress: A Report of the Surgeon General Centers for Disease Control and Prevention, Atlanta, GA. [Google Scholar]
- United States Department of Agriculture ERS, 2017. Rural education at a glance. Econ. Bull 171, 1–6. [Google Scholar]
- Vallone DM, Allen JA, Xiao H, 2009. Is socioeconomic status associated with awareness of and receptivity to the truth® campaign? Drug Alcohol Depend. 104, SI 15–20. http://dx.doi.Org/10.1016/j.drugalcdep.2009.03.015. [DOI] [PubMed] [Google Scholar]
- Weaver KE, Palmer N, Lu L, Case LD, Geiger AM, 2013. Rural-urban differences in health behaviors and implications for health status among U.S. cancer survivors. Cancer Causes Control 24, 1481–1490. 10.1007/sl0552-013-0225-x. [DOI] [PMC free article] [PubMed] [Google Scholar]
- World Health Organization & Research for International Tobacco Control, 2008. WHO Report on the Global Tobacco Epidemic, 2008: The MPOWER Package. WHO, Geneva. [Google Scholar]
- York NL, Rayens MK, Zhang M, Jones LG, Casey BR, Hahn EJ, 2010. Strength of tobacco control in rural communities. J. Rural. Health 26,120–128. 10.1111/j.1748-0361.2010.00273.x [DOI] [PMC free article] [PubMed] [Google Scholar]