

Abstract
During liver regeneration, most new hepatocytes arise via self-duplication; yet, the underlying mechanisms that drive hepatocyte proliferation following injury remain poorly defined. By combining high-resolution transcriptome- and polysome-profiling of hepatocytes purified from quiescent and toxin-injured mouse livers, we uncover pervasive alterations in the mRNA translation of metabolic and RNA processing factors, which modulate the protein levels of a set of splicing regulators. Specifically, downregulation of ESRP2 activates a neonatal alternative splicing program that rewires the Hippo signaling pathway in regenerating hepatocytes. We show that production of neonatal splice isoforms attenuates Hippo signaling, enables greater transcriptional activation of downstream target genes, and facilitates liver regeneration. We further demonstrate that ESRP2 deletion in mice causes excessive hepatocyte proliferation upon injury, whereas forced expression of ESRP2 inhibits proliferation by suppressing the expression of neonatal Hippo pathway isoforms. Thus, our findings reveal an ESRP2-Hippo pathway-alternative splicing axis that supports regeneration following chronic liver injury.
The mammalian liver possesses remarkable ability to regenerate after injury with the potential to restore up to 70% of its lost mass and function in just a few weeks 1,2. Under normal circumstances, the liver sustains the turnover of its fully differentiated parenchymal cells—hepatocytes and cholangiocytes—through self-duplication 3,4. Furthermore, upon acute injury like partial hepatectomy, residual mature hepatocytes undergo hypertrophy or re-enter the cell-cycle to proliferate and restore liver functionality 5. Yet, if the liver is severely damaged and hepatocyte proliferation compromised by certain drugs or toxins, other cells, such as the bipotential hepatobilliary progenitors may contribute towards regeneration by giving rise to new hepatocytes 6–8. These progenitor cells are thought to serve as facultative stem cells that can differentiate into hepatocytes or cholangiocytes during chronic injury conditions 9. Recent cell-fate and lineage-tracing studies, however, found no evidence for existence of such facultative stem cells in mouse livers, and demonstrated that, under both acute and chronic injury conditions, virtually all new hepatocytes are derived from pre-existing hepatocytes 10–16. These findings indicate that adult hepatocytes can replicate even after severe liver damage, but the core mechanisms that trigger a quiescent hepatocyte to re-enter the cell-cycle remain elusive.
Here, we sought to determine how hepatic gene expression programs are remodeled following injury to support proliferation while maintaining essential liver functions, and which factor(s) regulate these remodeling events. We developed a cell-type specific polyribosome profiling method and combined it with deep transcriptome analyses to probe mRNA translation at a genome-wide scale. Comparing ribosome occupancies of hepatocyte mRNAs from naïve and toxin-injured adult mouse livers revealed global translation reprogramming in regenerating hepatocytes, which mimicked a neonatal-like gene expression program. We found that downregulation of Epithelial Splicing Regulatory Protein 2 (ESRP2) is essential for reactivating the neonatal splicing program for a large set of mRNAs associated with cell proliferation including the Hippo signaling pathway. We also demonstrated that deletion of ESRP2 in mouse livers results in excessive hepatocyte proliferation upon injury, whereas maintaining high ESRP2 expression during toxin exposure blocks proliferation by inhibiting the adult-to-neonatal switch in splicing of core Hippo pathway genes. Thus, our results identify remodeling of mRNA splicing and translation as part of the molecular network that controls hepatocellular plasticity during regeneration and provide direct evidence that alternative splicing modulates Hippo signaling to tune hepatocyte proliferation in response to chronic liver injury.
RESULTS
Regenerating hepatocytes reactivate neonatal gene expression patterns
To study transcriptome changes in regenerating hepatocytes, we used toxin-induced liver injury model 17. Adult mice were fed a 0.1% DDC-supplemented diet for four weeks followed by whole liver tissue collection for histological analysis and hepatocyte isolation for RNA sequencing (Fig. 1a). Gross morphology of injured livers exhibited the expected pathology 18 including enlarged liver size, change in color from pale to dark red, and elevated serum ALT and AST levels (Fig. 1a, Supplementary Fig. 1a, 1b). Additional characteristic features of DDC injury such as the presence of porphyrin plugs, hepatic necrosis, cholestasis, inflammation, and ductal hyperplasia were also observed (Supplementary Fig. 1c). Furthermore, we detected a substantial increase in hepatocyte proliferation indicated by both EdU labeling of new DNA synthesis and immunostaining using hepatocyte nuclear factor 4-alpha (Hnf4α) and phospho-histone-3 (PH3) (Fig. 1b, 1c, and Supplementary Fig. 1c).
Figure 1. Mature hepatocytes activate neonatal gene expression patterns during liver regeneration.
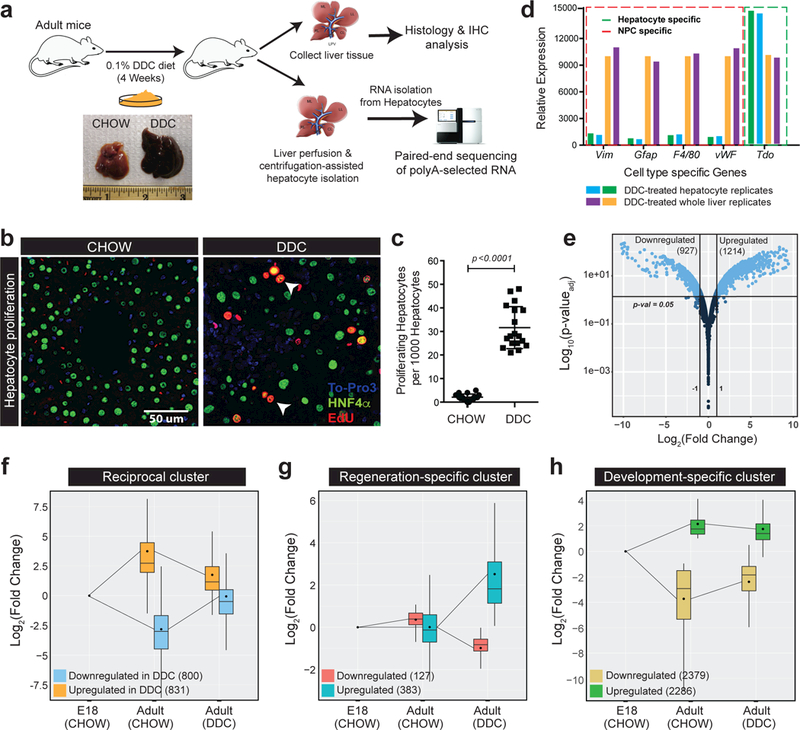
a,Experimental schematic of histologic and transcriptomic analysis following DDC-induced liver injury and regeneration in mice. b-c, Fluorescent imaging and quantification (parametric t-test, unpaired with Welch’s correction, two-sided) of hepatocyte proliferation measured by in vivo EDU incorporation in CHOW and DDC-treated livers. White arrows indicate proliferating hepatocytes (Hnf4α+, Green) co-labeled for incorporated EdU (Red), n = 3 animals/group. Each point indicates the value for a single field of view in the section (n = 6 fields/animal). Centre value represents the mean and error bars show the standard deviation. d, Relative mRNA expression (qPCR) of hepatocyte and non-parenchymal cell (NPC) specific gene markers in hepatocytes isolated from DDC-fed livers. e, Volcano plot showing changes in mRNA abundance from RNA-seq (n=2 samples/condition) in regenerating hepatocytes following DDC injury. Light blue color indicates significantly changing mRNAs (p<0.05, Wald test as described DESeq2; Log2(Fold Change)>1, and TPM>4). f-h, Box plots showing the direction and magnitude of significantly changing mRNA clusters in hepatocytes during development (E18-Adult CHOW) and regeneration (Adult CHOW-Adult DDC); p<0.05. Mean (black dots) and median (black lines) values along with inter-quartile range (box) are indicated. Lines extending from the box represent the overall class range.
Hepatocytes were isolated from CHOW-fed or DDC-injured adult livers and their relative purity determined by robust de-enrichment of non-parenchymal cell markers and a reciprocal enrichment of adult hepatocyte markers (Fig. 1d and Supplementary Fig. 1d). Because the hepatic transcriptome is extensively remodeled during postnatal liver maturation 19, we hypothesized that in order to proliferate a mature hepatocyte might utilize similar gene expression programs that are active in a neonatal hepatocyte. So, we isolated hepatocytes from embryonic day 18 (E18) livers in parallel ( Supplementary Fig. 1e) and performed RNA-sequencing on poly(A) selected RNA from all three sample groups (E18, adult CHOW-fed, adult-DDC fed). Excellent mapping rates and reproducibility between biological replicates were achieved (Supplementary Table 1, Supplementary Fig. 1f, 1g and 1h).
Injury-induced liver regeneration affected the mRNA abundance of approximately 21% of genes expressed in hepatocytes (>1TPM), as we identified 1214 upregulated and 927 downregulated mRNAs (Fold Change>2.0, FDR<0.05) between quiescent and toxin-injured hepatocytes (Fig. 1e). Comparative analysis of the E18 (CHOW)-Adult (CHOW) and Adult (CHOW)-Adult (DDC) transcriptomes revealed that nearly 76% of differentially expressed mRNAs (1631 of 2141) revert their expression pattern towards the neonatal stage (Fig. 1f). The other 24% of mRNAs (510 of 2141) changed exclusively in regenerating hepatocytes, as their abundance was unaltered through liver development (Fig. 1g). A large but separate cohort of developmentally regulated mRNAs, however, showed only a modest adult-to-neonatal shift in expression upon injury (Fig. 1h). Thus, our global analysis revealed portions of the hepatocyte transcriptome that undergo dampening of the adult, or reactivation of the neonatal gene expression program in response to injury (Supplementary Fig. 2a). Further, we noted that the transcripts exhibiting decreased expression upon injury form highly connected gene networks of biological functions associated with mature hepatocytes such as metabolic and biosynthetic processes (Supplementary Fig. 2b and 2c). In contrast, the transcripts exhibiting increased mRNA expression clustered into the cell-cycle and growth factor signaling categories. Interestingly, while the development-specific group was similarly enriched for metabolic and cell-cycle related genes (Supplementary Fig. 2b and 2e), the regeneration-specific group formed uniquely enriched clusters of mRNAs involved in immune or ER stress response, cell proliferation, and regulation of mRNA translation (Supplementary Fig. 2d). Overall, these results illustrate that, in response to injury, mature hepatocytes selectively reprogram a portion of their transcriptome to a less differentiated, ‘neonatal-like’ state.
Reprogramming of mRNA translation in regenerating hepatocytes
Because the mRNA translation process was enriched within the “regeneration-specific” gene cluster (Supplementary Fig. 2d), we hypothesized that, in addition to the transcriptome, hepatocytes may also reprogram their translatome following injury. We systematically probed the translation output of naïve and regenerating hepatocytes by combining cell-type specific in vivo polyribosome profiling with deep transcriptome analyses. To ensure proper isolation of intact mRNA and ribosomal complexes from hepatocytes, we first perfused the liver with cycloheximide to stall the translating ribosomes (Supplementary Fig. 3a). Addition of cycloheximide at the start of the isolation procedure circumvents any shifts in ribosomal occupancies due to the stress of the procedure itself, as stress responses can influence gene-specific translation within minutes 20. RNAs co-fractionating with monosomes, light polysomes (2–4 ribosomes) and heavy polysomes (>4 ribosomes) were purified, poly(A) selected, and sequenced to obtain transcript level abundances. For each fraction, high reproducibility between biological replicates was obtained (Supplementary Fig. 3b-3i).
To determine the changes in ribosomal occupancy of each transcript, an index we refer to as the fractional shift ratio (FSR) was calculated 21, which involved determining log2-ratios of the fractional abundance of transcripts present between CHOW and DDC-fed mice. This calculation was performed on all expressed transcripts from each fraction resulting in a distribution of transcript shift ratios (Fig. 2a-2c). A null set was generated using the control CHOW samples to allow for the determination of significant shifts in ribosome occupancy (p-value<0.01, FDR<0.1). We identified 1486 transcripts within 1326 (~9%) protein-coding genes that undergo robust ribosomal occupancy shifts in regenerating hepatocytes. Specifically, 796 transcripts showed increased ribosomal occupancy (translational activation) whereas 530 transcripts showed decreased ribosomal occupancy (translational repression). Among the groups of mRNAs with increased and decreased translation, we found further subclusters. For instance, while most mRNAs increasing in ribosomal occupancy shifted from monosomes directly to heavy polysomes, there were also groups of mRNAs that shifted from monosomes to light polysomes or light to heavy polysomes and vice versa (Fig. 2d). Hence, we conclude that the hepatocyte translatome is extensively reprogrammed after injury, and for many mRNA transcripts, this reprogramming varies greatly in terms of magnitude and regulatory dynamics.
Figure 2. Regenerating hepatocytes exhibit pervasive shifts in ribosome occupancies at transcripts encoding RNA processing and metabolic factors.
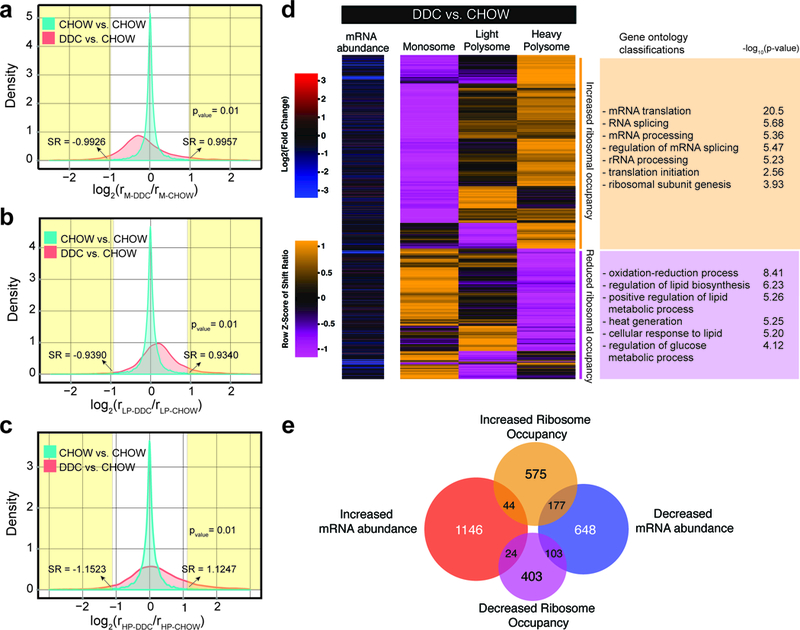
Distribution of calculated Fractional Shift Ratios between naïve- and DDC-injured hepatocytes (n = 2 animals/condition) for translating transcripts in a, Monosome, b, Light Polysome (LP), and c, Heavy Polysome (HP) fractions. The null distribution was empirically derived by random separation of the CHOW sample reads into two sets for each fraction. A transcript was called significant (t-test, two sided) when changing in, at least, two fractions with p<0.01, and FDR<0.05 (Benjamini-Hochberg, adjusting for multiple comparisons) in each fraction. SR: Shift ratio. d, Heatmap showing the row normalized fractional shift ratios for the 1486 transcripts changing significantly in their distribution between the three fractions and their corresponding enriched Gene Ontologies (p<0.05) against an expressed gene background set. e, Overlap of mRNA abundance and ribosomal occupancy changes in hepatocytes after DDC-injury.
We next asked if there was any overlap between gene sets shifting in ribosomal occupancy and/or mRNA abundance after injury. Only a small number of translationally regulated mRNAs showed a concurrent change in abundance, implying that these two modes of regulation occur independently in regenerating hepatocytes (Fig. 2e). The most significant network of translationally upregulated mRNAs belonged to “RNA processing and translation” categories whereas the translationally repressed genes clustered into the “glucose and lipid metabolism” related pathways (Fig. 2d). Intriguingly, these pathways are similarly enriched within gene sets that differ in mRNA abundance (Supplementary Fig. 2b); yet, the actual genes regulated via changes in either abundance or ribosome occupancies are mutually exclusive (Fig. 2e). These data, therefore, demonstrate that although the mRNA expression and translation regulatory networks appear to work independently at the individual gene level, their cumulative effects at the pathway level are synergistic during liver regeneration.
Regenerating hepatocytes alter translation of splicing factors and activate a neonatal splicing program
Transcripts coding for mRNA translation and splicing factors were enriched for ribosome occupancy shifts following injury (Fig. 2d and Supplementary Fig. 3j). We quantified individual transcript levels for eight developmentally regulated splicing factors in the liver 19 by qPCR and observed significant shift in ribosome occupancies for 7/8 factors (Fig. 3a). We also examined the protein abundance of these factors by western blots in hepatocytes and detected substantial changes in their steady-state protein levels (Fig. 3b). Thus, the mRNAs encoding splicing factors, which differed significantly in their ribosome occupancies upon toxin injury, exhibited a corresponding change at the protein level, verifying that our polysome profiling method can positively predict changes in protein abundance through translational regulation.
Figure 3. Altered translation of alternative splicing factors and activation of a neonatal splicing program in regenerating hepatocytes.
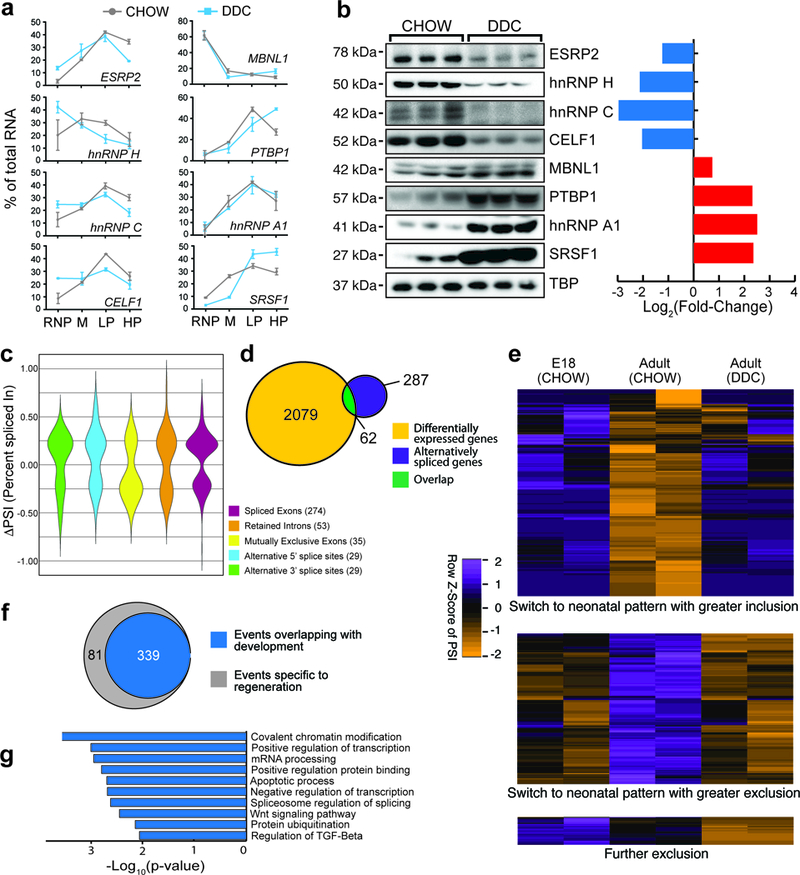
a,qPCR-based expression of select alternative splicing factors in different polysomal fractions of hepatocytes isolated from CHOW and DDC-fed mouse livers (n = 3 animals/condition). M: monosome, LP: Light polysome, HP: Heavy polysome. Data are mean ± s.d. b, Western blots and their respective quantification showing changes in protein abundance of select alternative splicing factors (n=5 animals, all blots were repeated independently at least 3 times). c, Violin distribution plots for significantly changing alternative splicing events after DDC injury according to the event types (p<0.05, FDR<0.10 from rMATS: adjusted for multiple testing, Difference in Percent Spliced Index [ΔPSI]≥15%, and Junction Counts≥10) obtained from RNA-seq of 2 biological replicates for each condition. d, Overlap of mRNA abundance and alternative splicing changes following DDC injury. e, Heatmap of PSI values showing splicing transitions (row normalized, PSI) overlapping between development (E18 CHOW-Adult CHOW) and regeneration (Adult CHOW-Adult DDC). Orange color indicates reduced exon inclusion and purple color indicates higher exon inclusion following DDC injury. Each paired column is an independent biological replicate. f, Venn diagram showing number of alternative splicing events in regenerating hepatocytes that are reciprocally regulated during normal development. g, GO analysis for significantly enriched pathways and molecular functions for genes undergoing alternative splicing following DDC injury. All uncropped gel images are provided in Supplementary data set 1.
Alternative splicing decisions are influenced by splice site strength, cis-acting regulatory elements within pre-mRNAs that promote or inhibit exon recognition, and activity of trans-acting factors that bind to these cis elements and regulate the accessibility of the spliceosome to splice sites 22–27. Given the notable changes in protein abundance for a number of splicing factors in regenerating hepatocytes, we further analyzed our RNA-seq data for changes in alternative splicing. We identified 420 significantly changing splicing events (ΔPSI>15%; FDR<0.10) within 349 genes; with an expected distribution of splice event type (Fig. 3c), and relatively little overlap with genes regulated at the mRNA abundance levels (Fig. 3d). Of the regeneration-regulated events, >80% were also regulated during development, with high similarity between the splicing patterns of neonatal and regenerating hepatocytes (Fig. 3e and 3f). Moreover, these alternatively spliced transcripts were enriched in functions such as chromatin modification, and regulation of transcription and splicing (Fig. 3g). Collectively, our data suggest that upon injury, hepatocytes redeploy a neonatal splicing program by modulating the protein abundance of key splicing factors through translational reprogramming.
mRNA and protein features of regeneration-regulated alternative exons
Global interactome studies have shown that alternatively spliced isoforms tend to generate distinct proteins rather than minor variants of each other 28, and these isoforms can be further post-translationally modified to produce even more diverse proteomes 29–31. To explore the functional impact of programmed changes in splicing, we first investigated the spatial distribution of regeneration-regulated exons along their associated transcripts. Of the alternatively spliced events detected from our analysis, 95% (399 of 420) occurred in protein-coding genes. Furthermore, 70% of differentially spliced exons were located within coding sequences (CDS) and a significant number of those (24%) encoded an alternate START or STOP codon (Fig. 4a). The CDS-mapped exons were further separated based on whether they were ORF preserving (exon length is a multiple of 3) or non-preserving. We found that the majority (~64%) of CDS events preserve the ORF thus adding or removing a peptide segment in the protein. Intriguingly, only 11 of the 66 (~17%) ORF non-preserving regions present within the CDS were predicted to be NMD targets (Fig. 4a). These results suggest that a number of regeneration-regulated exons may be altering the intrinsic features of respective proteins.
Figure 4. Regeneration-regulated alternative exons are enriched in unstructured protein domains and phosphorylation sites. a.
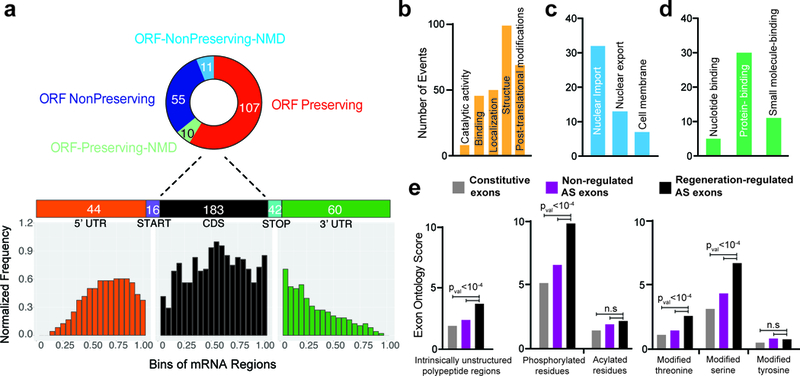
a,Breakup of DDC injury-induced alternatively spliced (AS) events into relative transcript regions, and their effects on the open reading frame (top). Metagene analysis of differentially spliced exons by their position on an mRNA transcript (bottom). b-d, Exon Ontology based distribution of differentially spliced exons according to the encoded protein features (b) and sub-distribution by localization (c), and binding (d). e, Regeneration-regulated alternative exons code for protein segments enriched for unstructured polypeptide regions and experimentally confirmed phosphorylated residues especially phospho-serine and phospho-threonine residues. Sample size is 247 regeneration-regulated mouse cassette exons. Background set and statistics (t-test, two sided) were used as defined by the ExonOntology and FasterDb databases. n.s: not significant.
Next, we selected regeneration-regulated cassette exons that had at least 80% sequence conservation between mice and humans (n=220) and probed their functional properties. Our analysis revealed many distinct protein features encoded by these exons including structural and binding elements, cellular localization, and post-translational modifications (PTMs) (Fig. 4b). Within the localization category, a significant number of exons (n=52) contain nuclear export and membrane localization signals suggesting that programmed changes in splicing after injury may be a common mechanism to regulate subcellular targeting of proteins (Fig. 4c). Amid different domains, “protein binding” segments predominated within the regeneration-regulated exons (Fig. 4d), and when compared with randomized sets of constitutive or non-regulated alternative exons, the regulated exons were significantly enriched for intrinsically unstructured regions (Fig. 4e). We further noted that these unstructured regions were enriched for phosphorylation compared to other PTM sites, and they frequently encoded conserved serine/threonine but not tyrosine residues (Fig. 4e). Altogether, these results suggest that through alternative inclusion of peptide segments—which contain protein binding domains or disordered binding motifs with phospho-sites—the regenerating hepatocytes may effectively rewire their protein-protein interactions.
ESRP2 downregulation following injury supports hepatocyte proliferation
Our next goal was to identify the regulatory factor(s) responsible for reactivating the neonatal splicing program and test if they serve any direct roles in liver regeneration. Amongst the various splicing factors that differed in expression after DDC injury (Fig. 3a-b), we elected to focus on ESRP2 because: (i) ESRP2 binding motifs were highly enriched around regeneration-regulated exons, and (ii) ESRP2 is a key hepatocyte factor that controls ~20% of splice isoform transitions occurring naturally during postnatal liver development 19. To determine whether injury-induced ESRP2 downregulation is reversible, we administered DDC diet to wildtype (WT) mice for four weeks (injury phase) and then switched them to regular CHOW diet for the next four weeks (recovery phase) (Fig. 5a). As expected, the characteristic hepatocellular damage and regeneration response abated considerably when the animals were recovered (Supplementary Fig. 4a-4d). Notably, ESRP2 displayed a dynamic expression pattern during the injury and recovery phases of liver regeneration. ESRP2 protein levels decreased considerably when mice were fed DDC diet but were fully restored upon toxin removal (Fig. 5b). Also, the downregulation occurred relatively early as ESRP2 protein levels started to decline within five days of DDC administration (Supplementary Fig. 4e).
Figure 5. ESRP2 downregulation supports hepatocyte proliferation during liver regeneration.
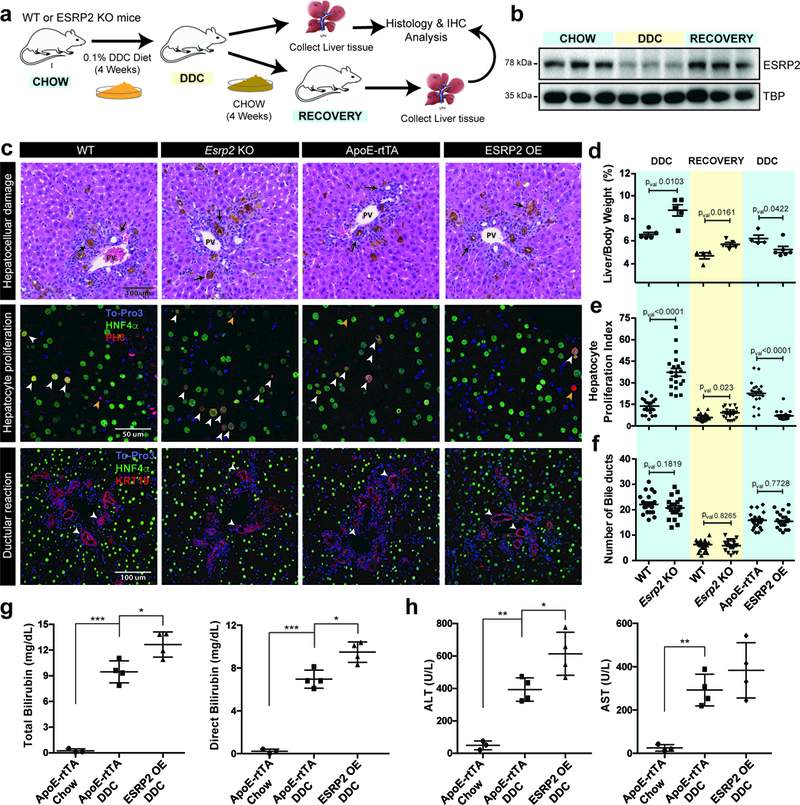
a,Experimental schematic for DDC-induced injury and recovery protocol. b, Western blots showing reversible changes in ESRP2 protein levels during DDC injury and recovery phases, n=3 animals/group, all blots repeated independently at least 3 times. c, Representative histological (H&E) and immunofluorescence (IF) images of livers from wildtype (WT, n=5 animals, DDC and n=4, recovery), Esrp2 knockout (KO, n=5, DDC and n=5, recovery), ESRP2 overexpression (OE, n=4, DDC), and Dox-induced littermate control ApoE-rtTA mice (n=6) subjected to 4-week DDC-injury. First row: black arrows indicate bile lakes and inflammation. PV: portal vein. Second row: white arrows indicate hepatocyte nuclei co-stained with Hnf4α and p-Histone3, and orange arrows indicate non-hepatocyte nuclei stained for p-Histone3 only. Third row: white arrows indicate bile ducts (KRT19, red). d, Liver-to-body weight ratios (hepatosomatic index), e, quantification of p-Histone3 and Hnf4α co-stained nuclei (hepatocyte proliferation index), and f, quantification of number of bile ducts/field (ductular reaction) under injury and recovery conditions. In (e) & (f), each point indicates the value for a single field of view in the section (n = 5 fields/animal). Biological sample size for (d, e, f) are same as provided in (c). g, Total and direct serum bilirubin, and h, ALT, AST levels in WT, ESRP2 OE and littermate control mice after 4-week DDC-injury (n = 4 animals/group). Data are mean ± s.d. *p<0.05, **p<0.01, and ***p<0.001 from unpaired two-tailed t-test with Welch’s correction was used for statistical testing.
To evaluate the physiological relevance of ESRP2 downregulation in liver regeneration, we used Esrp2 knockout (KO) mice. The mice lacking ESRP2 have relatively normal growth and are fertile, but their hepatocytes are immature, smaller in size, and a significant number fail to fully exit the cell-cycle 19. Adult littermates of WT and Esrp2 KOs mice were subjected to the same DDC injury-recovery protocol (Fig. 5a). While the liver damage (necrosis, inflammation, and presence of porphyrin plugs) and systemic symptoms (weight loss and jaundice) after DDC treatment were comparable between WT and Esrp2 KOs (Fig. 5c top row), the hepatosomatic index (liver/body weight ratio) of the KOs was substantially higher under both injury and recovery conditions (Fig. 5d). We reasoned that higher hepatosomatic index in the absence of ESRP2 might be due to excessive hepatocyte proliferation during the injury-recovery circumstances. We quantified the number of proliferating hepatocytes by co-immunostaining the DDC-injured and recovered liver sections from WT and Esrp2 KOs with the mitotic marker PH3 and the hepatocyte marker Hnf4-α. We detected significantly more PH3+ proliferating cells among Hnf4-α+ cells in Esrp2 KOs compared to WT mice under both injury and recovery conditions (Fig. 5c middle row and 5e). Quantification of the ductular reaction (KRT19+ cholangiocytes) throughout the injury-recovery circumstances, however, showed no difference between WT and Esrp2 KO livers (Fig. 5c bottom row and Fig. 5f).
To further investigate whether ESRP2 downregulation is required for hepatocyte proliferation, we generated tetracycline-inducible, hepatocyte-specific FLAG-tagged ESRP2 transgenic mice (Supplementary Fig. 5a). As anticipated, the TRE-ESRP2; ApoE-rtTA bitransgenics, hereafter referred to as ESRP2 OE mice, allowed conditional, Dox-dependent expression of ESRP2 (Supplementary Fig. 5b). We titrated the dose of Dox needed in the diet to restore ESRP2 protein expression in DDC-injured livers (Supplementary Fig. 5c and 5d). Remarkably, sustaining higher ESRP2 protein levels inhibited the increase in liver mass typically observed in response to DDC injury (Fig. 5d). Consistent with this observation, we witnessed a significant block in hepatocyte proliferation as revealed by the reduced number of PH3+ and Hnf4-α+ cells in ESRP2 OE mouse livers following injury when compared to uninduced littermate controls (Fig. 5c middle row and Fig. 5e). Maintaining high ESRP2 protein levels, however, had little effect on overall ductal hyperplasia (Fig. 5c bottom row, and 5f). Next, we performed serum biochemical tests to measure the extent of liver function and hepatocellular damage in DDC-fed control and ESRP2 OE mice. Both total and direct serum bilirubin and ALT levels were significantly elevated in ESRP2 OE mice when compared with littermate controls (Fig. 5g and 5h) indicating that impaired hepatocyte proliferation following injury compromises their liver function. Collectively, these data provide compelling evidence that downregulation of ESRP2 supports the proliferative capacity of hepatocytes in response to chronic liver injury.
ESRP2 downregulation generates neonatal isoforms of Hippo pathway proteins
We next examined whether ESRP-binding motifs are overrepresented near alternative exons that undergo a robust change in splicing upon liver injury. We found that UGG-rich ESRP2 motifs 32, UGGUG and UUGGG, are significantly enriched (blue line) in the upstream intron of exons that exhibit enhanced inclusion in response to DDC injury (Fig. 6a). The ESRP motif UUGGG was also enriched in the downstream introns of exons (red line) that are repressed upon injury (Fig. 6a). These observations corroborate with ESRP2 downregulation in regenerating hepatocytes and the typical ESRP RNA map where the upstream binding represses and the downstream binding promotes alternative exon inclusion 33,34.
Figure 6. ESRP2 downregulation reprograms alternative splicing to generate neonatal isoforms of Hippo pathway proteins. a.
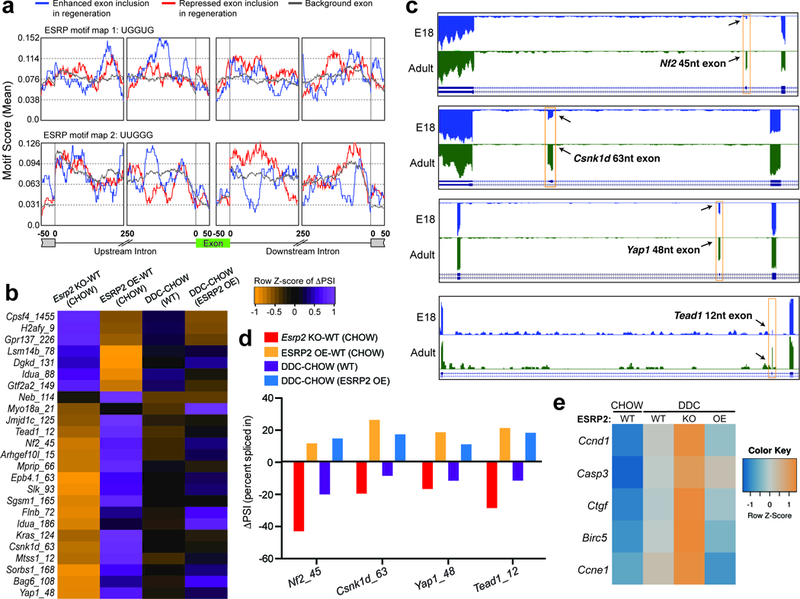
a,Position and relative enrichment of ESRP2 binding motifs within exonic and 250nt intronic sequences surrounding the regeneration-regulated exons. b, Heatmap of differences in RT-PCR derived exon inclusion (row-normalized, ΔPSI) values in WT, Esrp2KO and ESRP2 overexpression (OE) livers under CHOW and DDC conditions (n=3). Numeral after gene name signifies the size of alternative exon. c, Genome browser views of RNA-seq data from E18 and adult mouse hepatocytes demonstrating developmental regulation of alternative exons in Hippo pathway genes-Nf2, Csnk1d, Yap1 and Tead1 (n= 2 biological replicates). d, Difference in Percent Spliced Index (ΔPSI) values for Nf2, Csnk1d, Yap1 and Tead1 alternative exons (n=3), and e, Heatmap of relative expression for Hippo target genes (qPCR) in WT, Esrp2KO and ESRP2 OE livers under CHOW and DDC conditions (n=3).
To assess the functional impact of ESRP2 downregulation in reprogramming alternative splicing, we used RT-PCR to screen the top twenty-five ESRP2-sensitive exons—obtained from Bhate et al. 19—in the livers of Esrp2 KO, ESRP2 OE, and littermate control mice fed either CHOW or DDC diet. These exons showed a reciprocal switch in splicing in Esrp2 KO and OE when compared with WT mice (Fig. 6b). The gel images of RT-PCR products from two representative examples—Arhgef101 15nt exon and Lsm14b 78nt exon—are shown inSupplementary Fig. 6a. Consistent with reduced ESRP2 protein expression following injury, splicing in the DDC-fed WT and CHOW-fed Esrp2 KO mice were highly correlated in both pattern and directionality. Strikingly, sustaining ESRP2 protein levels blocked the injury-induced shift in splicing indicating ESRP2 downregulation is key for stimulating these splicing transitions (Fig. 6b and Supplementary Fig. 6a).
Among ESRP2 splicing targets, we found several genes involved in cell proliferation including core components of the Hippo signaling pathway such as Neurofibromatosis 2 (Nf2), Casein kinase 1 delta (Csnk1d), Yes-associated protein 1 (Yap1) and Tea domain transcription factor 1 (Tead1) (Fig. 6b). Hippo signaling is a conserved pathway that governs organ size, tissue homeostasis, and regeneration in metazoans, and its deregulation results in uncontrolled cell proliferation and malignant transformation 35–37. Furthermore, Hippo signaling is required for maintaining the differentiated state of hepatocytes and serves essential roles for cell fate determination in normal and regenerating livers 38–41.
When Hippo signaling is on, NF2 acts as an upstream activator of the MST1/2-WW45 complex, which phosphorylates and activates LATS1/2 kinases (Supplementary Fig. 6b). Activated LATS1/2 phosphorylate YAP1 to sequester it in the cytoplasm by 14–3-3 proteins, or primes it for additional phosphorylation by CSNK1D, which promotes β-TrCP-mediated degradation of YAP1. Upon inactivation of Hippo signaling, YAP1 accumulates in the nucleus and partners with TEAD family of transcriptional factors, stimulating expression of pro-proliferative genes. Interestingly, Nf2, Csnk1d, Yap1, and Tead1 each encode a conserved developmentally regulated exon that is predominantly skipped in neonatal but included in the adult hepatocytes (Fig. 6c). We found that ESRP2 coordinates the postnatal inclusion of these in-frame exons to generate adult protein isoforms. ESRP2 deletion promoted their skipping, and therefore, production of neonatal isoforms in the adult liver, whereas ESRP2 OE enhanced the production of adult isoforms (Fig. 6d and Supplementary Fig. 6c). The presence of nearby ESRP2 binding sites along with skipping of all four exons following transient depletion of ESRP2 in cultured hepatocytes further confirmed ESRP2 as their primary regulator (Supplementary Fig. 6d, 6e and 6f). Importantly, similar to Esrp2 KOs, DDC-injury in WT mice evoked an adult-to-neonatal shift in splicing whereas sustaining ESRP2 expression during injury preserved the adult splicing pattern for all four genes (Fig. 6d and Supplementary Fig. 6c). As was previously reported 42–44, liver injury inhibited the Hippo pathway and upregulated the expression of its gene targets (Fig. 6e). Notably, the injury-induced upregulation of target genes was considerably higher in Esrp2 KOs, which was largely blunted upon ESRP2 OE (Fig. 6e). Together, these data reveal that ESRP2 downregulation following injury reprograms the splicing of core Hippo pathway components likely modulating their signaling and downstream gene expression activity.
Neonatal isoforms attenuate Hippo signaling and promote hepatocyte proliferation
We next explored the functional differences between neonatal and adult protein isoforms of NF2, CSNK1D, YAP1, and TEAD1.
The neonatal NF2 protein isoform exists in two functionally distinct conformations 45,46. In the open and active form, the LATS1/2 binding site is freely accessible, and thus Hippo signaling is enabled (Fig. 7a, panel 1). In the closed and inactive form, the C-terminal domain (CTD) binds to the N-terminal FERM domain and blocks access to the LATS1/2 binding site, thereby inhibiting Hippo signaling. The adult NF2 protein isoform, however, includes a 45nt exon at the end of CTD, which encodes an early STOP codon resulting in truncation of five amino acid residues, four of which are necessary for FERM binding (Fig. 7a, panel 1). The alternative exon also alters the composition of eleven other amino acids from primarily hydrophobic to charged residues, which are expected to create a repulsive force between the CTD and the hydrophobic binding pockets in the FERM domain 46. Thus, the adult NF2 isoform likely adopts a constitutively open state providing uninterrupted access to LATS1/2 thereby promoting YAP phosphorylation and degradation.
Figure 7. Exclusive production of neonatal protein isoforms attenuates Hippo signaling, activates gene expression, and promotes hepatocyte proliferation.
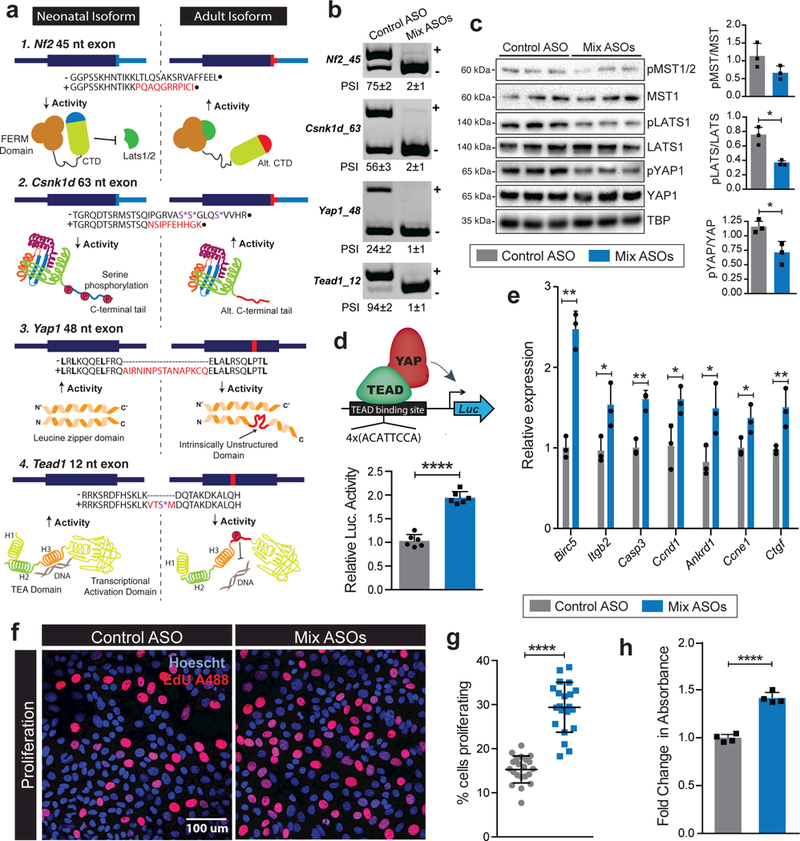
a,Cartoons representing the impact of alternative exons on structure, activity and function of core Hippo pathway proteins: NF2, CSNK1D, YAP1 and TEAD1. Red bar shows the relative location of alternative exon within individual transcripts. (−) and (+) signs show exclusion (neonatal) and inclusion (adult) isoform amino acid (AA) sequences. The AA sequences encoded by alternative exons are indicated in red. Residues highlighted with purple asterisk can be phosphorylated under specific conditions. Red regions within adult protein cartoons signify the location of peptide segment encoded by respective alternative exons. b, Simultaneous skipping of Nf2, Csnk1d, Yap1 and Tead1 alternative exons in AML12 cells after treatment with a mixture of antisense oligonucleotides (ASOs). The band corresponding to (+) indicate exon inclusion and (−) indicate exon skipping. c, Western blots of core Hippo pathway proteins and their phosphorylated forms, and quantification of phosphorylated to total protein ratios in AML12 cells following treatment with control or mixture of Hippo targeting ASOs (n=3). d, Schematic (top) and relative luciferase activity (bottom) derived from the TEAD reporter construct transfected in AML12 cells following treatment with control or mixture of Hippo targeting ASOs. All values (mean ± s.d) were normalized to β-galactosidase activity produced from a co-transfected control plasmid (n=6). e, Relative mRNA expression of indicated Hippo target genes normalized to Tbp (qPCR, ), f-g, representative images (f) and quantification (g) of EdU labeling, and h, MTT assay based quantification of AML12 cell proliferation following treatment with control or mixture of Hippo targeted ASOs (n=6). Data are mean ± s.d; *p<0.05, **p<0.01, and ****p<0.0001 from unpaired two-tailed t-test. All uncropped gel images are provided in Supplementary data set 1.
The neonatal CSNK1D protein isoform encodes a C-terminal tail containing a stretch of serine residues (Fig. 7a, panel 2), which when phosphorylated lower its enzymatic activity 47. Elimination of these auto-inhibitory phosphorylation sites through truncation or site-directed mutagenesis enhances the CSNK1D kinase activity towards its substrates 47–49. The adult CSNK1D protein isoform includes a 63nt exon in the C-terminal tail, which, like NF2, encodes an early STOP codon truncating six amino acid residues (Fig. 7a, panel 2). Notably, this eliminates three serine residues in the adult CSNK1D isoform, which should relieve the auto-inhibition and thus generate a more active kinase for YAP phosphorylation and degradation.
YAP1 encodes a leucine zipper within its transcription activation domain that is important for protein-protein interactions. The neonatal YAP1 isoform has an intact leucine zipper with four heptads; however, the inclusion of 48nt exon in the adult YAP1 isoform inserts a sixteen amino acid-long intrinsically unstructured segment between heptad H3 and H4, leading to its thermodynamic destabilization (Fig. 7a, panel 3). Consequently, the inability of the adult YAP1 protein isoform to form a functional leucine zipper is expected to hinder the protein-protein interactions needed for its hetero-association with other cellular partners 50–52.
TEAD proteins share a highly conserved N-terminal TEA domain that binds to DNA and a C-terminal transactivation domain, which binds the cofactor YAP1 to induce target gene expression 53. The TEA domain is composed of a three helix-bundle, where the H3 helix provides the interface for DNA binding 54. The 12nt microexon in the adult TEAD1 protein isoform adds four amino acids just downstream of the DNA binding helix H3 (Fig. 7a, panel 4). Amongst these four amino acids is a conserved serine residue, which when phosphorylated by Protein kinase A or C strongly inhibits TEAD1’s DNA-binding ability 55,56. Thus, inclusion of this microexon should serve as an alternate mechanism for reducing TEAD1 activity independent of its interaction with co-activators such as YAP1.
Taken together, the developmentally regulated exons introduce functionally relevant protein segments in NF2, CSNK1D, YAP1, and TEAD1 that appear to enhance Hippo signaling and thereby allow adult hepatocytes to enter quiescence. Given that ESRP2 promotes the inclusion of these alternative exons, we reasoned that ESRP2’s influence on hepatocyte proliferation upon injury might be driven in part by the production of neonatal isoforms of Hippo signaling pathway. We therefore decided to simultaneously redirect splicing of all four exons in AML12 cells (Supplementary Fig. 7a), a non-transformed mouse cell line that exhibits differentiated hepatocyte features and expresses high levels of hepatic mRNAs 57. Serum starvation-induced quiescence in AML12 cells led to high inclusion of NF2 and Tead1 alternative exons and moderate inclusion of Csnk1d and Yap1 alternative exons. This observation allowed us to gauge the combined effect of these exons on Hippo signaling and proliferative capacity of cultured hepatocytes. Compared to control ASOs, AML12 cells treated with a mixture of NF2, Csnk1d, Yap1 and Tead1 targeted ASOs elicited a near-complete switch to the exon-skipped neonatal isoforms (Fig. 7b). Three non-targeted alternative exons were tested as control and all were unaffected demonstrating absence of non-specific effects (Supplementary Fig. 7b). Also, the steady-state mRNA levels of Nf2, Csnk1d, Yap1, and Tead1 were unaltered after ASO treatment, confirming that the switch in splicing occurred without a change in total mRNA levels (Supplementary Fig. 7c).
To determine if redirection of splicing affected the output of Hippo signaling pathway, we first evaluated the phosphorylation status of key serine/threonine residues within mouse MST1/2 (T183/T180), LATS1 (S958) and YAP1 (S112) that are known to restrict YAP/TEAD mediated gene transcription 58. Consistent with our hypothesis, selective expression of neonatal splice isoforms led to a significant decrease in the ratio of pLATS1/LATS1 and pYAP1/YAP1 but not pMST/MST proteins (Fig. 7c). Next, we transfected the control and ASO mix treated AML12 cells with a luciferase reporter construct containing TEAD binding sites 59 (Fig. 7d, top). The luciferase activity from the TEAD reporter was significantly higher in AML12 cells expressing the neonatal isoforms (Fig. 7d, bottom). Furthermore, compared with control, ChIP analysis from ASO mix treated cells showed increased TEAD1 association with its response element on the target Birc5 promoter but not with the non-target Hnf4α promoter (Supplementary Fig. 7d). Additionally, we noted that, when neonatal isoforms were predominantly expressed, Hippo target genes showed an increase in their endogenous expression (Fig. 7e). We next evaluated the functionality of splicing redirection on cellular proliferation. Serum-starved AML12 cells treated with either control or the ASO mix were released in minimal serum (0.5–1%) for 24h followed by a 2hr pulse with EdU. Remarkably, exclusive production of the neonatal isoforms resulted in markedly higher EdU incorporation (Fig. 7f and 7g), and this enhancement of proliferation was further confirmed by MTT assays (Fig. 7h). Importantly, the enhanced proliferation following splicing redirection was completely abolished in YAP1 depleted cells (Supplementary Fig. 7e and 7f). Collectively, these data illustrate that production of neonatal isoforms abates Hippo signaling, which enables greater transcriptional activation of YAP1/TEAD1 target genes promoting hepatocyte proliferation.
DISCUSSION
How changes in the transcriptome and/or translatome influence the proliferative capacity of hepatocytes upon injury and how posttranscriptional gene regulatory mechanisms integrate into these paradigms are still unresolved questions. In this study, we uncovered that dynamic remodeling of mRNA splicing and translation programs is critical for hepatocyte proliferation in response to chronic liver injury. Our work further revealed that dynamic regulation of ESRP2 coordinates the adult-to-neonatal splicing switch of many proliferation-related genes including core components of the Hippo signaling pathway, which may constitute a fundamental mechanism used by hepatocytes to adapt to injury. Importantly, we identified that ESRP2 controls the splicing of developmentally regulated exons in NF2, CSNK1D, YAP1, and TEAD1 to introduce functionally relevant protein segments that enhance Hippo signaling. We found that, in comparison to the adult, the neonatal Hippo splice isoforms have innately lower signaling capacity, which allows higher transcriptional activity of the downstream YAP1 and TEAD1 effectors, thereby sustaining hepatocyte proliferation during the fetal and early postnatal periods of development. After birth, ESRP2 protein levels rise in hepatocytes 19 to promote the generation of adult Hippo isoforms that favor quiescence. We also showed that, following injury, ESRP2 downregulation reactivates a neonatal splicing program to rewire the Hippo signaling pathway and enable quiescent hepatocytes to proliferate. Accordingly, we demonstrated that Esrp2 knockout mice manifest excessive hepatocyte proliferation upon injury, whereas sustaining high ESRP2 expression during toxin exposure inhibits hepatocyte proliferation by impeding the formation of neonatal splice isoforms of Hippo signaling pathway. In the future, it will be important to develop isoform-specific antibodies and/or mass-spectrometry based methods to generate reliable, quantitative measurements of alternatively spliced Hippo pathway proteoforms and further interrogate their biological significance.
In conclusion, we have identified a novel ESRP2-Hippo pathway alternative-splicing axis that tunes hepatocyte proliferation and facilitates regeneration in response to chronic liver injury. It remains to be seen if this axis is also utilized to regenerate after acute liver injuries such as partial hepatectomy and whether this axis can be therapeutically harnessed to stimulate regeneration during acute liver failure or end-stage liver disease.
ONLINE METHODS
Animal models
National Institutes of Health (NIH) and institutional guidelines were followed in use and care of laboratory animals and experimental protocols were performed as approved by Institutional Animal Care and Use Committee (IACUC) at UIUC. Animals used in the study were identified using ear tags after being genotyped at weaning age. The following study is not gender-specific and specimens include both male and female animals. Whole liver tissues and hepatocytes were isolated from mice following guidelines for euthanization and/or anesthesia.
FVB/NJ mice strain was used primarily for all experiments including RNA sequencing, RNA isolation, histology, western blotting and polysome profiling. For ESRP2 loss of function studies, ESRP2 (−/−) and ESRP2 (+/+) animals with a C57BL/6J background were used as described previously 19,33. For Gain of function studies, mouse ESRP2 cDNA containing a N-terminus 1x FLAG-tag was expressed from a transgene with a TRE/minimal CMV promoter, Esrp2 ORF and Bovine growth hormone polyadenylation site and 3’ flanking genomic segment for mRNA 3’ end formation. The linearized transgene construct was subjected to pronuclear injection using standard methods to generate TRE-Esrp2 transgenic mice that were maintained on a C57BL/6J background. ApoE-rtTA transgenic mice expressing a rtTA variant specifically in hepatocytes were obtained courtesy of Dr. D. Pan (Univ. of Texas Southwestern Medical center) 60. All mice reported in this study were F1 progeny of TRE-Esrp2 and ApoE-rtTA transgenic mice mating, and always hemizygous for both transgenes, and the ApoE-rtTA transgene.
Murine diet scheme
For toxin-mediated liver injury, FVB/NJ strain of mice at 8–10 weeks of age was used. For all experiments the mice were fed a diet containing 0.1% 3,5-diethoxycarbonyl-1,4-dihydrocollidine (DDC) (Teklad Envigo) for 4 weeks, unless mentioned otherwise. Additionally, for the purposes of ESRP2 gain of function studies, mice were fed a mixed diet containing 0.5–2.0 g/kg Doxycycline in addition to 0.1% DDC for 4 weeks (Teklad, Envigo).
Isolation of neonatal and adult hepatocytes
Hepatocytes from normal and DDC-fed mice livers were isolated using adapted protocols from previously described methods 61. Briefly, adult FVB mice were anesthetized in a chamber supplied with Isoflurane and Oxygen (2.5% Isoflurane in oxygen, 1L/min), and maintained on the anesthetic during the procedure. The liver was perfused via cannulation of the portal vein with 50 mL of Solution A (1x HBSS (w/o Ca2+ and Mg2+), 0.5 mM EDTA) followed by 50 mL of Solution B (1x HBSS (w/ Ca2+), 5.4 mM CaCl2, 0.04 mg/mL Soybean Trypsin Inhibitor, and 4500 Units of Collagenase type I (Worthington Chemicals)). Subsequently, the liver was massaged in a petridish containing 1x HBSS to release cells from the liver capsule, and then the cell suspension was passed successively through and 70 and 40 μm filters to obtain single cell suspension. The cells were then centrifuged at 50 x g for 5 min (4oC) to separate live hepatocytes from Non-parenchymal cells (NPCs) and dead cells. The cells were further washed 3 times in 1x HBSS as above, and then flash frozen in liquid N2 and stored at −80oC till further use.
RNA sequencing analysis
RNA was isolated from experiment specific hepatocytes using RNeasy tissue mini-kit (Qiagen). Downstream RNA quality was assessed using an Agilent Bioanalyzer, and quantified using a Qubit Fluorometer by the Functional Genomics Core at the Roy J. Carver Biotechnology Center, UIUC. Hi-Seq libraries were prepared, and 100 bp paired-end Illumina sequencing was performed on a HiSeq 4000 at the High Throughput Sequencing and Genotyping Unit, UIUC. RNAseq reads were processed for quality and read length filters using Trimmomatic (version 0.38) 62. RNAseq reads were further aligned to the mouse genome (mm10) using STAR (version 2.4.2a) 63. Mapping percentage and sample details are provided in respective table. Gene expression levels were determined as Transcript per million (TPM) using count and differential expression values obtained from DESeq2 (version 1.8.2), and HTseq (version 0.6.1) 64,65. Genes were considered as having significant differential expression following imposed cutoff clearance (False Discovery rate (FDR) < 0.05, |Log2 (Fold Change)| > 1). Differential splicing analysis was performed using rMATS (version 3.2.5), and significant events were identified using imposed cutoffs (FDR < 0.10, Junction read counts ≥ 10, Percent Spliced Index ≥ 15%) 66. Motif analysis for differentially spliced exons was performed using rMAPS with default parameters, and putative motifs as described previously 19,67. Gene ontology analysis was performed using DAVID (version 6.8) 68, and mapped using “Enrichment Maps” plugin in Cytoscape. All expressed genes with Transcript per million (TPM) >1 served as background, and the biological function (BP) category was analyzed with three pathways (Biocarta, Kegg, and Panther). Functional clustering was performed and top clusters (p-value < 0.05) represented. For grouping genes into clusters, we first overlapped the differentially expressed gene sets (False Discovery rate (FDR) < 0.05, |Log2 (Fold Change)| > 1) between regeneration (Adult DDC-Chow) and development (E18-Adult Chow) categories. The overlapping and non-overlapping gene sets were then grouped and their corresponding average fold change relative to the E18 timepoint was calculated and plotted.
Custom scripts were used to perform metagene analysis to determine the spatial distribution of differentially spliced exons along their associated transcript. Specifically, genomic coordinates of the alternative and flanking exons provided by the rMATS output were utilized to map the event to all annotated transcripts in the GRCm38.p4 gene annotation GFF3 file available from GENCODE. For this analysis, of all the possible annotations, the longest protein-coding mRNAs was used to calculate the spatial distribution. Depending on the type of alternative exon, further processing was performed to obtain the alternating region that varied between the exon included and excluded variants. Next, the events were separated based on the locations the alternative regions mapped to on the mRNA; CDS, 5’ prime UTR and 3’ UTR. Each of these three regions were scaled to an arbitrary unit of 1.0 which was then separated into 20 equal sized bins. Next, each bin was given a count of 1 if a mapped alternative region overlapped within the bin region. Using these count values, the normalized frequency distribution was calculated and scaled with respect to the peak bin across all three mRNA regions.
Additionally, to perform the exon ontology analysis, the spliced exons regulated in regeneration obtained from the above analysis were used. The coordinated of these mm10 annotated mouse exons, were converted to corresponding human exons in the hg19 annotation using UCSCliftover with minimum ratio of bases matching as 0.8. Additionally, the exons in hg19 reported by UCSCliftover were checked for gene identity match to the mouse exon’s parent gene. These exons were then analyzed for ontology using the exon ontology, and FasterDB packages 69.
Polysome gradient fractionation
Mice on normal CHOW and 0.1% DDC diet as described before were used for polysome fractionation from hepatocytes. A modified perfusion protocol was developed wherein the animals were firstly perfused via portal vein cannulation with 75mL of Solution I (300 ug/mL Cycloheximide in 1x HBSS (w/ phenol red)) at rate of 3.5 mL/min. EDTA was excluded from Solution I due to its dissociative effects on ribosomes and associated complexes. Instead, liver perfusion and hepatocyte wash buffers were supplemented with Cycloheximide (300 ug/mL) to arrest translating ribosomes 70.
Purified hepatocytes were thawed in polysome lysis buffer (10 mM Tris-HCl at pH 8.0, 150 mM NaCl, 5 mM MgCl2, 1 mg/mL heparin, 1% Nonidet-P40, .5% deoxycholate, 40 mM dithiothreitol, 1 U/mL SUPERaseIn RNase inhibitor [Thermo Fisher], and 150 µg/mL cycloheximide) and lysed by pipetting gently 10 times. The cell nuclei and cell debris were removed by centrifugation (12,000g, 1 min, at 4°C). The supernatant was transferred to a fresh tube and then centrifuged again to remove remaining cell debris and organelles (16,000g, 7.5 min, at 4°C). The resulting supernatant was transferred to a fresh tube and 400 µL of supernatant was layered onto a 10 mL linear sucrose gradient (15%–45% sucrose [w/v] made using a Biocomp Gradient Master) and centrifuged in a SW41Ti rotor (Beckman) for 125 min at 38,000 rpm and 4°C, as previously described 71. Polysome profiles were recorded using a UA-6 absorbance (ISCO) detector at 254 nm and fractions were collected along the gradient corresponding to the RNP, monosome, light polysomes (2–4 ribosomes), and heavy polysomes (5+ ribosomes).
RNA for downstream sequencing and validations was purified using an adapted protocol 72. The sucrose gradient fractions were mixed with 0.05 volume of 3 M Sodium Acetate, and 2 uL Glycogen followed by addition of 2 volumes of 100% EtOH and stored at −80 C overnight to precipitate RNA/protein. The pellet was suspended in Molecular Grade water, and post DNase digestion, the sample was phase separated using 3 volumes of Acid phenol: Chloroform (5:1). The aqueous phase was again phase separated using Chloroform: Isoamyl Alcohol (24:1). Following this the aqueous phase was mixed with 0.1 volume 3 M Sodium Acetate and 2 uL glycogen, and precipitated with 2.5 volumes EtOH overnight at −80 C. The pelleted RNA was then used for downstream polyA+ selected deep sequencing or qPCR as previously described 71.
Analysis of polyribosome sequencing
Reads were checked for quality using FastQC software, and biological replicate were checked for reproducibility using spearman correlation coefficients. Reads were mapped to mm10 genome using STAR 63. Transcript count abundances were estimated and normalized across conditions using Cuffnorm 73, and the Cuffnorm calculated FPKM for individual transcripts were converted to transcript per million (TPM) using the following 74;
TPM values were averaged across biological duplicates for all three pools of monosome (M), light (LP) and heavy (HP) polysome fractions. Transcript shift across polysomal fractions was developed based on previous described methodology 21. Using the TPM values, an index was calculated called polysome fraction index (PFI) as follows:
Further, to calculate the shift in transcript distribution in a fraction between two conditions, a polysome shift ratio was calculated as follows for all fractions separately;
To test whether a calculated PSR value for a given transcript is significantly changing between conditions, a null set was generated using the sequencing data from the CHOW samples. CHOW specific fastq sequence files were randomly partitioned into two separate, and non-overlapping subsets to generate a null comparison. Transcript PSR values calculated from these partitions resulted in a normal distribution (μ∼0, and σ>0). With the empirical null distribution, p-values were calculated for all fraction specific transcript PSRs using the Student’s t-test (cutoff p<0.01). Additionally, False discovery rates (FDR) values were calculated using the Benjamini-Hochberg method, and significance was deemed as FDR<0.05. Finally, transcripts with significant PSR values, based on abovementioned cutoffs, in at least two fractions were considered to be significantly regulated. Clustering of transcripts was performed using heatmap.2 package in R, with the ward clustering method.
Histology, and Immunofluorescence staining
Post harvesting, tissues were fixed in 10% buffered Formalin for 24 hours, and then processed to be embedded in paraffin. 5 μm tissue sections were cut, and deparaffinized in Xylene and moved through serial alcohol (100, 95, 80, 50%) washes to rehydrate. For H&E staining, sections were washed in Haematoxylin (2 min) and Eosin (1 min) successively, coverslipped with permount medium, and imaged on Hamamatsu Nanozoomer at IGB core facility, UIUC. For Immunofluorescent staining, deparaffinized and rehydrated sections were antigen retrieved in a slow cooker at 120oC for 10 minutes. The retrieval was performed in either TE (Tris-EDTA pH 8.0) or citrate buffer (10 mM Sodium citrate, 0.05% Tween 20, pH 6.0). The sections were then washed in buffer A (TBS + 0.05% Triton X-100), and blocked (2 h) in 10% Normal Goat Serum (NGS) and 1% BSA at room temperature (RT). The 1o antibodies were applied to the sections at standardized concentrations and incubated overnight at 4oC. Following this, the sections were washed in buffer A, and 2o fluorescent antibodies applied for 1 hour at RT. Lastly, ToPro Nuclear stain applied for 15 minutes at RT. The sections were then cover slipped using CC aqueous mounting media. All sections were imaged on a Zeiss LSM 710 microscope at IGB core facility, UIUC. All antibodies used and respective dilutions are listed in Supplementary Table 2.
To stain for nascent DNA synthesis in regenerating livers, normal CHOW and 0.1% DDC fed mice (4-week treatment) were treated with a 4-hour pulse of EdU (5-ethynyl-2’-deoxyuridine) administered intra-peritoneal (I.P) (100 μg/g of body weight). Mice were then sacrificed, and livers were harvested and paraffin embedded. 5 μm sections were deparaffinized and rehydrated, and then antigen retrieved in citrate buffer (10 mM Sodium citrate, 0.05% Tween 20, pH 6.0). The sections were then washed in buffer A (TBS + 0.05% Triton X-100), and blocked (2 h) in 10% Normal Goat Serum (NGS) and 1% BSA at room temperature (RT). EdU labelled DNA was stained with Alexa Fluor 488 using Click-iT EdU Alexa Fluor kit (Thermo Fisher) as per manufacturer’s protocol. Following this, the abovementioned protocol for IF was followed to stain for Hnf4-α nuclear receptor and ToPro nuclear stain.
Protein isolation and western blot analysis
Protein isolation was performed on frozen liver tissue or isolated hepatocyte fractions using homogenization in bullet blender followed by sonication. Homogenization buffer (10 mM HEPES-KOH, pH 7.5, 0.32 M sucrose, 5 μM MG132, 5 mM EDTA, and Pierce proteinase inhibitor tablet (1 tablet/ 20 mL buffer volume) was used to perform the above mentioned isolation. Prior to sonication 20% Sodium Dodecyl sulfate (SDS) to a final concentration of 1% (v/v) was added. Protein concentration was measured using Thermo scientific BCA assay kit. Approximately 50 μg of total protein sample was loaded onto a 10% SDS-PAGE gel, and then transferred onto a PVDF membrane. Membranes were visualized for equal loading using Ponceau (PonS) staining solution (0.5% w/v PonS, 1% Acetic acid). Membranes were blocked using 5% milk powder (w/v) in TBST (Tris-buffered saline, 0.1% Tween 20) for 2 hours at RT. Blots were incubated in primary (10) antibodies at pre-determined concentrations overnight at 4 C. Blots were washed in TBST, and then incubated in HRP conjugated secondary (20) antibodies for 1 hour at RT. Blots were developed using Clarity Western ECL kit (BioRad). All antibodies used and respective dilutions are listed in Supplementary Table 2.
Gene expression and splice isoform analysis
Total RNA from mouse livers and hepatocytes was isolated using either RNeasy kit (Qiagen) or TRIzol reagent (Life Tech). Following DNase I treatment, 5 μg of RNA was reverse transcribed to cDNA using random hexamers and Maxima Reverse transcriptase kit (Thermo Scientific). The cDNA was diluted to a final concentration of 25 ng/μL to be used downstream for quantitative real time PCR (q-PCR) or RT-PCR based alternative splicing assays as described previously 75. Downstream analyses for PSI and log2 fold change calculations were performed as described previously. All primers used for alternative splicing and qPCR are listed in Supplementary Table 3.
Cell culture and transfections
All assays were performed in AML12 cells (mycoplasma free) obtained from and authenticated by ATCC. Antisense morpholino oligonucleotides (ASOs) for alternative exons were designed and ordered from Gene Tools Inc., and ASO sequences are provided in Supplementary Table 3. Cells were cultured in 96 and 12 well formats, and were serum starved for approx. 24 hours after plating, along with morpholino treatments. Post serum starvation, cells were released in reduced serum (0.5–1% FBS) for up to 48 hours. Cell proliferation assays were performed using commercial Non-radioactive MTT assay kit (Promega). To label for nascent DNA synthesis, Click-iT EdU Alexa Fluor 488 kit (Thermo Fisher) was used wherein cells were pulsed with 10 μM of EdU in cell culture media for 2 hours. To stain for positive nuclei standard protocol from manufacturer was used followed by counterstaining with ToPro nuclear stain. For knockdown experiments silencer select siRNAs against luciferase or Esrp2 (Thermo Fisher) and a pool of 4 siGenome siRNAs against Yap1 (Dharmacon) were purchased. Control or ASO mix treated AML12 cells were transfected with gene-specific siRNA oligos using RNAiMax (Thermo Fisher) and 24 to 48 hours after transfection, cells were lysed for RNA, protein and MTT assays.
Luciferase reporter and ChIP qPCR assays
Luciferase reporter assays were performed using TEAD reporter (8xGTIIC-luciferase, Addgene) and β-galactosidase vector constructs as described previously 75. Briefly, AML12 cells were transfected with reporter plasmids using Mirus TransIT X2 according to the manufacturer’s instructions. Twenty-four hours after transfection, cell extracts were assayed for luciferase expression using the luciferase assay kit (Promega). Relative reporter activities were calculated as luminescence units normalized for β-galactosidase expression. For ChIP experiments, the MAGnify Chromatin Immunoprecipitation system (Thermo Fisher) was used according to the manufacturer’s instructions with minor modifications. AML12 cells were grown to about 50% confluency, and then serum starved for 24 hours while being treated with control or Hippo-specific ASOs. The ASO treated cells were released in 1% FBS for an additional 24 hours and then fixed with 1% formaldehyde using the kit components. The crosslinking was stopped with glycine treatment at room temperature. After lysing 2–3 million fixed cells, the chromatin was isolated and sheared to 300–500 bp fragments using Covaris M220 sonicator with the recommended settings (df 5%, 28 minutes, 4oC). ChIP was performed using TEAD1 (5mg), RNA pol. II (2mg), and Mouse IgG (1mg) antibodies and the co-precipitated DNA fragments were analyzed by qPCR (PerfeCTa Green SYBR FastMix, Quanta Biosciences). The antibodies and primers used are listed in Supplementary Table 2 and 3 respectively.
Liver function tests
Whole blood from mice was collected via retro-orbital puncture in Capiject gel/clot activator tubes, centrifuged for 10 minutes at 1200g, and then stored at −80 C till further analysis. The serum chemistry tests used commercial kits according to the manufacturer’s instructions: Alanine aminotransferase (ALT), Aspartate aminotransferase (AST) (Infinity kits, Thermo scientific) and bilirubin (Sigma Aldrich)..
Statistical Analysis
All quantitative experiments (qPCR, western blots, cell proliferation) have at least three independent biological repeats. The results were expressed with mean and standard deviation, unless mentioned otherwise. Differences between groups were examined for statistical significance using unpaired t-test with Welch’s correction (for two groups), or one-way ANOVA for more than two groups using the GraphPad Prism 6 Software. P-value <0.05 was deemed significant.
Reporting Summary
Further information on experimental design is available in the Nature Research Reporting Summary linked to this article.
Data Availability
All raw RNA-seq and Polysome profiling data files are available for download from NCBI Gene Expression Omnibus (http://www.ncbi.nlm.nih.gov/geo/) under accession numbers GSE105944 and GSE106140. Source data for all figures are available with the paper online. All other data are available from the authors upon reasonable request.
Supplementary Material
ACKNOWLEDGEMENTS
We thank the members of the Kalsotra and Anakk laboratories for their valuable discussions and comments on the manuscript. This research was supported through NIH (R01HL126845) and March of Dimes (5-FY14–112) grants to A.K. and NIH (R01AI081710) to S.A. W.A. was supported by the NIH pre-doctoral NRSA fellowship (F30DK108567). J.S. was partly supported by NIH Chemistry–Biology Interface Training Grant (5T32-GM070421) and American Heart Association pre-doctoral fellowship (17PRE33670030). A.B. was partly supported by the Herbert E. Carter fellowship in Biochemistry, UIUC. Three cores at UIUC supported this project: Transgenic mouse facility Core, High-Throughput Sequencing and Genotyping Core and Histology and Microscopy core.
Footnotes
The authors declare no competing financial interests.
REFERENCES
- 1. Michalopoulos GK & DeFrances MC Liver regeneration. Science 276, 60–6 (1997). [DOI] [PubMed] [Google Scholar]
- 2. Taub R Liver regeneration: from myth to mechanism. Nat Rev Mol Cell Biol 5, 836–47 (2004). [DOI] [PubMed] [Google Scholar]
- 3. Michalopoulos GK Liver regeneration. J Cell Physiol 213, 286–300 (2007). [DOI] [PMC free article] [PubMed] [Google Scholar]
- 4. Forbes SJ & Newsome PN Liver regeneration - mechanisms and models to clinical application. Nat Rev Gastroenterol Hepatol 13, 473–85 (2016). [DOI] [PubMed] [Google Scholar]
- 5. Miyaoka Y et al. Hypertrophy and unconventional cell division of hepatocytes underlie liver regeneration. Curr Biol 22, 1166–75 (2012). [DOI] [PubMed] [Google Scholar]
- 6. Lu WY et al. Hepatic progenitor cells of biliary origin with liver repopulation capacity. Nat Cell Biol 17, 971–983 (2015). [DOI] [PMC free article] [PubMed] [Google Scholar]
- 7. Raven A et al. Cholangiocytes act as facultative liver stem cells during impaired hepatocyte regeneration. Nature 547, 350–354 (2017). [DOI] [PMC free article] [PubMed] [Google Scholar]
- 8. Miyajima A, Tanaka M & Itoh T Stem/progenitor cells in liver development, homeostasis, regeneration, and reprogramming. Cell Stem Cell 14, 561–74 (2014). [DOI] [PubMed] [Google Scholar]
- 9. Michalopoulos GK & Khan Z Liver Stem Cells: Experimental Findings and Implications for Human Liver Disease. Gastroenterology 149, 876–882 (2015). [DOI] [PMC free article] [PubMed] [Google Scholar]
- 10. Espanol-Suner R et al. Liver progenitor cells yield functional hepatocytes in response to chronic liver injury in mice. Gastroenterology 143, 1564–1575 e7 (2012). [DOI] [PubMed] [Google Scholar]
- 11. Malato Y et al. Fate tracing of mature hepatocytes in mouse liver homeostasis and regeneration. J Clin Invest 121, 4850–60 (2011). [DOI] [PMC free article] [PubMed] [Google Scholar]
- 12. Schaub JR, Malato Y, Gormond C & Willenbring H Evidence against a stem cell origin of new hepatocytes in a common mouse model of chronic liver injury. Cell Rep 8, 933–9 (2014). [DOI] [PMC free article] [PubMed] [Google Scholar]
- 13. Tarlow BD et al. Bipotential adult liver progenitors are derived from chronically injured mature hepatocytes. Cell Stem Cell 15, 605–18 (2014). [DOI] [PMC free article] [PubMed] [Google Scholar]
- 14. Yanger K et al. Adult hepatocytes are generated by self-duplication rather than stem cell differentiation. Cell Stem Cell 15, 340–349 (2014). [DOI] [PMC free article] [PubMed] [Google Scholar]
- 15. Jors S et al. Lineage fate of ductular reactions in liver injury and carcinogenesis. J Clin Invest 125, 2445–57 (2015). [DOI] [PMC free article] [PubMed] [Google Scholar]
- 16. Font-Burgada J et al. Hybrid Periportal Hepatocytes Regenerate the Injured Liver without Giving Rise to Cancer. Cell 162, 766–79 (2015). [DOI] [PMC free article] [PubMed] [Google Scholar]
- 17. Preisegger KH et al. Atypical ductular proliferation and its inhibition by transforming growth factor beta1 in the 3,5-diethoxycarbonyl-1,4-dihydrocollidine mouse model for chronic alcoholic liver disease. Lab Invest 79, 103–9 (1999). [PubMed] [Google Scholar]
- 18. Fickert P et al. A new xenobiotic-induced mouse model of sclerosing cholangitis and biliary fibrosis. Am J Pathol 171, 525–36 (2007). [DOI] [PMC free article] [PubMed] [Google Scholar]
- 19. Bhate A et al. ESRP2 controls an adult splicing programme in hepatocytes to support postnatal liver maturation. Nat Commun 6, 8768 (2015). [DOI] [PMC free article] [PubMed] [Google Scholar]
- 20. Young SK, Willy JA, Wu C, Sachs MS & Wek RC Ribosome Reinitiation Directs Gene-specific Translation and Regulates the Integrated Stress Response. J Biol Chem 290, 28257–71 (2015). [DOI] [PMC free article] [PubMed] [Google Scholar]
- 21. Maslon MM, Heras SR, Bellora N, Eyras E & Caceres JF The translational landscape of the splicing factor SRSF1 and its role in mitosis. Elife, e02028 (2014). [DOI] [PMC free article] [PubMed] [Google Scholar]
- 22. Baralle FE & Giudice J Alternative splicing as a regulator of development and tissue identity. Nat Rev Mol Cell Biol (2017). [DOI] [PMC free article] [PubMed] [Google Scholar]
- 23. Braunschweig U, Gueroussov S, Plocik AM, Graveley BR & Blencowe BJ Dynamic integration of splicing within gene regulatory pathways. Cell 152, 1252–69 (2013). [DOI] [PMC free article] [PubMed] [Google Scholar]
- 24. Fu XD & Ares M Jr. Context-dependent control of alternative splicing by RNA-binding proteins. Nat Rev Genet 15, 689–701 (2014). [DOI] [PMC free article] [PubMed] [Google Scholar]
- 25. Kalsotra A & Cooper TA Functional consequences of developmentally regulated alternative splicing. Nat Rev Genet 12, 715–29 (2011). [DOI] [PMC free article] [PubMed] [Google Scholar]
- 26. Lee Y & Rio DC Mechanisms and Regulation of Alternative Pre-mRNA Splicing. Annu Rev Biochem 84, 291–323 (2015). [DOI] [PMC free article] [PubMed] [Google Scholar]
- 27. Papasaikas P & Valcarcel J The Spliceosome: The Ultimate RNA Chaperone and Sculptor. Trends Biochem Sci 41, 33–45 (2016). [DOI] [PubMed] [Google Scholar]
- 28. Yang X et al. Widespread Expansion of Protein Interaction Capabilities by Alternative Splicing. Cell 164, 805–17 (2016). [DOI] [PMC free article] [PubMed] [Google Scholar]
- 29. Buljan M et al. Tissue-specific splicing of disordered segments that embed binding motifs rewires protein interaction networks. Mol Cell 46, 871–83 (2012). [DOI] [PMC free article] [PubMed] [Google Scholar]
- 30. Ellis JD et al. Tissue-specific alternative splicing remodels protein-protein interaction networks. Mol Cell 46, 884–92 (2012). [DOI] [PubMed] [Google Scholar]
- 31. Irimia M et al. A highly conserved program of neuronal microexons is misregulated in autistic brains. Cell 159, 1511–23 (2014). [DOI] [PMC free article] [PubMed] [Google Scholar]
- 32. Ray D et al. Rapid and systematic analysis of the RNA recognition specificities of RNA-binding proteins. Nat Biotechnol 27, 667–70 (2009). [DOI] [PubMed] [Google Scholar]
- 33. Bebee TW et al. The splicing regulators Esrp1 and Esrp2 direct an epithelial splicing program essential for mammalian development. Elife 4(2015). [DOI] [PMC free article] [PubMed] [Google Scholar]
- 34. Dittmar KA et al. Genome-wide determination of a broad ESRP-regulated posttranscriptional network by high-throughput sequencing. Mol Cell Biol 32, 1468–82 (2012). [DOI] [PMC free article] [PubMed] [Google Scholar]
- 35. Yu FX, Zhao B & Guan KL Hippo Pathway in Organ Size Control, Tissue Homeostasis, and Cancer. Cell 163, 811–28 (2015). [DOI] [PMC free article] [PubMed] [Google Scholar]
- 36. Johnson R & Halder G The two faces of Hippo: targeting the Hippo pathway for regenerative medicine and cancer treatment. Nat Rev Drug Discov 13, 63–79 (2014). [DOI] [PMC free article] [PubMed] [Google Scholar]
- 37. Harvey KF, Zhang X & Thomas DM The Hippo pathway and human cancer. Nat Rev Cancer 13, 246–57 (2013). [DOI] [PubMed] [Google Scholar]
- 38. Benhamouche S et al. Nf2/Merlin controls progenitor homeostasis and tumorigenesis in the liver. Genes Dev 24, 1718–30 (2010). [DOI] [PMC free article] [PubMed] [Google Scholar]
- 39. Lu L et al. Hippo signaling is a potent in vivo growth and tumor suppressor pathway in the mammalian liver. Proc Natl Acad Sci U S A 107, 1437–42 (2010). [DOI] [PMC free article] [PubMed] [Google Scholar]
- 40. Yimlamai D et al. Hippo pathway activity influences liver cell fate. Cell 157, 1324–38 (2014). [DOI] [PMC free article] [PubMed] [Google Scholar]
- 41. Zhang N et al. The Merlin/NF2 tumor suppressor functions through the YAP oncoprotein to regulate tissue homeostasis in mammals. Dev Cell 19, 27–38 (2010). [DOI] [PMC free article] [PubMed] [Google Scholar]
- 42. Bai H et al. Yes-associated protein regulates the hepatic response after bile duct ligation. Hepatology 56, 1097–107 (2012). [DOI] [PMC free article] [PubMed] [Google Scholar]
- 43. Grijalva JL et al. Dynamic alterations in Hippo signaling pathway and YAP activation during liver regeneration. Am J Physiol Gastrointest Liver Physiol 307, G196–204 (2014). [DOI] [PubMed] [Google Scholar]
- 44. Su T et al. Two-signal requirement for growth-promoting function of Yap in hepatocytes. Elife 4(2015). [DOI] [PMC free article] [PubMed] [Google Scholar]
- 45. Sher I, Hanemann CO, Karplus PA & Bretscher A The tumor suppressor merlin controls growth in its open state, and phosphorylation converts it to a less-active more-closed state. Dev Cell 22, 703–5 (2012). [DOI] [PMC free article] [PubMed] [Google Scholar]
- 46. Li Y et al. Angiomotin binding-induced activation of Merlin/NF2 in the Hippo pathway. Cell Res 25, 801–17 (2015). [DOI] [PMC free article] [PubMed] [Google Scholar]
- 47. Graves PR & Roach PJ Role of COOH-terminal phosphorylation in the regulation of casein kinase I delta. J Biol Chem 270, 21689–94 (1995). [DOI] [PubMed] [Google Scholar]
- 48. Rivers A, Gietzen KF, Vielhaber E & Virshup DM Regulation of casein kinase I epsilon and casein kinase I delta by an in vivo futile phosphorylation cycle. J Biol Chem 273, 15980–4 (1998). [DOI] [PubMed] [Google Scholar]
- 49. Cegielska A, Gietzen KF, Rivers A & Virshup DM Autoinhibition of casein kinase I epsilon (CKI epsilon) is relieved by protein phosphatases and limited proteolysis. J Biol Chem 273, 1357–64 (1998). [DOI] [PubMed] [Google Scholar]
- 50. Gaffney CJ et al. Identification, basic characterization and evolutionary analysis of differentially spliced mRNA isoforms of human YAP1 gene. Gene 509, 215–22 (2012). [DOI] [PMC free article] [PubMed] [Google Scholar]
- 51. Sudol M YAP1 oncogene and its eight isoforms. Oncogene 32, 3922 (2013). [DOI] [PubMed] [Google Scholar]
- 52. Finch-Edmondson ML, Strauss RP, Clayton JS, Yeoh GC & Callus BA Splice variant insertions in the C-terminus impairs YAP’s transactivation domain. Biochem Biophys Rep 6, 24–31 (2016). [DOI] [PMC free article] [PubMed] [Google Scholar]
- 53. Lin KC, Park HW & Guan KL Regulation of the Hippo Pathway Transcription Factor TEAD. Trends Biochem Sci 42, 862–872 (2017). [DOI] [PMC free article] [PubMed] [Google Scholar]
- 54. Anbanandam A et al. Insights into transcription enhancer factor 1 (TEF-1) activity from the solution structure of the TEA domain. Proc Natl Acad Sci U S A 103, 17225–30 (2006). [DOI] [PMC free article] [PubMed] [Google Scholar]
- 55. Jiang SW, Dong M, Trujillo MA, Miller LJ & Eberhardt NL DNA binding of TEA/ATTS domain factors is regulated by protein kinase C phosphorylation in human choriocarcinoma cells. J Biol Chem 276, 23464–70 (2001). [DOI] [PubMed] [Google Scholar]
- 56. Gupta MP, Kogut P & Gupta M Protein kinase-A dependent phosphorylation of transcription enhancer factor-1 represses its DNA-binding activity but enhances its gene activation ability. Nucleic Acids Res 28, 3168–77 (2000). [DOI] [PMC free article] [PubMed] [Google Scholar]
- 57. Wu JC, Merlino G & Fausto N Establishment and characterization of differentiated, nontransformed hepatocyte cell lines derived from mice transgenic for transforming growth factor alpha. Proc Natl Acad Sci U S A 91, 674–8 (1994). [DOI] [PMC free article] [PubMed] [Google Scholar]
- 58. Meng Z, Moroishi T & Guan KL Mechanisms of Hippo pathway regulation. Genes Dev 30, 1–17 (2016). [DOI] [PMC free article] [PubMed] [Google Scholar]
- 59. Dupont S et al. Role of YAP/TAZ in mechanotransduction. Nature 474, 179–83 (2011). [DOI] [PubMed] [Google Scholar]
- 60. Dong J et al. Elucidation of a universal size-control mechanism in Drosophila and mammals. Cell 130, 1120–33 (2007). [DOI] [PMC free article] [PubMed] [Google Scholar]
- 61. Li WC, Ralphs KL & Tosh D Isolation and culture of adult mouse hepatocytes. Methods Mol Biol 633, 185–96 (2010). [DOI] [PubMed] [Google Scholar]
- 62. Bolger AM, Lohse M & Usadel B Trimmomatic: a flexible trimmer for Illumina sequence data. Bioinformatics 30, 2114–20 (2014). [DOI] [PMC free article] [PubMed] [Google Scholar]
- 63. Dobin A et al. STAR: ultrafast universal RNA-seq aligner. Bioinformatics 29, 15–21 (2013). [DOI] [PMC free article] [PubMed] [Google Scholar]
- 64. Anders S, Pyl PT & Huber W HTSeq--a Python framework to work with high-throughput sequencing data. Bioinformatics 31, 166–9 (2015). [DOI] [PMC free article] [PubMed] [Google Scholar]
- 65. Love MI, Huber W & Anders S Moderated estimation of fold change and dispersion for RNA-seq data with DESeq2. Genome Biol 15, 550 (2014). [DOI] [PMC free article] [PubMed] [Google Scholar]
- 66. Shen SH et al. rMATS: Robust and flexible detection of differential alternative splicing from replicate RNA-Seq data. Proceedings of the National Academy of Sciences of the United States of America 111, E5593–E5601 (2014). [DOI] [PMC free article] [PubMed] [Google Scholar]
- 67. Park JW, Jung S, Rouchka EC, Tseng YT & Xing Y rMAPS: RNA map analysis and plotting server for alternative exon regulation. Nucleic Acids Res 44, W333–8 (2016). [DOI] [PMC free article] [PubMed] [Google Scholar]
- 68. Huang da W, Sherman BT & Lempicki RA Systematic and integrative analysis of large gene lists using DAVID bioinformatics resources. Nat Protoc 4, 44–57 (2009). [DOI] [PubMed] [Google Scholar]
- 69. Tranchevent LC et al. Identification of protein features encoded by alternative exons using Exon Ontology. Genome Res 27, 1087–1097 (2017). [DOI] [PMC free article] [PubMed] [Google Scholar]
- 70. Schneider-Poetsch T et al. Inhibition of eukaryotic translation elongation by cycloheximide and lactimidomycin. Nat Chem Biol 6, 209–217 (2010). [DOI] [PMC free article] [PubMed] [Google Scholar]
- 71. Chorghade S et al. Poly(A) tail length regulates PABPC1 expression to tune translation in the heart. Elife 6(2017). [DOI] [PMC free article] [PubMed] [Google Scholar]
- 72. Floor SN & Doudna JA Tunable protein synthesis by transcript isoforms in human cells. Elife 5(2016). [DOI] [PMC free article] [PubMed] [Google Scholar]
- 73. Trapnell C et al. Differential gene and transcript expression analysis of RNA-seq experiments with TopHat and Cufflinks. Nat Protoc 7, 562–78 (2012). [DOI] [PMC free article] [PubMed] [Google Scholar]
- 74. Wagner GP, Kin K & Lynch VJ Measurement of mRNA abundance using RNA-seq data: RPKM measure is inconsistent among samples. Theory Biosci 131, 281–5 (2012). [DOI] [PubMed] [Google Scholar]
- 75. Kalsotra A, Wang K, Li PF & Cooper TA MicroRNAs coordinate an alternative splicing network during mouse postnatal heart development. Genes Dev 24, 653–8 (2010). [DOI] [PMC free article] [PubMed] [Google Scholar]
Associated Data
This section collects any data citations, data availability statements, or supplementary materials included in this article.
Supplementary Materials
Data Availability Statement
All raw RNA-seq and Polysome profiling data files are available for download from NCBI Gene Expression Omnibus (http://www.ncbi.nlm.nih.gov/geo/) under accession numbers GSE105944 and GSE106140. Source data for all figures are available with the paper online. All other data are available from the authors upon reasonable request.