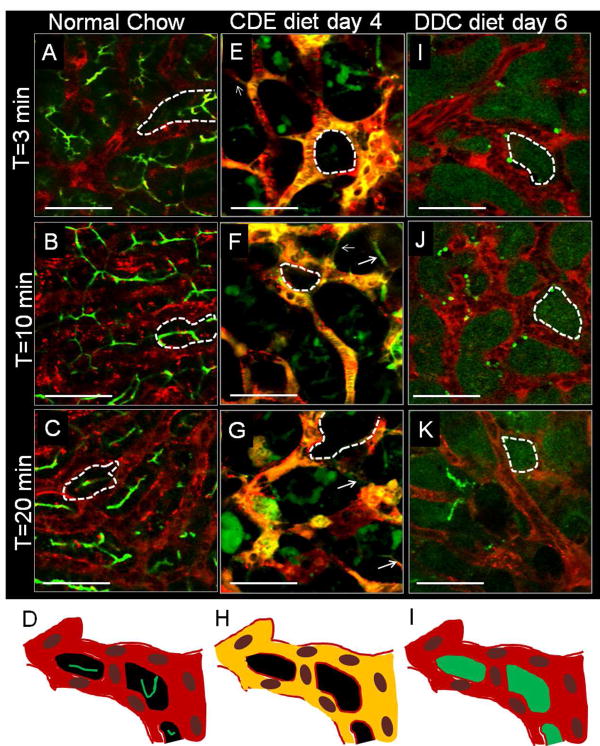
Figure 1. qLIM enables real-time assessment of BBlB in the intact liver of live mice.
Time series images of (A) 3m, (B) 10m and (C) 20m of mouse liver fed on normal-chow shows localization of CF (green) and TXR-dextran (red) in bile-canaliculi and sinusoids, respectively. (D) qLIM schematic diagram of mouse liver section fed with normal-chow. Time series images of (E) 3m, (F) 10m and (G) 20m of (n=1) mouse liver fed on CDE-diet for 4d show complete localization of CF (green) and TXR-dextran (red) in liver sinusoids. (H) qLIM schematic diagram of mouse liver section fed with CDE-diet for 4d. Time series images of (I) 3m, (J) 10m and (K) 20m of (n=1) mouse liver fed on DDC-diet for 6d show localization of CF (green) and TXR-dextran (red) in hepatocytes and sinusoids, respectively. (L) qLIM schematic diagram of mouse liver section fed with DDC-diet for 6d. Arrow denotes presence of this conduits through which blood and bile are leaking and dotted lines represents hepatocytes.

