

Abstract
Background & Aims:
The benefit of colonoscopy for colorectal cancer prevention depends on the adenoma detection rate (ADR). The ADR should reflect adenoma prevalence rate, estimated to be greater than 50% among the screening-age population. Yet the rate of adenoma detection by colonoscopists varies from 7% to 53%. It is estimated that every 1% increase in ADR reduces the risk of interval colorectal cancers by 3-6%. New strategies are needed to increase the ADR during colonoscopy. We tested the ability of computer-assisted image analysis, with convolutional neural networks (a deep learning model for image analysis), to improve polyp detection, a surrogate of ADR.
Methods:
We designed and trained deep convolutional neural networks (CNN) to detect polyps using a diverse and representative set of 8641 hand labeled images from screening colonoscopies collected from over 2000 patients. We tested the models on 20 colonoscopy videos with a total duration of 5 hours. Expert colonoscopists were asked to identify all polyps in 9 de-identified colonoscopy videos, selected from archived video studies, either with or without benefit of the CNN overlay. Their findings were compared with those of the CNN, using CNN-assisted expert review as the reference.
Results:
When tested on manually labeled images, the CNN identified polyps with an area under the receiver operating characteristic curve (ROC-AUC) of 0.991 and an accuracy of 96.4%. In the analysis of colonoscopy videos in which 28 polyps were removed, 4 expert reviewers identified 8 additional polyps without CNN assistance that had not been removed and identified an additional 17 polyps with CNN assistance (45 in total). All polyps removed and identified by expert review were detected by the CNN. The CNN had a false-positive rate of 7%.
Conclusion:
In a set of 8641 colonoscopy images containing 4088 unique polyps the CNN identified polyps with a cross-validation accuracy of 96.4% and ROC-AUC value of 0.991. The CNN system can detect and localize polyps well within real-time constraints using an ordinary desktop machine with a contemporary graphics processing unit. This system could increase ADR and reduce interval colorectal cancers but requires validation in large multicenter trials.
Keywords: Machine Learning, Convolutional Neural Networks, Colorectal Cancer Prevention, ADR improving technology
1. INTRODUCTION
Colorectal cancer (CRC) is the second leading cause of cancer related death in the U.S.1. CRC arises from precancerous polyps2 with a mean dwell time of 10+ years3. The National Polyp Study showed that 70%-90% of colorectal cancers are preventable with regular colonoscopies and removal of polyps4. Seven to nine percent of colorectal cancers occur despite being up-to-date with colonoscopy5. It is estimated that 85% of these “interval cancers” are due to missed polyps or incompletely removed polyps during colonoscopy6.
The prevalence of precancerous polyps in the > 50-year-old screening population is estimated to be 50+%7. Adenomas are the most prevalent precancerous polyp. Adenoma detection rate (ADR; percentage of screening colonoscopies with at least one adenoma found) is a measure of a colonoscopist’s ability to find adenomas. Ideally, the ADR should reflect adenoma prevalence. Unfortunately, ADR varies widely (7% - 53%) among colonoscopists performing screening colonoscopies8. In tandem colonoscopies, 22-28% of polyps and 20-24% of adenomas are missed7 and CRC has a diagnostic miss rate of 5%9. ADR is dependent on a colonoscopist’s level of training, time spent, and technique used during withdrawal, preparation quality and other colonoscopist/procedure-dependent factors10. A large Kaiser Permanente study showed that for each 1% increase in ADR, interval cancer rate was reduced by 3%8. A subsequent study with nearly 1 million person-years of follow-ups in Poland showed a 6% reduction in interval cancer rates for each 1% increase in ADR11. This study also revealed an 82% reduction in interval cancers among colonoscopists that improved their ADR to the top quintile. Not surprisingly, ADR is now a key quality measure reportable in the United States to CMS and is tied to reimbursement under MACRA/MIPS beginning in the year 201712.
Several novel technologies have been developed to improve ADR, including enhanced optics (resolution, zoom and wide angle, chromoendoscopy, digital auto-fluorescence, extra lenses for side and forward view), and attachments/modifications to aid view behind and between folds, including cap-assisted techniques and a balloon-assisted device13. Extra-wide angle colonoscopes/multi-camera systems initially showed promise to increase ADR compared to standard forward-facing camera systems13. However, a recent meta-analysis and a large randomized study showed no difference in ADR compared to standard forward-viewing colonoscopy14. Review of five studies on the effect of high-definition colonoscopes on ADR revealed conflicting evidence13, with one study concluding that ADR is only improved for endoscopists with low ADR (<20%)15. Similarly, most studies on digital chromoendoscopy, specifically Narrow-Band Imaging or NBI, show that NBI does not improve ADR when compared to white light imaging13. Evidence suggests positive effects of auto-fluorescence, but it is associated with added expense and poor image resolution13.
Computer-assisted image analysis has the potential to further aid adenoma detection but has remained underdeveloped. A notable benefit of such a system is that no alteration of the colonoscope or procedure is necessary.
Deep learning has been successfully applied to many areas of science and technology16, such as computer vision17,18,19,20,21, speech recognition22, natural language processing23, games24,25, particle physics26,27, organic chemistry28, and biology29,30,31,32,33,34, to name just a few areas and examples. A convolutional neural network (CNN) is a type of deep learning model that is highly effective at performing image analysis.
Ideally, a polyp-detection assistance module should have a sensitivity of 1 (or close to it) to avoid false negatives, but this comes at the cost of an increased false positive rate when the AUC (area under the curve; see Supplementary Section 1.3) is not close to 1. A large false positive rate, even with perfect sensitivity, diminishes the benefits of an assistance-system, if user desensitization comes into play. A polyp detection module must also process images at a minimum of 30 frames per second to be applicable during colonoscopy. Surmounting the constraints of accuracy and processing speed were therefore our primary goals.
2. METHODS
2.1 –. Convolutional Neural Networks
We trained a variety of convolutional neural network (CNN) architectures in this study, including models with weights initialized by training on the ImageNet data corpus35, before refining the weights on our data set. All trained CNNs consisted of the same fundamental building blocks, including: 1) convolutional layers, 2) fully connected layers, 3) max- or average-pooling, 4) nonlinear activation functions, and 5) optionally, batch normalization (bn) operations36, and skip connections19,37
We followed each convolutional layer by the rectified linear (ReLu) activation function. The last hidden layer of the models was densely connected to the output units. For regression problems (localization), we optimized the L2-loss with linear output units. For classification (detection) we used softmax output units and optimized the KL-divergence. An overview of the different neural network layer types can be found in Supplementary Section 1.1.
All experiments are implemented using the Keras38 and Tensorflow39 software libraries.
2.2 -. Model regularization
We used established techniques to reduce over-fitting when training neural networks. We applied dropout40,41 with a rate of 0.5 to the input of the first and second fully-connected layer in all models. Prior studies demonstrated that data augmentation improves deep learning performance42, a process of synthetically generating additional training examples by using random image transformations, including rotations and mirroring of the input images during the training process. Doing so forces the model to learn to become invariant to these transformations. We used random horizontal and vertical mirroring, rotations in the full range of 0 to 90 degrees, and shearing. Another technique we used to reduce over-fitting is “early stopping”, where a small subset of the training set is reserved exclusively for monitoring the CNN’s accuracy during training, and the weights of the network at the point of best performance are saved, as opposed to the weights obtained at the end of training.
3. EXPERIMENTS
3.1 -. Data Sets & Preprocessing
Five different data sets are used for training and/or evaluating the deep learning models presented in this work: (1) the general purpose, computer vision, ImageNet challenge35 data set implicitly used to pre-train the model weights; (2) 8641 hand-selected colonoscopy images from over 2000 patients, to avoid a possible intra-patient polyp similarity bias; (3) a separately collected data set of 1330 colonoscopy images from different patients; (4) 9 colonoscopy videos; (5) a combined data set consisting of the 8641 images and 44947 image frames extracted from the 9 videos; and (6) a separate data set of 11 deliberately more “challenging” colonoscopy videos. All the colonoscopy images and videos were recorded using state-of-the-art Olympus PCF-H190 colonoscopes with a resolution of 1280×1024 pixels and NBI capability. The combined duration of all 20 videos is approximately five hours (~500k frames), with significant variation in the number of polyps per video (see Supplementary Table 5).
-
(1)
The ImageNet challenge data set contains 1.2 million natural images of objects like boats, cars, and dogs, but no medical images. We reasoned that many of the fundamental features learnable on this data set will be transferable to the task of detecting polyps and thus use it to preinitialize the weights of some of our deep neural networks to test this hypothesis.
-
(2)
The set of 8641 colonoscopy images contains 4088 images of unique polyps, of all sizes and morphologies, and 4553 images without polyps (Figure 1), i.e. the data set is almost perfectly balanced. The data set includes both white light and NBI images (Figure 1), and covers all portions of the colorectum, including retro-views in the rectum and cecum, appendiceal orifice, and ileocecal valve. The number of NBI images is 840 in total, with the remaining 7801 obtained in WLE conditions. We deliberately and randomly included features such as forceps, snares, cuff devices, debris, melanosis coli, and diverticula in both polyp- and non-polyp-containing images in a balanced fashion, to prevent the machine learning system from associating the appearance of tools with the presence of polyps. The images were stored at a resolution of 640×480 pixels. Locations and dimensions of bounding boxes were recorded for images containing polyps by a team of colonoscopists (fellows and faculty at UCI with ADR >45% and procedures >100).
-
(3)
A separate set of 1330 colonoscopy images (672 unique polyp- and 658 non-polyp images) collected from different patients.
-
(4)
The colonoscopy videos were recorded and evaluated at their original resolution of 1280×1024 pixels. The first set of 9 videos was selected randomly, from archived video studies.
-
(5)
The larger data set was obtained by augmenting the original set of 8641 images with 44947 image frames selected from the nine videos that were labelled as part of the first validation study. Because consecutive frames are highly correlated, we selected every 8th image frame that contained no polyp, as well as every 4th image frame containing a polyp (resulting in 13292 polyp frames and 31655 non-polyp frames).
-
(6)
The colonoscopy procedures of the second set of 11 videos were performed by a highly skilled colonoscopist (ADR ≥ 50%) and contain segments where the scope was deliberately withdrawn without closing in on already identified polyps, in an attempt to mimic a missed polyp scenario. This set of videos is used only for validation purposes in our experiments, and never for training.
Figure 1:
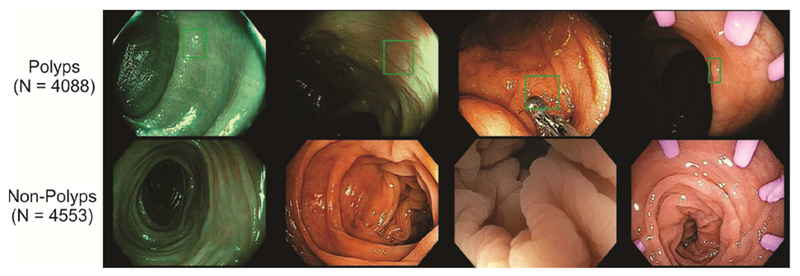
Examples of our data set. Top row: images containing a polyp with a superimposed bounding box, bottom row: non-polyp images. Three pictures on the left were taken using NBI (narrow band imaging) and three pictures on the right contain tools (e.g. biopsy forceps, cuff devices, etc.) that are commonly used in screening colonoscopy procedures.
All the images from the different data sets are preprocessed identically before being passed to the machine learning models. As a first step, the individual frames are rescaled to a fixed size of 224×224 (unless noted otherwise). Then, the values of the pixels in each frame are normalized to be unit-normal distributed by subtracting the mean pixel value from all pixels in the frame and dividing the resulting values by the standard deviation measured across all pixels. This preprocessing and normalization approach allows us to apply the same neural network to data from different sources, with different resolutions, without requiring further adjustments.
3.2 -. Neural Network Architectures and Training
A detailed description of the deep neural network architectures, training methods and algorithms is given in Section 1 of the Supplementary Material. A short summary is given below:
We trained and evaluated polyp-detection and -localization models separately for clarity and to exclude confounding factors. They are architecturally identical except for the final layer, which performs either binary classification (detection) or regression (localization). We implemented localization by predicting the size and location of a bounding box that tightly encloses any identified polyps. This allows us to build CNNs that can operate in real-time - as opposed to prior attempts, based on individual pixel classification, which struggle to operate in real-time43. We tested three variations for training the polyp localization model: (1) optimizing the size and location with the mean-squared error loss (L2); (2) optimizing the Dice loss, which directly maximizes the overlap between the predicted bounding box and the ground truth; and (3) a variation of the “You Only Look Once”20 algorithm where the CNN produces and aggregates over, typically, 49 individual weighted predictions of the polyp size and location in a single forward pass – we will refer to it as “internal ensemble”. All detection and localization variants have almost identical run-time complexity (< 1% difference).
We experimented with several different CNN architectures, falling into one of two categories: those initialized with random weights (denoted NPI for “not pre-initialized”) and those pre-initialized with weights obtained by training the corresponding model on the ImageNet Challenge data of natural images (denoted PI for “pre-initialized”). Within the class of pre-initialized architectures, we used the architectures VGG1618, VGG1918, and ResNet5019. All CNN architectures (NPI and PI) were trained using the colonoscopy data. All experiments were performed using modern Titan X (Pascal) GPUs with 12GB of RAM and a processing power of 11 TFLOPS.
3.3 –. Training and Testing
Throughout the experiments, we either used multiple splits of the same data set (cross-validation) or trained on one data set and tested the model on a completely different data set. For early stopping and hyperparameter optimization we always set aside a small subset of the training set for monitoring the model’s performance. The main experiments were:
-
-
Cross-validation on the 8641 images.
-
-
Training on the 8641 images and testing on the 9 videos, 11 videos, and independent data set.
-
-
Training on the 8641 images + 9 videos and testing on the 11 videos, and independent data set.
In most cases we use models pre-trained on ImageNet.
3.4 -. Colonoscopy Video Study with Expert Colonoscopists
Three expert colonoscopists (ADR > 50%) were tasked to identify all polyps in nine deidentified colonoscopy videos, selected from archived video studies, without benefit of the CNN overlay. Experts recorded the first and last frame where they believed to have encountered a polyp in the videos. Their “polyp encounters” were then combined by consensus. We filter CNN predictions for polyps by requiring at least 8 or more contiguous video frames with >40% probability for polyp presence, as predicted by the PI-CNN 2 model alone. The decision to filter CNN predictions in blocks of n=8 frames yielded a balanced sensitivity/specificity (see Supplementary Figure 2 for an analysis of different block-sizes). This optimal setting may shift for a different training data set or CNN model.
We generated CNN-overlaid videos by superimposing a small green box on each frame where a polyp was detected with >95% predicted probability at the location and with dimensions that were predicted by our polyp localization CNN.
A senior expert (ADR ≥ 50%, >20K colonoscopies) was tasked to review the CNN-overlaid videos and assign uniqueness of each polyp and confidence level of true polyp presence (High vs Low; see Figure 2). Contingency analysis compared the number of agreements and disagreements on individual video frames between post-processed CNN predictions alone and CNN-assisted expert review. We repeated this study using a second set of 11 more challenging videos (see Section 3.1).
Figure 2:
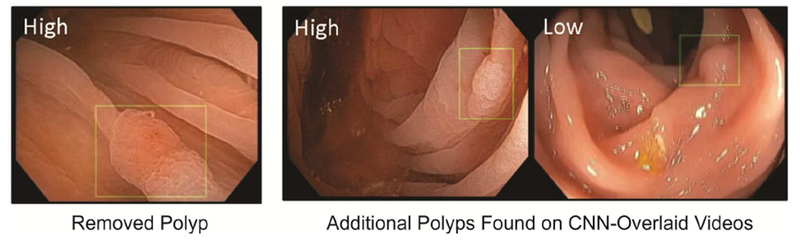
Representative frame shots of CNN-overlaid colonoscopy videos. Presence of a green box indicates that a polyp is detected with >95% confidence by our CNN polyp localization model; the location and size of the box are predictions of the CNN model. Expert confidence that box contained a true polyp is shown in upper left of the images.
(Video collages of CNN localization predictions: http://www.igb.uci.edu/colonoscopy/AI_for_GI.html)
4. RESULTS
4.1 -. Polyp Detection
We summarize polyp detection results in Table 2. The first two rows (NPI-CNN1 and 2) correspond to models that were trained starting from random weights and these obtain accuracies that are comparable to previously published state-of-the-art polyp classification models44.
Table 2:
Summary of polyp classification results for the architectures described earlier (see Table 1), obtained by 7-fold cross-validation on the 8641 colonoscopy images. The sensitivity (true positive rate) is given at false negative rates of 5% and 1% (i.e. a specificity of 95% and 99% respectively), as sensitivity and specificity are interdependent values.
| Model | Initial Weights | Accuracy | AUC | Sensitivity at 5% FNR | Sensitivity at 1% FNR |
|---|---|---|---|---|---|
| NPI-CNN 1 | - | 91.9 ± 0.2% | 0.970 ± 0.002 | 88.1% | 65.4% |
| NPI-CNN 2 | - | 91.0 ± 0.4% | 0.966 ± 0.002 | 86.2% | 60.6% |
| PI-CNN 1 | VGG16 | 95.9 ± 0.3% | 0.990 ± 0.001 | 96.9% | 87.8% |
| PI-CNN 2 | VGG19 | 96.4 ± 0.3% | 0.991 ± 0.001 | 96.9% | 88.1% |
| PI-CNN 3 | ResNet50 | 96.1 ± 0.1% | 0.990 ± 0.001 | 96.8% | 88.0% |
Networks pre-initialized from prior training on the large ImageNet data set of natural images surpass those starting from random weights by a significant margin (PI-CNN1-3), despite meticulous hyperparameter optimization of all models. We further observe that the scores of the pre-initialized ImageNet models are surprisingly similar for the different architectures.
At a sensitivity level (true positive rate) of 90% the best model (PI-CNN 2) has a false positive rate (FPR) of 0.5%; at a sensitivity of 95.2% it has an FPR of 1.6%; and at 97.1% sensitivity the FPR increases to 6.5%. Thus, we have a reasonably large range of high sensitivities at which the number of expected false positive alerts remains very low.
Nonpolypoid (flat and depressed) polyps are challenging to detect compared to polypoid polyps and were often neglected, until their potential to cause CRC worldwide (beyond Japan only) was discovered45. To investigate whether the CNN is able to correctly classify all polyps irrespective of their morphology, we reviewed a random subset of 1578 true positive polyp predictions (out of 3860) and all 228 false negative polyp predictions from the validation set of 8641 images. We categorized them using both Paris classification and their estimated size. The results are presented in Table 1 and show that 381 nonpolypoid lesions (IIa, IIb, IIc) and 678 polypoid polyps (Ip, Is) were present in this subset. The CNN missed 12% of polypoid polyps (84 of 678) and 11% of nonpolypoid lesions (41 out of 381) in this biased subset. Based on this similarity, we can conclude that the CNN is able to detect either type of polyps equally well. Furthermore, if we correct for the sampling bias by including all the remaining true positives, then the percentage of missed polyps would fall to about 5%.
Table 1:
Categorization of a random subset of 1578 true-positive and all 228 false-negative polyp CNN predictions on the test set of 4088 unique polyps, categorized by size/Paris classification. Results obtained via 7-fold cross-validation on the 8641 colonoscopy images. All polyps >3mm are categorized by the Paris classification scheme. The CNN performs equally well at detecting nonpolypoid lesions (II a/b/c) and polypoid polyps (I p/s).
| True Positives | False Negatives | |||
|---|---|---|---|---|
| ≤ 1cm | > 1cm | ≤ 1cm | > 1cm | |
| Dim (≤ 3 mm) | 644 | - | 103 | - |
| I p | 37 | 25 | 8 | 6 |
| I s | 487 | 45 | 68 | 2 |
| II a | 246 | 37 | 36 | 4 |
| II b | 34 | 15 | 1 | 0 |
| II c | 4 | 4 | 0 | 0 |
All previously discussed results are obtained with models operating on inputs scaled to 224×224 pixels, which is the native resolution for which VGG16, VGG19, and ResNet50 were designed. We also optimized and trained the models at a resolution of 480×480 pixels to test whether they are limited by the lower resolution. In a seven-fold cross-validation experiment, the networks preinitialized with weights from the VGG16 / VGG19 / ResNet50 models obtain a test accuracy of 96.4% / 96.1 % / 96.4% and an AUC of 0.990 / 0.991 / 0.992 respectively. These results are almost identical (up to noise) to those obtained with a lower resolution of 224×224 pixels, but more than double the computational cost (processing time).
Finally, the VGG-19-based CNN trained on the 8641 images was tested on the independent data set of 1330 images, where it achieved a test accuracy of 96.4% and AUC of 0.974. This accuracy is identical to the accuracy obtained by cross-validation analysis on the 8641 colonoscopy images, further confirming that intra-patient polyp similarity does not present a notable bias.
4.2 -. Polyp Localization
We trained models on the polyp localization task on the data-subset containing only a single polyp per frame, which is the vast majority of the samples with polyps.
The test-set results, as presented in Table 3, show that the pre-initialized ImageNet CNNs (PI-CNN 1, 2) perform significantly better at localizing polyps than the randomly initialized neural network, which is consistent with our findings in polyp presence detection (Section 4.1).
Table 3:
Summary of polyp localization results for a subset of the architectures described earlier (see Table 1), obtained by seven-fold cross-validation on the 8641 colonoscopy images. Standard deviation of mean estimate from the cross-validation is shown.
| Model | L2 regression [Dice] | Dice score optimization [Dice] | “Internal Ensemble” Regression [Dice] |
|---|---|---|---|
| NPI-CNN 1 | 0.63 ± 0.01 | 0.681 ± 0.002 | 0.731 ± 0.006 |
| PI-CNN 1 | 0.77 ± 0.01 | 0.76 ± 0.01 | 0.823 ± 0.003 |
| PI-CNN 2 | 0.79 ± 0.01 | 0.784 ± 0.004 | 0.827 ± 0.003 |
Neither of the two loss functions (L2 vs. Dice) has a consistent advantage over the other.
Further, we find that the “internal ensemble” is noticeably better than the other approaches, improving the Dice coefficient from 0.79 to 0.83 for the best model (PI-CNN 2 / VGG19).
To give a sense of scale: in previously published literature43 a Dice score of 0.55 was obtained on a polyp segmentation task using a different dataset.
4.3 -. Colonoscopy Video Study with Expert Colonoscopists
Among nine colonoscopy videos that we considered in this study, 36 polyps were identified by three experts reviewing unaltered videos and 45 were identified by reviewing CNN-overlaid videos. Only 28 of 45 polyps were removed by the original colonoscopists (Table 4). No unique polyps were missed by the CNN. Of the nine additional polyps found with CNN assistance, confidence was high for three and low for six (cf. Figure 2). Sensitivity and specificity of CNN-predictions relative to expert-review of CNN-overlaid videos (based on single frames) was 0.93 and 0.93, respectively (Supplementary Table 3, chi-square p < 0.00001). Rare false negatives were enriched with views of distant and field edge polyps. False positives were enriched with near field collapsed mucosa, debris, suction marks, NBI, and polypectomy sites. Tables 4 and 5 show polyp-level summaries of the results of the video study.
Table 4:
Unique polyps found and removed during colonoscopy, found by expert review, and found by CNN-assisted expert review of the nine videos. The VGG-19 based CNN was trained on the 8641 colonoscopy images and applied to the nine videos without further adaptation.
| Polyp size | Original Colonoscopist (Polyps Removed) | Expert Review | CNN-Assisted Review |
|---|---|---|---|
| 1-3 mm | 12 | 19 | 24 |
| 4-6 mm | 12 | 13 | 16 |
| 7-9 mm | 0 | 0 | 1 |
| >10 mm | 4 | 4 | 4 |
| Total Polyps Found | 28 | 36 | 45 |
Table 5:
Analysis of the VGG-19 based CNN tested on all 9 + 11 videos after training on the 8641 colonoscopy images. CNN-assisted expert review annotations were used as reference. The delay to detection * of a polyp is the time span between a polyp entering the field of view of the camera for the first time and the CNN producing its first positive polyp prediction. All false positives with duration of 1+ seconds are counted. A frame-by-frame analysis of the video study can be found in Supplementary Table 3. “Challenging videos” were produced by an expert colonoscopists who performed “flybys” that included but avoided inspection of known polyps to mimic missed polyp scenarios.
| 9 Videos | 11 “Challenging” Videos | |
|---|---|---|
| Total polyps found | 45 | 68 |
| Total polyps missed | 0 | 5 |
| Total False positives | 81 | 46 |
| Avg. delay to detection* | 0.2 ± 0.1 sec | 1.3 ± 0.3 sec |
The second set of 11 videos contains a total of 73 unique polyps, found by expert review with- and without CNN assistance. The CNN trained on the 8641 images identified 68 of 73 polyps at a frame-by-frame false positive rate (FPR) of 7%, when compared to the expert labels of the videos. Fine-tuning the CNN on the labeled frames from the first video study enabled the CNN to identify 67 of 73 the polyps at a FPR of 5% (or, on a more sensitive setting, 72 of 73 polyps at a FPR of 12%) in this second set of videos. The additional training samples from the videos of the first study noticeably helped reduce the number of false positive detections, most likely due to the great abundance and variety of random artefacts such as water, air bubbles, fecal matter, and low quality- and blurry frames from quick movement. This suggests that using additional training data could lead to further improvements.
The Supplementary Material contains a detailed breakdown of the polyps found in the 20 videos by the experts, including their location, size, morphology, and other details.
4.4 –. Additional Experiments
We performed further experiments to test: (1) whether a system trained on WLE+NBI can do well on colonoscopies without NBI capability; and (2) whether a system trained on WLE data only can perform even better on WLE-only colonoscopies than a system trained NBI + WLE. We retrained the same VGG-19-based CNN on either NBI-only, or WLE-only, or subsets of the 8641 colonoscopy images in 7-fold cross-validation analyses. Training and testing the CNN on WLE-only data resulted in a cross-validation test accuracy of 96.1% and AUC of 0.991, while training and testing on NBI-only data yielded an accuracy of 92.9% and AUC of 0.970. In both cases, this is worse than what the same CNN achieved when trained on WLE + NBI: an accuracy of 96.4% with 0.992 AUC on WLE-only data, and an accuracy of 94.8% and 0.988 AUC on NBI-only data. The test accuracy on NBI images was consistently worse than on WLE data, but this may be explained by the significantly lower amount of NBI training data (840 NBI images versus 7801 WLE images). In summary, we find that it is beneficial to train the CNN on NBI+WLE images combined, as this increases the total amount of training data resulting in a synergistic knowledge “transfer” between the two modalities.
4.5 -. Discussion
An early application of computer-assisted polyp detection, utilized traditional non-learning-based computer-vision engineering methods and achieved an AUC of 0.98 for detecting a limited class of polyp types43, but could not work in real-time requiring 19 seconds to process a single frame. Of 8 submissions to the MICCAI 2015 Endoscopic Vision Challenge for polyp detection, none could operate in real-time, and the most accurate (CUMED) had a detection accuracy of 89%, tested across 18092 video frames43. Other CNNs applied to the task of polyp detection have been limited by small databases of polyp images and videos. An implementation operating on multiple small sub-patches of images reached a classification accuracy of 91%44, whereas another approach utilizing three convolutional layers operating on heavily sub-sampled images of size 32×32 pixels obtained an AUC of 0.86, a sensitivity of 86%, and specificity of 85%46.
In this study we trained state-of-the-art CNNs, pre-initialized on millions of labeled natural images (ImageNet) on a data set of over 8000 labeled colonoscopy images from over 2000 patients. For the first time, these models can identify and locate polyps in real-time while simultaneously achieving high accuracy and AUC. The highest performing model can process 98 images per second (10ms per frame) for both polyp- detection and localization when using a modern consumer-grade GPU. This is about four times faster than required to implement real-time assistance software, given that commonly used video encodings are standardized to 25 or 30 frames per second (PAL / NTSC standards). In comparison, the fastest polyp localization model presented in prior work47, among eight, can process only 7 frames per second, and the slowest one merely 0.1 frames per second. A main contribution to the speed of our system comes from the choice of locating polyps through bounding boxes rather than unnecessarily precise polyp-boundaries.
In terms of resolution, while all human assessment of videos was done at high resolution, we found that a 224×224 pixels resolution was sufficient for the CNNs, and virtually indistinguishable from a 480×480 resolution. We believe that future advances in computer hardware and machine learning will make it feasible to use even larger input fields while preserving real-time capabilities and potentially improve the detection accuracy.
Our feasibility study of nine colonoscopy videos, reviewed by expert colonoscopists with and without aid of CNN-overlay, demonstrated that the model identified all polyps, and aided discovery of additional polyps with relatively low burden of false positives. In a second study, with eleven purposefully difficult colonoscopy videos, recorded by a senior colonoscopist, featuring “flyby” scenarios without closing in on previously found polyps during withdrawal, the CNN alone identified 67 of 73 unique polyps, with an average of less than 5 false positives per video. Missed polyps were located in “flyby” segments of the video, suggesting that CNN-assistance cannot compensate for hurried withdrawal and poor inspection technique. Polyp morphology did not play a role in CNN performance, i.e. nonpolypoid lesions were not missed by the CNN more often than polypoid polyps.
Our feasibility study suggests that CNN-assistance during live colonoscopy will result in fewer missed polyps. However, extrapolation to real-time use is limited by several factors, including unknown effects of the CNN on inspection behavior by the colonoscopist. Another limitation derives from the anonymized and de-identified nature of the videos, which excluded information about the indications for colonoscopy or the histology of polyps. CNN performance may vary by indication (screening vs surveillance).
Polyp histology is especially relevant with respect to added time and pathology costs. Time spent for polypectomy is “added value” whenever a true positive is precancerous, malignant, or relevant for calculating surveillance interval and/or ADR. However, if use of the CNN results in polypectomies of clinically irrelevant lesions, the added time and unnecessary pathology costs would be unacceptable. Future randomized studies can directly address the overall value (quality/cost) of the CNN by examining its effects on colonoscopy time, pathology costs, ADR, polyps per procedure, surveillance-relevant polyps per procedure, and surveillance irrelevant polyps per procedure (normal, lymphoid aggregates, etc.).
Finally, live use of the CNN may lengthen colonoscopy procedure times due to second looks at false positives and additional polypectomies. Time to assess a false positive will likely average <5 seconds at an estimated false positive rate of less than 8/colonoscopy. This relatively minor time cost could be reduced with further optimization of detection accuracy (e.g. more training data), user interface (e.g. color selection, sound effects), and simultaneous running of accurate optical pathology AI algorithms.
While our results were obtained using Olympus endoscopes, which have a 70% endoscope market share48, we expect that the proposed method will also work with endoscopes from other vendors with little additional tuning of the algorithm. This is consistent with hundreds of experiments reported in the literature on “transfer learning” and our extensive experience with other biomedical imaging problems30,31,32.
Our proposed method demonstrates great promise in helping to close the gap between ADR and true adenoma prevalence, especially for colonoscopist with low ADR. By meeting the constraints of high accuracy and real-time performance using standard personal computers, this is the first reported polyp detection AI application ready for real-time validation studies.
5. CONCLUSION
We have built a state-of-the-art polyp detection and localization model using deep learning that is easily capable of operating in real-time conditions (processing one frame in 10 ms). We can detect the presence of polyps in a frame with an accuracy of 96.4% and an AUC of 0.991 using a convolutional neural network that was first trained on the ImageNet corpus of natural images and then re-trained on our polyp database. A small adaptation of the model enabled it to localize polyps to within a bounding-box with a state-of-the-art Dice/F1 score of 0.83 with a processing time of only 10ms per frame. When overlaid on colonoscopy videos, the algorithm identified all polyps found by expert viewers (adenoma detection rate >50%), as well as additional polyps missed on expert review of non-overlaid videos. We therefore believe that, when running live during colonoscopy, this model will prompt more careful inspection and discovery of additional polyps. It is thus well positioned for validation in prospective trials to test effectiveness for improving ADR and reducing adenoma miss rate. Furthermore, there is no reason to believe that the same methods, with the proper adjustments and training sets, could not work to tackle other real-time needs in endoscopy.
Supplementary Material
ACKNOWLEDGMENTS
We wish to thank Anish Patel, Junhee Kim, Gregory Albers, and Kenneth Chang for their support on this project. We further would like to acknowledge a hardware gift from NVDIA and thank Yuzo Kanomata for computing support.
Grant support: Work in part supported by grants NIH GM123558, NSF IIS-1550705 to P.B.
Abbreviations:
- ADR
Adenoma Detection Rate
- AUC
Area Under the Curve
- CNN
Convolutional Neural Network
- CRC
Colorectal Cancer
- GPU
Graphics Processing Unit
- NBI
Narrow-Band Imaging
Footnotes
Publisher's Disclaimer: This is a PDF file of an unedited manuscript that has been accepted for publication. As a service to our customers we are providing this early version of the manuscript. The manuscript will undergo copyediting, typesetting, and review of the resulting proof before it is published in its final citable form. Please note that during the production process errors may be discovered which could affect the content, and all legal disclaimers that apply to the journal pertain.
Conflicts of Interest: The authors have no financial, professional, or personal conflict of interest.
References
- 1.Cancer Facts and Figures. American Cancer Society (10AD) 2016. [Google Scholar]
- 2.Strum WB. Colorectal Adenomas. New England Journal of Medicine 2016; 374, 1065–1075. [DOI] [PubMed] [Google Scholar]
- 3.Russell LB, Kuntz KM, Lansdorp-Vogelaar, et al. A Systematic Comparison of Microsimulation Models of Colorectal Cancer: The Role of Assumptions about Adenoma Progression. Medical Decision Making 2011; 31, 530–539. [DOI] [PMC free article] [PubMed] [Google Scholar]
- 4.Winawer SJ, Zauber AG, Ho MN, et al. Prevention of Colorectal Cancer by Colonoscopic Polypectomy. New England Journal of Medicine 1993; 329, 1977–1981. [DOI] [PubMed] [Google Scholar]
- 5.Patel SG, Ahnen DJ. Prevention of Interval Colorectal Cancers: What Every Clinician Needs to Know. Clinical Gastroenterology and Hepatology 2014; 12, 7–15. [DOI] [PubMed] [Google Scholar]
- 6.Pohl H, Robertson DJ. Colorectal Cancers Detected after Colonoscopy Frequently Result from Missed Lesions. Clinical Gastroenterology and Hepatology 2010; 8, 858–864. [DOI] [PubMed] [Google Scholar]
- 7.Leufkens AM, van Oijen MGH, Vleggaar FP, et al. Factors Influencing the Miss Rate of Polyps in a Back-to-back Colonoscopy Study. Endoscopy 2012; 44, 470–475. [DOI] [PubMed] [Google Scholar]
- 8.Corley DA, Jensen CD, Marks AR, et al. Adenoma Detection Rate and Risk of Colorectal Cancer and Death. New England Journal of Medicine 2014; 370, 1298–1306. [DOI] [PMC free article] [PubMed] [Google Scholar]
- 9.Than M, Witherspoon J, Shami J, et al. Diagnostic Miss Rate for Colorectal Cancer: An Audit. Annals of Gastroenterology 2014; 28, 94. [PMC free article] [PubMed] [Google Scholar]
- 10.Anderson JC, Butterly LF. Colonoscopy: Quality Indicators. Clinical and translational gastroenterology 2015; 6, e77. [DOI] [PMC free article] [PubMed] [Google Scholar]
- 11.Kaminski MF, Wieszczy P, Rupinski M, et al. Increased Rate of Adenoma Detection Associates with Reduced Risk of Colorectal Cancer and Death. Gastroenterology 2017; 153:98–105 [DOI] [PubMed] [Google Scholar]
- 12.GI Quality Measures for 2017 Released in MACRA Final Rule. (16AD).
- 13.Bond A, Sarkar S. New Technologies and Techniques to Improve Adenoma Detection in Colonoscopy. World Journal of Gastrointestinal Endoscopy 2015; 7, 969. [DOI] [PMC free article] [PubMed] [Google Scholar]
- 14.Hassan C, Senore C, Radaelli F, et al. Full-Spectrum (FUSE) versus Standard Forward-Viewing Colonoscopy in an Organised Colorectal Cancer Screening Programme. Gut 2017; 66 (11), 1949–1955 [DOI] [PubMed] [Google Scholar]
- 15.Waldmann E, Britto-Arias M, Gessl I, et al. Endoscopists with low Adenoma Detection Rates Benefit from High-Definition Endoscopy. Surg Endoscopy 2015; 29, 466–473. [DOI] [PubMed] [Google Scholar]
- 16.Schmidhuber J Deep Learning in Neural Networks: An Overview. Neural Networks 2015; 61, 85–117. [DOI] [PubMed] [Google Scholar]
- 17.Baldi P, Chauvin Y. Neural Networks for Fingerprint Recognition. Neural Networks 2008; 5 (3). [Google Scholar]
- 18.Simonyan K, Zisserman A. Very deep convolutional networks for large-scale image recognition. arXiv preprint 2014; 1409.1556.
- 19.He K, Zhang X, Ren S, et al. Deep Residual Learning for Image Recognition. IEEE conference on computer vision and pattern recognition 2016; 770–778 [Google Scholar]
- 20.Redmon J, Divvala S, Girshick R, et al. You Only Look Once: Unified, Real-time Object Detection. Proceedings of the IEEE Conference on Computer Vision and Pattern Recognition 2016; 779–788. [Google Scholar]
- 21.Szegedy C, Liu W, Jia Y, et al. Going deeper with convolutions. Proceedings of the IEEE Conference on Computer Vision and Pattern Recognition 2015; 1–9. [Google Scholar]
- 22.Graves A, Mohamed AR, Hinton G. Speech recognition with deep recurrent neural networks. Acoustics, speech and signal processing 2013; 6645–6649. [Google Scholar]
- 23.Wu Y, Schuster M, Chen Z, et al. Google’s neural machine translation system: Bridging the gap between human and machine translation. arXiv preprint 2016; 1609.08144.
- 24.Silver D, Huang A, Maddison C, et al. Mastering the game of Go with deep neural networks and tree search. Nature 2016; 529, 484–489. [DOI] [PubMed] [Google Scholar]
- 25.Wu L, Baldi P. Learning to play GO using recursive neural networks. Neural Networks 2008; 21, 9, 1392–1400. [DOI] [PubMed] [Google Scholar]
- 26.Baldi P, Sadowski P, Whiteson D. Searching for exotic particles in high-energy physics with deep learning. Nature Communications 2014; 5, 4308. [DOI] [PubMed] [Google Scholar]
- 27.Shimmin C, Sadowski P, Baldi P, et al. Decorrelated Jet Substructure Tagging Using Adversarial Neural Network. Physical Review D 2017; 96, 074034. [Google Scholar]
- 28.Fooshee D, Mood A, Gutman E, et al. Deep Learning for Chemical Reaction Prediction, Mol. Syst. Des. Eng 2017; 10.1039/C7ME00107J [DOI] [Google Scholar]
- 29.Di Lena P and Nagata K and Baldi, P. Deep Architectures for Protein Contact Map Prediction. Bioinformatics 2012; 28 2449–2457. [DOI] [PMC free article] [PubMed] [Google Scholar]
- 30.Wang J, Fang Z, Lang N, et al. A Multi-Resolution Approach for Spinal Metastasis Detection using Deep Siamese Neural Networks. Computers in Biology and Medicine 2017; 84, 137–146 [DOI] [PMC free article] [PubMed] [Google Scholar]
- 31.Wang J, Ding H, Azamian F, et al. Detecting Cardiovascular Disease from Mammograms with Deep Learning. IEEE Transactions on Biomedical Imaging 2017; 36, 5, 1172–1181. [DOI] [PMC free article] [PubMed] [Google Scholar]
- 32.Chang P, Su L, Baldi P, et al. Deep learning convolutional neural networks accurately classify genetic mutations in gliomas. American Journal of Neuroradiology 2018; in press. [DOI] [PMC free article] [PubMed] [Google Scholar]
- 33.Esteva A, Kuprel B, Novoa R, et al. Dermatologist-level classification of skin cancer with deep neural networks. Nature 2017; 542, 7639, 115–118. [DOI] [PMC free article] [PubMed] [Google Scholar]
- 34.Baldi P Deep Learning in Biomedical Data Science. Annual Review of Biomedical Data Science 2018; in press. [Google Scholar]
- 35.Russakovsky O, Deng J, Su H, et al. ImageNet Large Scale Visual Recognition Challenge. International Journal of Computer Vision (IJCV) 2015. [Google Scholar]
- 36.Ioffe S, Szegedy C. Batch Normalization: Accelerating Deep Network Training by Reducing Internal Covariate Shift. arXiv preprint 2015; 1502.03167.
- 37.Szegedy C, Vanhoucke V, Ioffe S, et al. Rethinking the Inception Architecture for Computer Vision. Proceedings of the IEEE Conference on Computer Vision and Pattern Recognition 2016; 2818–2826. [Google Scholar]
- 38.Keras Chollet F.. GitHub 2015.
- 39.Abadi M, Agarwal A, Barham P, et al. TensorFlow: Large-scale machine learning on heterogeneous systems, 2015. Software available from tensorflow.org.
- 40.Hinton GE, Srivastava N, Krizhevsky A, et al. Improving neural networks by preventing co-adaptation of feature detectors. arXiv preprint 2012; 1207.0580.
- 41.Baldi P, Sadowski P. The dropout learning algorithm. Artificial intelligence 2014; 210, 78–122. [DOI] [PMC free article] [PubMed] [Google Scholar]
- 42.Chatfield K, Simonyan K, Vedaldi A, et al. Return of the devil in the details: Delving deep into convolutional nets. arXiv preprint 2014; 1405.3531.
- 43.Bernal J, Sánchez J, Vilarino F. Towards automatic polyp detection with a polyp appearance model. Pattern Recognition 2012; 45 3166–3182. [Google Scholar]
- 44.Ribeiro E, Uhl A, Häfner M. Colonic polyp classification with convolutional neural networks. IEEE 29th International Symposium on Computer-Based Medical Systems 2016; 253–258. [Google Scholar]
- 45.Soetikno R, Friedland S, Kaltenbach T, et al. Nonpolypoid (Flat and Depressed) Colorectal Neoplasms. Gastroenterology 2006; Volume 130, Issue 2, 566–576 [DOI] [PubMed] [Google Scholar]
- 46.Park SY, Sargent D. Colonoscopic polyp detection using convolutional neural networks. SPIE Medical Imaging 2016; 978528–978528. [Google Scholar]
- 47.Bernal J, Tajkbaksh N, Sánchez F, et al. Comparative Validation of Polyp Detection Methods in Video Colonoscopy: Results from the MICCAI 2015 Endoscopic Vision Challenge. IEEE Transactions on Medical Imaging 2017; 36, 1231–1249. [DOI] [PubMed] [Google Scholar]
- 48.Olympus Annual Report 3 (2018); https://www.olympus-global.com/ir/data/annualreport/pdf/ar2017e_A3.pdf
Associated Data
This section collects any data citations, data availability statements, or supplementary materials included in this article.