

Abstract
Background
Hyperintensities in the splenium of the corpus callosum (CCS) have been proposed as a radiographic diagnostic criterion for fragile X‐associated tremor ataxia syndrome (FXTAS).
Methods
Magnetic resonance images from patients with FXTAS and from nonpremutation carriers with movement disorders were viewed by a radiologist who was blinded to gene status, and radiographic criteria for FXTAS were scored. Phenotypic data used for diagnosis of FXTAS also were collected.
Results
Twenty‐two patients with FXTAS and 23 controls were included. Hyperintensity in the CCS (the CCS sign) was more common in men with FXTAS versus controls (87% vs. 40%) but not in women with FXTAS (100% vs. 50% in controls). The CCS sign had higher sensitivity compared with the middle cerebellar peduncle sign (white matter lesions in middle cerebellar peduncle) in both men (0.87 vs. 0.67) and women (1 vs. 0.29) with FXTAS, but it had lower specificity in both men (0.6 vs. 0.8) and women (0.5 vs. 1).
Conclusions
The CCS sign is common in patients with FXTAS, but it is not significantly more prevalent in women with FXTAS compared with controls. This may be due to small sample sizes in the current study. Other signs, such as brainstem white matter disease, were more common in women with FXTAS and differed from those in men with FXTAS. This finding suggests that additional studies evaluating the diagnostic criteria for FXTAS need to be conducted, ideally with neuropathological confirmation of the disease.
Keywords: fragile X‐associated tremor ataxia syndrome, fragile X mental retardation 1 (FMR1), middle cerebellar peduncle, magnetic resonance imaging, splenium of the corpus callosum
Fragile X‐associated tremor ataxia syndrome (FXTAS) is a movement disorder associated with a premutation range expansion (55–200 CGG repeats) in the promoter region of the fragile X mental retardation 1 (FMR1) gene.1 Patients with FXTAS demonstrate various motor and cognitive symptoms, including intention tremor, cerebellar gait ataxia, parkinsonism, and executive dysfunction.2 Diagnostic criteria for FXTAS were proposed in 2003 and require several clinical and radiological findings in an FMR1 premutation carrier.3 Radiological criteria include a major criterion of magnetic resonance imaging (MRI) white matter lesions in the brainstem or in the middle cerebellar peduncle (MCP), called the “MCP sign.” Minor radiological criteria include MRI cerebral white matter lesions and moderate to severe generalized brain atrophy.
The MCP sign was first described in 2002 in a study of 17 patients with FXTAS who underwent MRI.4 In that study, 14 of 17 patients (and none of the controls) demonstrated relatively symmetric increased signal intensity on T2‐weighted images and sequences extending into the MCP. The specificity of this sign made it appealing as a diagnostic criterion.3 A more recent study described 22 patients with FXTAS and demonstrated T2‐weighted hyperintensities in the splenium of the corpus callosum (CCS), termed the “CCS sign,” in patients who had FXTAS with nearly the same frequency as the MCP sign (68% vs. 64%, respectively).5 The purpose of the current study was to compare the frequency of CCS hyperintensities in individuals with FXTAS versus a disease control group of patients who had other movement disorders and were not FMR1 premutation carriers.
Patients and Methods
There were 2 sources of patients for this study. The first source was a cohort of FMR1 premutation carriers with a diagnosis of FXTAS who were receiving care in the Rush University Medical Center (RUMC) FXTAS Clinic or had been included in prior FMR1 premutation‐related studies at RUMC. The second source included individuals who had participated specifically in an MRI study at RUMC designed to investigate abnormalities in FMR1 carriers who had FXTAS compared with healthy controls. Both sources included FMR1 premutation carriers and noncarriers. Patients defined as “cases” were FMR1 premutation carriers who had a diagnosis of possible, probable, or definite FXTAS according to published diagnostic criteria.3 Disease controls were patients who were part of larger screening study for FMR1 expansions in patients with tremor, ataxia, or parkinsonism who had normal FMR1 testing (<41 CGG repeats). The controls were matched to the cases by age (within 5 years) and sex.
The MRIs included in this study had been obtained for clinical purposes either at RUMC or at outside imaging facilities. Most of the MRIs were digital rather than on film. Demographic information was collected on each patient, including the following: age, sex, race, ethnicity, and FMR1 repeat size. The FXTAS Rating Scale score,6 which is a composite scale that measures tremor, ataxia, and parkinsonism, was collected for each patient. The presence of each of the major and minor clinical diagnostic criterion for movement disorders from the FXTAS diagnostic criteria was recorded: intention tremor (major), cerebellar gait ataxia (major), and parkinsonism (minor). Most patients lacked complete neuropsychological testing but had Mini‐Mental State Examination7 scores available. A neuroradiologist (M.J.) who was blinded to each patient's gene status was asked to review the images using a standardized form to record the major and minor imaging findings required for a diagnosis of FXTAS: white matter lesions in the MCP, brainstem white matter lesions, cerebral white matter lesions, and moderate to severe generalized atrophy. In addition, the neuroradiologist was asked to record the presence or absence of white matter lesions in the CCS. This study was approved by the RUMC Institutional Review Board, and all patients signed informed consent.
Analyses were performed separately for men and women, because previous studies suggested a difference in prevalence rates of the signs in men versus women with FXTAS. Demographics were summarized and compared between groups using t tests, Mann‐Whitney U tests, or χ2 tests, as appropriate. The difference in relative frequency of the radiological signs (white matter lesions in the MCP, brainstem white matter lesions, cerebral white matter lesions, moderate to severe generalized atrophy, and white matter lesions in the CCS) between patients with FXTAS and disease controls were compared using χ2 analyses. Sensitivity and specificity were calculated for each radiological sign.
Results
Twenty‐two patients with FXTAS (68% men; mean number of CGG repeats, 89) and 23 controls (65% men; mean number of CGG repeats, 29) were included (Tables 1 and 2). Both groups were predominantly white, non‐Hispanic, and had a mean ±standard deviation age at imaging of 67.5 ± 6 years in the FXTAS group and 64.7 ± 12.4 years in the control group. In the FXTAS group, 9 patients met the criteria for definite FXTAS, 10 had probable FXTAS, and 3 had possible FXTAS. The diagnoses in the control group (n = 23) were Parkinson's disease (PD) (n = 7), PD with kinetic tremor (n = 1), PD with kinetic tremor and ataxia (n = 1), possible multiple system atrophy cerebellar type (n = 2), spinocerebellar ataxia (n = 2), ataxia with parkinsonism (n = 2), ataxia with chorea (n = 1), ataxia with palatal tremor (n = 1), and ataxia with dementia (n = 1). Three patients with ataxia had genetic testing with a full ataxia panel that was negative. Patients with FXTAS had a mean duration of disease of 80 ± 64 months. The median interval (interquartile range [IQR]) between administration of the FXTAS Rating Scale and MRI was 7 months (IQR, 12.5 months) in cases and 14 months (IQR, 26 months) in controls (U = 414.5; P = 0.18).
Table 1.
Demographics of Men
| Variable | No. of Men (%) | P Value | |
|---|---|---|---|
| Controls, N = 15 | Cases/Carriers, N = 15 | ||
| Age at MRI: Mean ± SD, y | 67.5 ± 10.3 | 66.1 ± 6.1 | 0.67 |
| No. of CGG repeats: Mean ± SD | 27.9 ± 4.0 | 92.3 ± 23.3 | <0.0001 |
| FXTAS rating scale score: Mean ± SD | 29.7 ± 23.9 | 52.1 ± 32.4 | 0.04 |
| Mini‐Mental State Examination score: Mean ± SD | 27.7 ± 2.9a | 27.6 ± 2.0b | 0.97 |
| Months between MRI and FXTAS rating scale: Median [IQR] | 9 [24] | 2 [10.5]c | 0.44 |
| FXTAS diagnosis at time of MRI, n (%) | |||
| (0) No | 15 (100) | 0 (0) | |
| (1) Possible FXTAS | 3 (20) | ||
| (2) Probable FXTAS | 5 (33.3) | ||
| (3) Definite FXTAS | 7 (46.7) | ||
| Other diagnoses, n (%) | |||
| PD | 0 (0)d | 6 (85.7)e | |
| Ataxia | 5 (41.7) | 0 (0) | |
| ET | 1 (8.3) | 0 (0) | |
| Ataxia + ET | 2 (16.7) | 0 (0) | |
| PD + ET + ataxia | 2 (16.7) | 1 (14.3) | |
| Myoclonus + ET + ataxia | 1 (8.3) | 0 (0) | |
| Chorea + ataxia | 1 (8.3) | 0 (0) | |
MRI, magnetic resonance imaging; SD, standard deviation; FXTAS, fragile X‐associated tremor/ataxia syndrome; IQR, interquartile range; PD, Parkinson's disease; ET, essential tremor.
Six men were missing information in this group.
Seven men were missing information in this group.
Two men were missing information in this group.
Three men were missing information in this group.
Eight men were missing information in this group (the remaining men were normal, healthy controls).
Table 2.
Demographics of Women
| Variable | No. of Women (%) | P Value | |
|---|---|---|---|
| Controls, N = 8 | Cases/Carriers, N = 7 | ||
| Age at MRI: Mean ± SD, y | 59.5 (15) | 69.9 (5.6) | 0.1 |
| CGG repeats: Mean ± SD, n | 30.1 (4.8) | 84.9 (12.3) | <0.0001 |
| FXTAS rating scale score: Mean ± SD | 32 (18.5) | 25 (14.7) | 0.44 |
| Mini‐Mental State Examination status: Mean ± SD | 26.4 (2.6)a | 26.4 (3.2) | 0.99 |
| Months between MRI and FXTAS rating scale: Median [IQR] | 20.5 [24.5] | 13 [20] | 0.4 |
| FXTAS diagnosis at time of MRI, n (%) | |||
| (0) No | 8 (100) | 0 (0) | |
| (1) Possible FXTAS | 0 (0) | ||
| (2) Probable FXTAS | 5 (71.4) | ||
| (3) Definite FXTAS | 2 (28.6) | ||
| Other diagnoses, n (%) | |||
| PD | 1 (12.5) | 1 (25)b | |
| Ataxia | 2 (25) | 1 (25) | |
| ET | 4 (50) | 0 (0) | |
| PD + ataxia | 0 (0) | 1 (25) | |
| Ataxia + ET | 0 (0) | 1 (25) | |
| Chorea + ataxia | 1 (12.5) | 0 (0) | |
MRI, magnetic resonance imaging; SD, standard deviation; FXTAS, fragile X‐associated tremor/ataxia syndrome; IQR, interquartile range; PD, Parkinson's disease; ET, essential tremor.
Three women were missing information in this group.
Three women were missing information in this group (the remaining women were normal, healthy controls).
Most imaging findings that were consistent with diagnostic criteria for FXTAS were more frequent among men, but not among women, in the FXTAS group (Tables 3 and 4). The MCP sign was observed in 67% of men with FXTAS and in 20% of matched controls (P = 0.01), and brainstem white matter disease was observed in 53% of men with FXTAS compared with 27% of matched controls (P = 0.14) (Fig. 1). The MCP sign was observed in 29% of women with FXTAS and in 0% of matched controls (P = 0.2), and brainstem white matter disease was observed in 86% of women with FXTAS compared with 25% of matched controls (P = 0.04) (Fig. 1). Cerebral atrophy was present in 53% of men with FXTAS and 7% of controls (P = 0.01), and it was present in 43% of women with FXTAS and 38% of controls (P = 1.0). Cerebral white matter disease was present in 73% of men with FXTAS compared with 60% of controls (P = 0.44); and it was more common in women with FXTAS (100%) compared with controls (50%; P = 0.08). Hyperintensities in the CCS were more common in men with FXTAS (87%) compared with controls (40%; P = 0.01) but were not significantly increased in women with FXTAS (100%) compared with controls (50%; P = 0.08) (Fig. 2). None of the original clinical neuroradiology reports noted hyperintensity in the CCS. All patients who had the MCP sign also had the CCS sign. Among the men with FXTAS, the CCS sign had higher sensitivity than the MCP sign (0.87 vs. 0.67), but it had lower specificity (0.6 vs. 0.8, respectively) (Table 5). Among the women with FXTAS, the CCS sign also had higher sensitivity than the MCP sign (1.0 vs. 0.29) and lower specificity (0.5 vs. 1.0, respectively) (Table 6).
Table 3.
Differences in the Occurrence of Specific Phenotypic and Radiological Signs in Cases and Controls for Men
| Variable | No. of Men (%) | P Value | |
|---|---|---|---|
| Controls, N = 15 | Cases/Carriers, N = 15 | ||
| Intention tremor | 3 (20) | 13 (92.9)a | <0.0001 |
| Gait ataxia | 4 (26.7) | 13 (86.7) | 0.001 |
| Parkinsonism | 11 (73.3) | 12 (85.7)a | 0.41 |
| Memory deficit | 4 (33.3)b | 6 (54.6)c | 0.31 |
| CCS sign | 6 (40) | 13 (86.7) | 0.01 |
| Brainstem white matter disease | 4 (26.7) | 8 (53.3) | 0.14 |
| MCP sign | 3 (20) | 10 (66.7) | 0.01 |
| Cerebral atrophy | 1 (6.7) | 8 (53.3) | 0.01 |
| Cerebral white matter disease | 9 (60) | 11 (73.3) | 0.44 |
CCS, splenium of the corpus callosum; MCP, middle cerebellar peduncle.
One man was missing information in this group.
Three men were missing information in this group.
Four men were missing information in this group.
Table 4.
Differences in the Occurrence of Specific Phenotypic and Radiological Signs in Cases and Controls for Women
| Variable | No. of Women (%) | P Value | |
|---|---|---|---|
| Controls, N = 8 | Cases/Carriers, N = 7 | ||
| Intention tremor | 0 (0) | 7 (100) | 0.0002 |
| Gait ataxia | 5 (62.5) | 6 (85.7) | 0.57 |
| Parkinsonism | 2 (25) | 6 (85.7) | 0.04 |
| Memory deficit | 1 (14.3)a | 3 (42.9) | 0.56 |
| CCS sign | 4 (50) | 7 (100) | 0.08 |
| Brainstem white matter disease | 2 (25) | 6 (85.7) | 0.04 |
| MCP sign | 0 (0) | 2 (28.6) | 0.2 |
| Cerebral atrophy | 3 (37.5) | 3 (42.9) | 1.0 |
| Cerebral white matter disease | 4 (50) | 7 (100) | 0.08 |
CCS, splenium of the corpus callosum; MCP, middle cerebellar peduncle.
One woman was missing information in this group.
Figure 1.
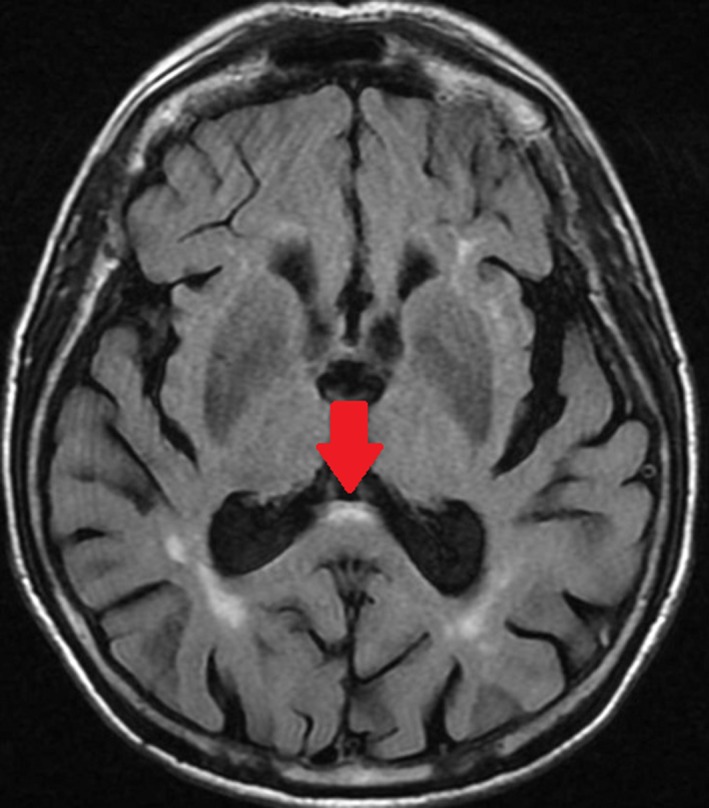
Axial, fluid‐attenuated, inversion‐recovery magnetic resonance image from a woman aged 79 years who had fragile X‐associated tremor ataxia syndrome (with CGG repeat sizes of 82 and 30), which manifested as tremor, ataxia, and dementia, demonstrates the corpus callosum splenium sign (arrow).
Figure 2.
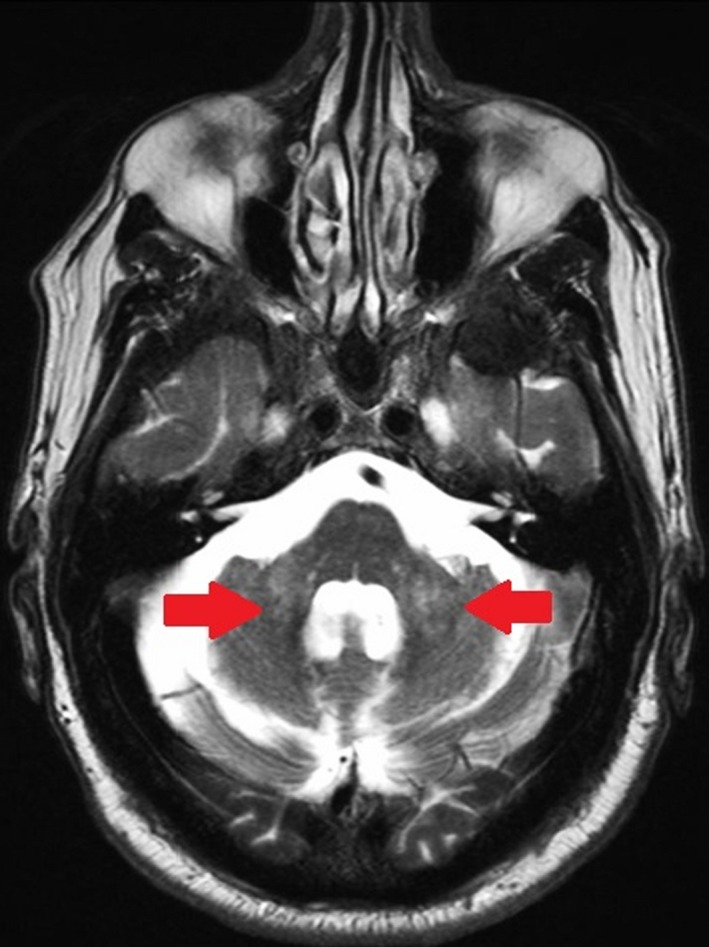
Axial, T2‐weighted magnetic resonance image from a man aged 70 years with fragile X‐associated tremor ataxia syndrome who presented with tremor, ataxia, and cognitive decline demonstrates the middle cerebellar peduncle sign (arrows).
Table 5.
Sensitivity and Specificity of Radiological Signs in Men
| Radiological Sign | Sensitivity (95% CI) | Specificity (95% CI) |
|---|---|---|
| CCS sign | 0.87 (0.6–0.98) | 0.6 (0.32–0.84) |
| MCP sign | 0.67 (0.38–0.88) | 0.8 (0.52–0.96) |
| Brainstem white matter disease | 0.53 (0.27–0.79) | 0.73 (0.45–0.92) |
| Cerebral atrophy | 0.53 (0.27–0.79) | 0.93 (0.68–0.998) |
| Cerebral white matter disease | 0.73 (0.45–0.92) | 0.4 (0.16–0.68) |
CI, confidence interval; CCS, splenium of the corpus callosum; MCP, middle cerebellar peduncle.
Table 6.
Sensitivity and Specificity of Radiological Signs in Women
| Radiological Sign | Sensitivity (95% CI) | Specificity (95% CI) |
|---|---|---|
| CCS sign | 1.00 (0.59–1.00) | 0.50 (0.16–0.83) |
| MCP sign | 0.29 (0.04–0.71) | 1.00 (0.63–1.00) |
| Brainstem white matter disease | 0.86 (0.42–0.996) | 0.75 (0.35–0.97) |
| Cerebral atrophy | 0.43 (0.1–0.82) | 0.63 (0.24–0.91) |
| Cerebral white matter disease | 1.00 (0.59–1.00) | 0.50 (0.16–0.84) |
CI, confidence interval; CCS, splenium of the corpus callosum; MCP, middle cerebellar peduncle.
Discussion
Men with FXTAS had a higher prevalence of cerebral atrophy and hyperintensities in the CCS and MCP compared with age‐matched controls, but women with FXTAS only had a higher prevalence of brainstem white matter disease. Although cerebral atrophy and hyperintensities in the MCP and brainstem are current diagnostic criteria for FXTAS, the CCS sign is not widely recognized as a radiological manifestation of FXTAS. Previous investigators proposed adding the CCS sign as a diagnostic criterion for FXTAS.5, 8 Our study suggests that the CCS sign has higher sensitivity but lower specificity than the MCP sign. It also was not significantly more prevalent in women with FXTAS compared with matched controls. Thus, additional studies are warranted to determine its clinical utility.
It has been demonstrated that cerebral and cerebellar volumes in individuals with FXTAS are significantly decreased compared with the volumes in age‐matched and sex‐matched, normal controls,9, 10, 11 and total and cerebral volume reductions are correlated with CGG repeat size.12 Prominent volume loss has been noted in the dorsomedial frontal and parietal regions, insula, medial temporal regions, and lateral prefrontal regions.13 Studies have also noted structural abnormalities of the corpus callosum in FXTAS, including thinning4 and reduced fractional anisotropy13 (FA). Interestingly, FA exhibited significantly reduced structural connectivity of the corpus callosum, which is associated with increasing FXTAS symptom severity.14 The CCS findings presented here may correlate well with FXTAS symptomatology based on the known function of the corpus callosum.
The corpus callosum is the largest and most important commissure of the neocortex, containing an estimated 200 million fibers. The structure is divided into an anterior third (rostrum, genu, and rostral body), an anterior mid‐body, posterior mid‐body, isthmus, and splenium.15 The anterior portion of the splenium contains thin, late‐myelinating fibers from parietal and medial temporal association areas, whereas the posterior portion of the splenium contains early myelinating fibers linking primary and secondary visual areas.16 In Alzheimer's disease and in patients who have mild cognitive impairment, there is significant reduction in the size of the CCS compared with controls, and this atrophy appears to occur very early in the dementing process.17 Additional studies have shown that the annual rate of atrophy of the CCS in Alzheimer's disease is 7% volume reduction per year.18 It appears that the white matter hyperintensity accrual in the CCS predicts mobility decline in the elderly,19 which is the rationale for the addition of age to the analysis plan a priori in this study. Increasing reliance on visual and/or spatial inputs during motor performance in normal aging might explain why this function (mobility) is particularly sensitive to damage in the CCS.19
Although mobility decline in the elderly has been associated with white matter hyperintensities in the CCS, the prominent movement disorders in FXTAS—ataxia, parkinsonism, and tremor—have not been associated with these lesions. This suggests that the CCS sign may be diagnostically helpful in distinguishing FXTAS from other movement disorders. One of the strengths of this study is that the control group was comprised of patients who had other movement disorders, further supporting this argument. The published diagnostic criteria for FXTAS have never been validated formally. Our data suggest that the CCS sign has higher sensitivity but lower specificity in FXTAS, indicating that there will be an increase in false‐positive results if it is added as a diagnostic criterion. The CCS sign also was not significantly increased in women who had FXTAS compared with matched controls. However, this may be due to the small sample sizes when data were analyzed according to sex in our study. The women with FXTAS in our study did have significantly higher rates of cerebral white matter disease and parkinsonism compared with the control women, which was not observed in the men with FXTAS, and this supports the need for different diagnostic criteria for women with FXTAS. A large prospective study is warranted to evaluate the validity of the diagnostic criteria compared with neuropathological confirmation of FXTAS, and the inclusion of the CCS sign should be revisited in the setting of the other diagnostic criteria.
Author Roles
(1) Research Project: A. Conception, B. Organization, C. Execution; (2) Statistical Analysis: A. Design, B. Execution, C. Review and Critique; (3) Manuscript Preparation: A. Writing of the First Draft, B. Review and Critique.
D.A.H.: 1A, 1B, 1C, 2A, 2C, 3A, 3B
M.H.: 1A, 1B, 1C, 3A, 3B
E.D.: 1A, 1B, 1C, 3A, 3B
G.S.: 1C, 2A, 2B, 2C, 3B
D.M.: 1C, 3B
B.O.: 2A, 2B, 2C, 3B
E.B.K.: 1C, 3B
M.J.: 1A, 1B, 1C, 3B
Disclosures
Ethical Compliance Statement: We confirm that we have read the Journal's position on issues involved in ethical publication and affirm that this work is consistent with those guidelines.
Funding Sources and Conflicts of Interest: The authors report no sources of funding and conflicts of interest. This work was funded by NS052487 (D.A.H.) and the Morrison Family.
Financial Disclosures for previous 12 months: D.A.H. received grant support from the National Institute of Neurological Disorders and Stroke, the Parkinson Disease Foundation, and the Shapiro Foundation and research support from Pfizer and Neurocrine Biosciences, Inc. M.H. reports consultant fees and book royalties from Elsevier‐Amrisys. G.S. Reports consulting fees and advisory board membership with honoraria from Acadia Pharmaceuticals, Adamas Pharmaceuticals, Inc., Ceregene, Inc., CHDI Management, Inc., Ingenix Pharmaceutical Services (i3 Research), Neurocrine Biosciences, Inc., and Pfizer, Inc.; grants and research support from the National Institutes of Health, the Michael J. Fox Foundation for Parkinson's Research, the Dystonia Coalition, CHDI, and the International Parkinson and Movement Disorder Society; and honoraria from the International Parkinson and Movement Disorder Society, the American Academy of Neurology, the Michael J. Fox Foundation for Parkinson's Research. E.B.K. reports research support from Seaside Therapeutics, Novartis, Roche, Alcobra, Neuren, Neurotrope Pharmaceuticals, Vtesse, and Asuragen Inc. E.D., D.M., and B.O. report no sources of funding and no conflicts of interest.
Acknowledgments
We thank the patients who participated in this study.
Relevant disclosures and conflicts of interest are listed at the end of this article.
References
- 1. Hagerman RJ, Leehey M, Heinrichs W, et al. Intention tremor, parkinsonism, and generalized brain atrophy in male carriers of fragile X. Neurology 2001;57:127–130. [DOI] [PubMed] [Google Scholar]
- 2. Jacquemont S, Hagerman RJ, Leehey MA, et al. Penetrance of the fragile X‐associated tremor/ataxia syndrome in a premutation carrier population. JAMA 2004;291:460–469. [DOI] [PubMed] [Google Scholar]
- 3. Jacquemont S, Hagerman RJ, Leehey M, et al. Fragile X premutation tremor/ataxia syndrome: molecular, clinical, and neuroimaging correlates. Am J Hum Genet 2003;72:869–878. [DOI] [PMC free article] [PubMed] [Google Scholar]
- 4. Brunberg JA, Jacquemont S, Hagerman RJ, et al. Fragile X premutation carriers: characteristic MR imaging findings of adult male patients with progressive cerebellar and cognitive dysfunction. AJNR Am J Neuroradiol 2002;23:1757–1766. [PMC free article] [PubMed] [Google Scholar]
- 5. Apartis E, Blancher A, Meissner WG, et al. FXTAS: new insights and the need for revised diagnostic criteria. Neurology 2012;79:1898–1907. [DOI] [PubMed] [Google Scholar]
- 6. Leehey M, Berry‐Kravis E, Goetz C, et al. FMR1 CGG repeat length predicts motor dysfunction in premutation carriers. Neurology 2008;70:139–142. [DOI] [PMC free article] [PubMed] [Google Scholar]
- 7. Folstein MF, Robins LN, Helzer JE. The Mini‐Mental State Examination. Arch Gen Psychiatry 1983;40:812. [DOI] [PubMed] [Google Scholar]
- 8. Renaud M, Perriard J, Coudray S, et al. Relevance of corpus callosum splenium versus middle cerebellar peduncle hyperintensity for FXTAS diagnosis in clinical practice. J Neurol 2015;262:435–442. [DOI] [PubMed] [Google Scholar]
- 9. Cohen S, Masyn K, Adams J, et al. Molecular and imaging correlates of the fragile X‐associated tremor/ataxia syndrome. Neurology 2006;67:1426–1431. [DOI] [PubMed] [Google Scholar]
- 10. Moore CJ, Daly EM, Tassone F, et al. The effect of pre‐mutation of X chromosome CGG trinucleotide repeats on brain anatomy. Brain 2004;127:2672–2681. [DOI] [PubMed] [Google Scholar]
- 11. Loesch DZ, Litewka L, Brotchie P, Huggins RM, Tassone F, Cook M. Magnetic resonance imaging study in older fragile X premutation male carriers. Ann Neurol 2005;58:326–330. [DOI] [PubMed] [Google Scholar]
- 12. Adams JS, Adams PE, Nguyen D, et al. Volumetric brain changes in females with fragile X‐associated tremor/ataxia syndrome (FXTAS). Neurology 2007;69:851–859. [DOI] [PubMed] [Google Scholar]
- 13. Hashimoto R, Javan AK, Tassone F, Hagerman RJ, Rivera SM. A voxel‐based morphometry study of grey matter loss in fragile X‐associated tremor/ataxia syndrome. Brain 2011;134:863–878. [DOI] [PMC free article] [PubMed] [Google Scholar]
- 14. Wang JY, Hessl D, Schneider A, Tassone F, Hagerman RJ, Rivera SM. Fragile X‐associated tremor/ataxia syndrome: influence of the FMR1 gene on motor fiber tracts in males with normal and premutation alleles. JAMA Neurol 2013;70:1022–1029. [DOI] [PMC free article] [PubMed] [Google Scholar]
- 15. Kust J, Karbe H. Corpus callosum In: Aminoff M, Daroff R, eds. Encyclopedia of the Neurological Sciences. San Diego, CA: Elsevier; 2003:771–774. [Google Scholar]
- 16. Knyazeva MG. Splenium of corpus callosum: patterns of interhemispheric interaction in children and adults [serial online]. Neural Plast 2013;2013:639430. [DOI] [PMC free article] [PubMed] [Google Scholar]
- 17. Wang PJ, Saykin AJ, Flashman LA, et al. Regionally specific atrophy of the corpus callosum in AD, MCI and cognitive complaints. Neurobiol Aging 2006;27:1613–1617. [DOI] [PMC free article] [PubMed] [Google Scholar]
- 18. Teipel SJ, Bayer W, Alexander GE, et al. Progression of corpus callosum atrophy in Alzheimer disease. Arch Neurol 2002;59:243–248. [DOI] [PubMed] [Google Scholar]
- 19. Moscufo N, Wolfson L, Meier D, et al. Mobility decline in the elderly relates to lesion accrual in the splenium of the corpus callosum. Age (Dordr) 2012;34:405–414. [DOI] [PMC free article] [PubMed] [Google Scholar]