

Abstract
Background
The study of complex neurodegenerative diseases is moving away from hypothesis‐driven biological methods toward large scale multimodal approaches, requiring standardized collaborative efforts. Enroll‐HD exemplifies such an integrated clinical research platform, designed and implemented to meet the research and clinical needs of Huntington's disease (HD). The aim of this study was to describe the unique organization of Enroll‐HD and report baseline data analyses of its core study.
Methods
The Enroll‐HD platform incorporates electronic data capture, biosampling, and a longitudinal observational study spanning four continents (ClinicalTrials.gov Identifier: NCT01574053). The primary study population includes HD gene expansion carriers (HDGECs; CAG expansion ≥36), subdivided into manifest/premanifest HD. The control population consists of genotype‐negative first‐degree relatives and family controls not genetically related. The study includes 10 core clinical assessments covering motor, cognitive, and behavioral domains.
Results
This data set comprises 1,534 participants (HDGEC = 1,071; controls = 463). Participant retention was high; 42 participants prematurely withdrew from the study. Mean ± standard deviation SD CAG repeat size was 43.5 ± 3.5 for HDGECs and 19.8 ± 3.4 for controls. Motor and behavioral assessments identified numerical differences between controls and HDGECs (manifest > premanifest > controls). Functional and independence assessments were generally similar for the premanifest and control groups with overlap in range of scores obtained. For the majority of cognitive tests, there were large differences between participants with manifest HD and all other groups.
Conclusions
These first data from the Enroll‐HD clinical research platform demonstrate the maturity and potential of the platform in collecting high‐quality, clinically relevant data. Future data sets will be substantially larger as the platform expands longitudinally and regionally.
Keywords: Huntington's disease, research platform, observational study
The Organization for Economic Co‐operation and Development (OECD) considers clinical research platforms (large‐scale data collection, data analysis, and data sharing that are interoperable by investigators worldwide) to be a critical missing link in the development of therapeutics for neurodegenerative disorders.1 Enroll‐HD is the only fully integrated clinical research platform operating in the field of neurology and has been designed and implemented to meet the research and clinical needs of Huntington's disease (HD).
HD is a relatively rare monogenetic inherited disorder. Based on meta‐analytic data, the prevalence of manifest (symptomatic) HD is estimated to be 5.7 per 100,000 of the population in the Western population (Europe, North America, and Australia) and 0.4 per 100,000 in Asia.2 The size of the population “at risk” of inheriting the disease (first‐degree relatives of HD patients with unknown genetic status) is thought to be higher, with estimates for the Western population between 30 and 44.9 per 100,000.3 As such, global collaboration is required to identify a sufficient number of HD gene expansion carriers (HDGECs) and appropriate controls for conclusive study, and this is especially important in genetic studies that rely on access to large sample sizes for sufficient statistical power to detect genetic modifiers of disease.4 The underlying idea of Enroll‐HD is to facilitate cooperation and collaboration while developing synergies within the research, clinical, and support communities.
The main objectives of Enroll‐HD are to (1) improve the design and expedite the recruitment and execution of clinical studies and trials, (2) improve our understanding of HD and identify factors influencing disease progression, and (3) foster good clinical care and help improve the health of people with HD. At its core, the Enroll‐HD platform includes an ongoing, prospective, open‐ended, globally standardized, longitudinal, observational study of HD. To date, this study includes over 8,000 participants enrolled in 125 sites located in 13 countries across four continents. We describe here the unique organization of Enroll‐HD and report baseline data analyses of the study as an illustration of its potential to serve as a research platform.
Materials and Methods
Enroll‐HD Platform Infrastructure
Enroll‐HD has an integrated platform infrastructure designed to ensure that the time, effort, and budget spent on study setup is leveraged for multiple uses, both across sites and for multiple studies at a particular site (Fig. 1). It is executed and funded by the CHDI Foundation, a nonprofit drug development organization exclusively dedicated to HD. CHDI invited experts to serve on the Enroll‐HD Governance Committees that provide global platform oversight.5
Figure 1.
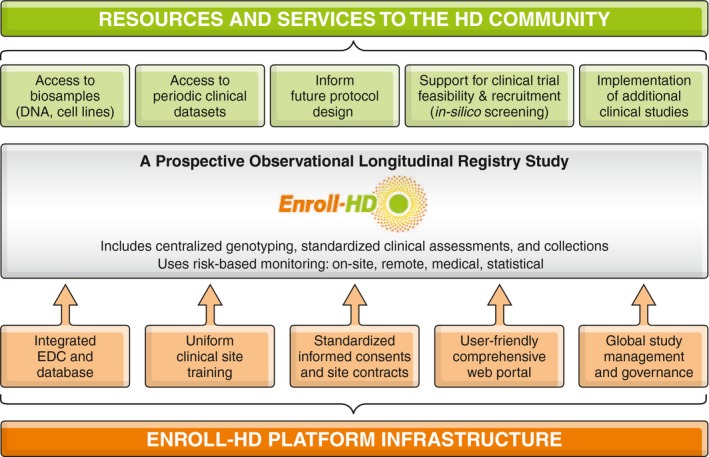
Enroll‐HD platform. Depiction of the infrastructure that makes up the Enroll‐HD platform and the resources/services that are made available to the HD research community.
A key component of Enroll‐HD is the electronic data capture (EDC) system that is designed to collect and monitor data, handle queries, and enable multistudy implementation within a single information technology system. The EDC can be updated in a modular manner, allowing for integration of data from previous and future clinical, genetic, or molecular studies. Another essential component is the web portal, which contains all study manuals, training materials, and electronic case report forms for each participant. All site personnel periodically undergo standardized training and certification on core assessment rating scales.
Enroll‐HD Platform Resources and Services
Enroll‐HD offers a number of resources and services to the HD research community (Fig. 1). Biological samples are stored and distributed according to standard operating procedures; the central repository has no access to identifying clinical data. The centralized collection consists of DNA, lymphoblastoid cell lines, and buffy coat (containing lymphocytes) and can be broadened with specialized collections from future clinical studies implemented within the Enroll‐HD platform. With consent, up to 40 mL of blood is collected at every annual visit providing for longitudinal tracking. All collection logistics and biosample products are integrated with the EDC.
Data are continuously updated, monitored, and accessible by CHDI through the secure database to assist researchers in “in silico screening” and informing clinical trial deisgn. The release of periodic data sets, however, is one of the platform's main public offerings. These data sets can be by accessed by any researcher who is employed by a research institution (academic, governmental, or industrial) through a simple application procedure outlined on http://www.enroll-hd.org.
Ongoing Prospective Observational Longitudinal Registry Study
Recruitment and Informed Consent
Patients with HD and their family members (age ≥18 years) are recruited from specialty clinics. All participants provide written informed consent to take part in the study (including consent for undisclosed research genotyping). Additional optional components that require participant consent include biosampling for banking purposes, family history assessment, linking of clinical information collected in other studies, and willingness to be contacted regarding participation in future studies.
Study Population
The primary study population consists of HDGECs (CAG expansion of ≥36 on the larger allele) and is subdivided into two categories:
Manifest HD: HDGECs with clinical features that, in the opinion of the site investigator, are regarded as diagnostic of HD, taking all signs and symptoms into account. At each visit, investigators are prompted to declare whether the participant is “manifest.” To ensure that categorization of a participant is accurately reflected in the data set, site investigators are queried when the judgement of the motor rater (as reflected in their rating of the Diagnostic Confidence Index [DCI] of the Unified Huntington's Disease Rating Scale [UHDRS]) is not aligned with the all‐inclusive opinion and categorization by the site investigator.
Premanifest HD: HDGECs without clinical features regarded as diagnostic of HD. For this data set, we included in this category all participants that were not considered manifest by the investigator at enrollment or who had a DCI ≤3 (<98% confidence that motor abnormalities are unequival signs of HD).
Any member of a family affected by HD can take part in the study. At study entry, first‐ or second‐degree relatives of an HDGEC participant who do not know their own genetic status are classified as “genotype unknown (at risk).” After data cut, participants in this category are reclassified a posteriori based on the research CAG length of their larger allele, yet this information is not revealed to site investigators or to study participants. Participants with a CAG repeat of <36 are reclassified as genotype negative; participants with a CAG expansion of ≥36, but who are not recorded as having manifest disease, are reclassified as premanifest HD; and participants with a CAG expansion of ≥36 and who have been assessed as having manifest disease are reclassified as manifest HD. Clinical exclusion criteria for the primary population are minimal: Only individuals with choreic movement disorders in the context of a negative test for the HD expansion mutation are excluded.
The control population consists of individuals who do not carry the HD gene expansion and includes three categories:
Genotype negative: first‐ or second‐degree relative of a participant with HD, who is known not to carry the HD expansion mutation.
Family control: family members or individuals not genetically related to HDGECs (e.g., spouses, partners, or caregivers).
Community controls: individuals unrelated to HDGECs who did not grow up in a family affected by HD and who do not have a concurrent neurological disorder. No community controls were included in this first data set.
Research Genotyping
Standardized research genotyping for CAG lengths of both alleles is a core assessment for all participants in Enroll‐HD. CAG lengths are used exclusively for research purposes and are not communicated to investigators or participants. Participants that wish to undergo diagnostic or predictive testing follow existing clinical procedures. For research genotyping, 10 mL of venous blood are sent to a central biorepository facility (BioRep, Milan, Italy) that processes the samples for DNA extraction. Genotyping of the DNA is performed for CAG repeat lengths using two sets of primer pairs6 and size standards as provided by the U.S. National Institute of Standards and Technology.
Clinical Assessments
Annual assessments conducted during study visits may coincide with regularly scheduled clinic visits. The duration of visits ranges from 45 minutes (completion of core assessments only) to a maximum of 2.5 hours (completion of core, extended, and optional assessments). Details of the outcomes collected are provided in Table 1; the full study protocol can be found at http://www.enroll-hd.org.
Table 1.
Enroll‐HD assessments
| Assessments | Core | Extended | Optional |
|---|---|---|---|
| Written informed consent/parental permission/assent | x | ||
| Creation of the unique HD Identification Number (HDID) | x | ||
| Review of inclusion/exclusion criteria | x | ||
| Local diagnostic laboratory CAG report (if available) | x | ||
| Investigator and research genotyping determined classification of subject | x | ||
| Sociodemographic information | x | ||
| HD Clinical Characteristics (HDCC) | x | ||
| Medical history | x | ||
| Comorbid conditions | x | ||
|
Current therapies Pharmacotherapy Nutritional supplements Nonpharmacological therapies |
x | ||
| Reportable event monitoring | x | ||
| UHDRS ‘99 Motor | x | ||
| UHDRS ‘99 Diagnostic Confidence Index | x | ||
| UHDRS ‘99 Total Functional Capacity | x | ||
| UHDRS ‘99 Function Assessment Scale | x | ||
| UHDRS ‘99 Independence Scale | x | ||
| PBA‐s | x | ||
| HADS | x | ||
| SIS | x | ||
| Columbia Suicide Severity Rating Scale (CSSR) | x | ||
| Symbol Digit Modalities Test | x | ||
| Stroop Word Reading | x | ||
| Categorical Verbal Fluency | x | ||
| Stroop Color Naming | x | ||
| Stroop Interference | x | ||
| Trail Making A & B | x | ||
| Letter Verbal Fluency | x | ||
| Mini–Mental State Examination (MMSE) | x | ||
| Timed Up and Go (TUG) | x | ||
| 30‐second Chair Stand Test | x | ||
| Short Form Health Survey‐12 (SF‐12) | x | ||
| Companion Quality of Life Questionnaire | x | ||
| Client Services Receipt Inventory (CSRI) | x | ||
| Work Productivity and Activity Impairment‐Specific Health Problem Questionnaire (WPAI‐SHP) | x | ||
| Research genotyping (conducted at the first visit for all new subjects to the study or for subjects from previous studies for whom a research genotype is not available) | x | ||
| Family history | X | ||
| Biospecimens for biobanking | X |
Data Monitoring
Enroll‐HD implements a risk‐based monitoring strategy to ensure data quality.7 An independent data safety monitoring committee regularly meets to identify discrepancies between CAG testing results from the centralized laboratory (research CAG) and local diagnostic genetic testing. The system is structured to allow research genotyping of at‐risk individuals while avoiding unintended disclosure of results to the participant and the research staff.
Data Analyses
This report details the results of the first preplanned data cut made on 1 January 2015. Results are presented for the 34 currently available variables. A slightly smaller database (with some aggregated data to reduce the risk of participant identification) is also publically available for research at http://www.enroll-hd.org.
Baseline data were examined by participant category (HD manifest, HD premanifest, genotype negative, and family controls). In addition, participants were also categorized into two larger groups: HDGECs and controls.
Participants classified as having manifest HD were further divided into HD stages based on their recorded Unified Huntington's Disease Research Rating Scale Total Functional Capacity (TFC) score and according to the cut‐off points proposed by Shoulson et al.8 In addition, HDGECs were categorized according to disease burden (an indirect measure of HD pathological processes),9 which was estimated using the following formula: disease burden = (allele 1 CAG – 35.5)*age in years.
The statistical analyses of this report are primarily descriptive. Data were analyzed according to participant category, HDGEC vs. control, and geographical region (North America, Europe, Latin America, and Australasia). Mean and standard deviation (mean ± SD) measures were used to summarize continuous variables, and absolute and relative frequencies expressed as percentage (%) are presented for categorical information. Individual items of the Problem Behaviors Assessment‐short form (PBA‐s)10 were grouped into five domains: depression (depressed mood, suicidal ideation, and anxiety); irritability/aggression (angry or aggressive behavior); psychosis (delusions/paranoid thinking, hallucinations); and apathy and executive function (perseverative thinking or behavior, obsessive‐compulsive behaviors). For descriptive purposes, missing data were not replaced and outlier analyses were not performed.
Post‐hoc analyses were conducted to address specific research findings. A two‐sample test for equality of proportions was used to validate regional differences concerning the usage of nonpharmacological therapy and nutritional supplements among premanifest HDGECs. A t test was conducted to test the statistical difference of CAG size for the smaller allele between HDGECs and controls. Spearman's correlation was used to assess the relationship between CAG lengths of the smaller and the larger alleles, as determined from the research genotyping. The significance level assumed for these comparisons was 0.05.
All data were analyzed at a central site in a deidentified manner11; the statistical analyses were performed using SPSS (version 21; SPSS, Inc., Chicago, IL) and R software (version 3.0.3; R Foundation for Statistical Computing, Vienna, Austria).
Results
Participants
A total of 1,534 participants recruited from 61 centers (10 countries) between July 2012 and November 2014 are included in this report. Baseline demographic, medical, genotyping, and clinical information is provided in Tables 2, 3, and 4. A total of 1,276 (83.2%) participants agreed to provide information on their family history of HD and 1,322 (86.2%) were enrolled with consent to link clinical information from previous HD studies. The vast majority of participants also provided samples for biobanking (n = 1,502; 97.9%) and agreed to be contacted regarding future research studies (n = 1,501; 97.8%). Optional extended assessments were dependent on site capabilities and were performed with an average completion rate >50%. At enrollment, 734 (48%) participants were classified as HD manifest, 262 (17%) as HD premanifest, 81 (5%) as genotype negative, 191 (13%) as genotype unknown, and 266 (17%) as family controls. Of those initially classified as genotype unknown, 116 (61%) were reclassified as genotype negative, 70 (37%) as premanifest HD, and 5 (2%) as manifest HD. The large majority (88%) of genotype unknown participants were from North American sites. The final breakdown of participant categories, including regional distribution and stages of manifest participants, is shown in Figure 2.
Table 2.
Baseline demographic, medication, and genotyping information per subject category
| Measure | HDGECs (N = 1,071) | Control (N = 463) | Manifest (N = 739) | Premanifest (N = 332) | Genotype Negative (N = 197) | Family Control (N = 266) |
|---|---|---|---|---|---|---|
| Demographic Information | ||||||
| Age, years, mean ± SD | 49.3 ± 13.6 | 50.1 ± 14.4 | 53.2 ± 12.5 | 40.5 ± 11.8 | 44.7 ± 14.4 | 54.1 ± 13.0 |
| Sex, males, n (%) | 486 (45.4) | 178 (38.4) | 363 (49.1) | 123 (37.0) | 59 (29.9) | 119 (44.7) |
| ISCED education level, n (%) | ||||||
| 0 | — | — | — | — | — | — |
| 1 | 25 (2.3) | 6 (1.3) | 22 (3.0) | 3 (0.9) | 5 (2.6) | 1 (0.4) |
| 2 | 150 (14.0) | 22 (4.8) | 120 (16.3) | 30 (9.0) | 10 (5.1) | 12 (4.5) |
| 3 | 327 (30.6) | 147 (31.8) | 243 (32.9) | 84 (25.3) | 57 (29.1) | 90 (33.8) |
| 4 | 196 (18.3) | 101 (21.9) | 127 (17.2) | 69 (20.8) | 49 (25.0) | 52 (19.5) |
| 5 | 350 (32.7) | 179 (38.7) | 216 (29.3) | 134 (40.4) | 72 (36.7) | 107 (40.2) |
| 6 | 22 (2.1) | 7 (1.5) | 10 (1.4) | 12 (3.6) | 3 (1.5) | 4 (1.5) |
| Ethnicity, n (%) | ||||||
| Caucasian | 960 (89.7) | 372 (80.3) | 667 (90.3) | 293 (88.5) | 150 (76.1) | 222 (83.5) |
| American black | 16 (1.5) | 11 (2.4) | 13 (1.8) | 3 (0.9) | 4 (2.0) | 7 (2.6) |
| Hispanic/Latino | 21 (2.0) | 20 (4.3) | 14 (1.9) | 7 (2.1) | 7 (3.6) | 13 (4.9) |
| Other | 26 (2.4) | 12 (2.6) | 20 (2.7) | 6 (1.8) | 6 (3.0) | 6 (2.3) |
| American Indian | 18 (1.7) | 28 (6.0) | 11 (1.5) | 7 (2.1) | 21 (10.7) | 7 (2.6) |
| Mixed | 15 (1.4) | 12 (2.6) | 8 (1.1) | 7 (2.1) | 9 (4.6) | 3 (1.1) |
| Asian | 14 (1.3) | 8 (1.7) | 6 (0.8) | 8 (2.4) | 0 (0.0) | 8 (3.0) |
| Marital status, n (%) | ||||||
| Single | 245 (22.9) | 64 (13.8) | 143 (19.4) | 102 (30.7) | 55 (27.9) | 9 (3.4) |
| Married | 82 (7.7) | 46 (9.9) | 39 (5.3) | 43 (13.0) | 28 (14.2) | 18 (6.8) |
| Partnership | 580 (54.2) | 306 (66.1) | 422 (57.2) | 158 (47.6) | 89 (45.2) | 217 (81.6) |
| Divorced | 116 (10.8) | 17 (3.7) | 99 (13.4) | 17 (5.1) | 12 (6.1) | 5 (1.9) |
| Widowed | 23 (2.1) | 28 (6.0) | 18 (2.4) | 5 (1.5) | 11 (5.6) | 17 (6.4) |
| Legally separated | 24 (2.2) | 2 (0.4) | 17 (2.3) | 7 (2.1) | 2 (1.0) | 0 (0.0) |
| Employment, n (%) | ||||||
| Full time | 255 (23.8) | 241 (52.1) | 79 (10.7) | 176 (53.0) | 106 (53.8) | 135 (50.8) |
| Part time | 85 (7.9) | 47 (10.2) | 33 (4.5) | 52 (15.7) | 22 (11.2) | 25 (9.4) |
| Self‐employed | 29 (2.7) | 29 (6.3) | 12 (1.6) | 17 (5.1) | 13 (6.6) | 16 (6.0) |
| Not employed | 702 (65.5) | 146 (31.5) | 615 (83.2) | 87 (26.2) | 56 (28.4) | 90 (33.8) |
| BMI, kg/m2 | ||||||
| n | 1,050 | 459 | 722 | 328 | 197 | 262 |
| Mean ± SD | 25.9 ± 5.6 | 29.0 ± 6.3 | 25.6 ± 5.5 | 26.7 ± 5.6 | 29.0 ± 7.0 | 28.9 ± 5.8 |
| Comorbidities/concomitant therapies | ||||||
| Percent with comorbidity, n (%) | 954 (89) | 366 (79) | 677 (92) | 277 (83) | 145 (74) | 221 (83) |
| Percent taking nutritional supplements, n (%) | 489 (45.7) | 216 (46.7) | 340 (46.0) | 149 (44.9) | 87 (44.2) | 129 (48.5) |
| Percent using nonpharmacological therapies, n (%) | 302 (28.2) | 103 (22.2) | 221 (29.9) | 81 (24.4) | 48 (24.4) | 55 (20.7) |
| Percent on concomitant pharmacotherapy, n (%) | 883 (83.4) | 315 (68.0) | 666 (90.1) | 227 (68.4) | 124 (62.9) | 191 (71.8) |
| CAG research genotyping | ||||||
| Smaller allele CAG repeat length | ||||||
| n | 1,071 | 463 | 739 | 332 | 197 | 266 |
| Mean ± SD | 18.5 ± 3.5 | 16.9 ± 2.1 | 18.5 ± 3.6 | 18.3 ± 3.1 | 16.8 ± 2.2 | 17.0 ± 2.0 |
| Median (range) | 17.0 (9.0; 42.0) | 17.0 (9.0; 24.0) | 17.0 (9.0; 42.0) | 18.0 (9.0; 32.0) | 17.0 (9.0; 24.0) | 17.0 (9.0; 24.0) |
| Larger allele CAG repeat length | ||||||
| n | 1,071 | 463 | 739 | 332 | 197 | 266 |
| Mean ± SD | 43.5 ± 3.5 | 19.8 ± 3.4 | 44.0 ± 3.8 | 42.5 ± 2.7 | 19.7 ± 3.3 | 19.8 ± 3.5 |
| Median (range) | 43.0 (36.0; 71.0) | 19.0 (12.0; 35.0) | 43.0 (36.0; 71.0) | 42.0 (37.0; 51.0) | 19.0 (12.0; 34.0) | 19.0 (15.0; 35.0) |
ISCED = International Standard Classification of Education (1997 version); 0, preprimary; 1, primary; 2, lower secondary; 3, upper secondary; 4, postsecondary, 5 1st stage tertiary, 6 2nd stage tertiary.
Table 3.
Baseline clinical information per subject category (core assessments)
| Measure | HDGECs (N = 1,071) | Control (N = 463) | Manifest (N = 739) | Premanifest (N = 332) | Genotype Negative (N = 197) | Family Control (N = 266) |
|---|---|---|---|---|---|---|
| Core clinical assessments | ||||||
| UHDRS Motor scale | ||||||
| n | 1,069 | 463 | 737 | 332 | 197 | 266 |
| Mean ± SD | 26.9 ± 22.3 | 1.9 ± 3.5 | 37.4 ± 19.0 | 3.5 ± 4.4 | 2.3 ± 4.2 | 1.6 ± 2.9 |
| Median (range) | 25.0 (0.0; 97.0) | 0.0 (0.0; 28.0) | 35.0 (3.0; 97.0) | 2.0 (0.0; 32.0) | 1.0 (0.0; 28.0) | 0.0 (0.0; 17.0) |
| UHDRS TFC | ||||||
| n | 1,071 | 463 | 739 | 332 | 197 | 266 |
| Mean ± SD | 9.5 ± 3.6 | 12.8 ± 0.7 | 8.1 ± 3.5 | 12.8 ± 0.8 | 12.8 ± 1.0 | 12.9 ± 0.4 |
| Median (range) | 11.0 (0.0; 13.0) | 13.0 (5.0; 13.0) | 8.0 (0.0; 13.0) | 13.0 (5.0; 13.0) | 13.0 (5.0; 13.0) | 13.0 (9.0; 13.0) |
| UHDRS FAS | ||||||
| n | 1,051 | 463 | 723 | 328 | 197 | 266 |
| Mean ± SD | 20.2 ± 6.2 | 24.9 ± 0.8 | 18.2 ± 6.4 | 24.8 ± 0.8 | 24.8 ± 1.1 | 24.9 ± 0.5 |
| Median (range) | 23.0 (0.0; 25.0) | 25.0 (14.0; 25.0) | 20.0 (0.0; 25.0) | 25.0 (17.0; 25.0) | 25.0 (14.0; 25.0) | 25.0 (20.0; 25.0) |
| UHDRS Independence | ||||||
| n | 1,071 | 463 | 739 | 322 | 197 | 266 |
| Mean ± SD | 84.3 ± 17.7 | 99.6 ± 2.8 | 77.5 ± 17.4 | 99.4 ± 2.9 | 99.3 ± 4.1 | 99.8 ± 1.2 |
| Median (range) | 90.0 (15.0; 100) | 100.0 (55.0; 100) | 80.0 (15.0; 100.0) | 100.0 (70.0; 100) | 100.0 (55.0; 100) | 100.0 (90.0; 100) |
| PBA‐s depression score | ||||||
| n | 1,061 | 463 | 730 | 331 | 197 | 266 |
| Mean ± SD | 4.3 ± 6.1 | 2.7 ± 4.7 | 4.5 ± 5.9 | 3.9 ± 6.4 | 2.7 ± 5.2 | 2.7 ± 4.2 |
| Median (range) | 2.0 (0.0; 48.0) | 0.0 (0.0; 30.0) | 2.0 (0.0; 38.0) | 1.0 (0.0; 48.0) | 0.0 (0.0; 30.0) | 1.0 (0.0; 24.0) |
| PBA‐s irritability score | ||||||
| n | 1,067 | 463 | 735 | 332 | 197 | 266 |
| Mean ± SD | 2.5 ± 4.2 | 1.1 ± 2.6 | 2.7 ± 4.4 | 1.9 ± 3.7 | 1.2 ± 3.0 | 1.1 ± 2.2 |
| Median (range) | 0.0 (0.0; 28.0) | 0.0 (0.0; 21.0) | 1.0 (0.0; 25.0) | 0.0 (0.0; 28.0) | 0.0 (0.0; 21.0) | 0.0 (0.0; 15.0) |
| PBA‐s psychosis score | ||||||
| n | 1,064 | 463 | 733 | 331 | 197 | 266 |
| Mean ± SD | 0.2 ± 1.2 | 0.1 ± 1.2 | 0.2 ± 1.4 | 0.0 ± 0.4 | 0.2 ± 1.8 | 0.0 ± 0.6 |
| Median (range) | 0.0 (0.0; 18.0) | 0.0 (0.0; 18.0) | 0.0 (0.0; 18.0) | 0.0 (0.0; 4.0) | 0.0 (0.0; 18.0) | 0.0 (0.0; 9.0) |
| PBA‐s apathy score | ||||||
| n | 1,064 | 463 | 732 | 332 | 197 | 266 |
| Mean ± SD | 2.7 ± 4.2 | 0.4 ± 1.6 | 3.4 ± 4.6 | 1.0 ± 2.4 | 0.5 ± 1.7 | 0.4 ± 1.6 |
| Median (range) | 0.0 (0.0; 16.0) | 0.0 (0.0; 12.0) | 1.0 (0.0; 16.0) | 0.0 (0.0; 16.0) | 0.0 (0.0; 12.0) | 0.0 (0.0; 12.0) |
| PBA‐s executive function score | ||||||
| n | 1,064 | 463 | 732 | 332 | 197 | 266 |
| Mean ± SD | 2.4 ± 4.4 | 0.5 ± 2.4 | 3.0 ± 4.8 | 1.1 ± 3.0 | 0.6 ± 2.6 | 0.4 ± 2.3 |
| Median (range) | 0.0 (0.0; 32.0) | 0.0 (0.0; 25.0) | 0.0 (0.0; 32.0) | 0.0 (0.0; 32.0) | 0.0 (0.0; 25.0) | 0.0 (0.0; 24.0) |
| Symbol Digit Modalities Test (total correct) | ||||||
| n | 1,027 | 459 | 696 | 331 | 195 | 264 |
| Mean ± SD | 32.4 ± 17.5 | 50.7 ± 12.4 | 24.0 ± 12.7 | 50.0 ± 12.1 | 53.2 ± 12.6 | 48.9 ± 12.0 |
| Median (range) | 30.0 (0.0; 90.0) | 51.0 (0.0; 91.0) | 23.0 (0.0; 90.0) | 51.0 (10.0; 84.0) | 54.0 (0.0; 91.0) | 50.0 (1.0; 88.0) |
| Stroop Color Naming (total correct) | ||||||
| n | 1,049 | 457 | 717 | 332 | 193 | 264 |
| Mean ± SD | 52.8 ± 22.6 | 75.6 ± 15.7 | 42.8 ± 18.2 | 74.3 ± 14.6 | 77.5 ± 18.0 | 74.2 ± 13.6 |
| Median (range) | 52.0 (0.0; 130.0) | 76.0 (0.0; 132.0) | 43.0 (0.0; 130.0) | 74.5 (34.0; 109.0) | 80.0 (0.0; 132.0) | 75.0 (45.0; 129.0) |
| Stroop Word Reading (total correct) | ||||||
| n | 1,052 | 457 | 720 | 332 | 192 | 265 |
| Mean ± SD | 67.6 ± 28.0 | 94.1 ± 18.0 | 56.2 ± 23.9 | 92.4 ± 18.7 | 95.8 ± 20.6 | 92.9 ± 15.9 |
| Median (range) | 67.0 (0.0; 199.0) | 96.0 (0.0; 148.0) | 56.0 (0.0; 199.0) | 95.0 (6.0; 149.0) | 100.0 (0.0; 148.0) | 93.0 (37.0; 145.0) |
| Categorical Verbal Fluency test (total correct) | ||||||
| n | 1,049 | 460 | 720 | 329 | 195 | 265 |
| Mean ± SD | 14.8 ± 7.2 | 20.8 ± 5.7 | 11.9 ± 5.7 | 21.1 ± 6.2 | 21.0 ± 6.1 | 20.7 ± 5.3 |
| Median (range) | 14.0 (0.0; 40.0) | 21.0 (3.0; 41.0) | 11.0 (0.0; 32.0) | 20.0 (3.0; 40.0) | 21.0 (3.0; 41.0) | 21.0 (8.0; 40.0) |
UHDRS '99 = Unified Huntington's Disease Rating Scale (1999 version).
Table 4.
Baseline clincial information per subject category (extended assessments)
| Measure | HDGECs (N = 1,071) | Control (N = 463) | Manifest (N = 739) | Premanifest (N = 332) | Genotype Negative (N = 197) | Family Control (N = 266) |
|---|---|---|---|---|---|---|
| Extended clinical assessments | ||||||
| Stroop Interference (total correct) | ||||||
| n | 929 | 425 | 626 | 303 | 180 | 245 |
| Mean ± SD | 30.6 ± 14.8 | 42.5 ± 11.7 | 24.2 ± 11.8 | 43.9 ± 11.0 | 44.4 ± 12.3 | 41.0 ± 11.0 |
| Median (range) | 30.0 (0.0; 93.0) | 42.0 (0.0; 107.0) | 23.0 (0.0; 78.0) | 44.0 (13.0; 93.0) | 45.0 (0.0; 76.0) | 41.0 (1.0; 107.0) |
| Trail Making test Part A (total correct) | ||||||
| n | 799 | 408 | 519 | 280 | 179 | 229 |
| Mean ± SD | 24.3 ± 3.9 | 25.0 ± 0.2 | 23.9 ± 4.8 | 25.0 ± 0.0 | 25.0 ± 0.2 | 25.0 ± 0.1 |
| Median (range) | 25.0 (0.0; 25.0) | 25.0 (23.0; 27.0) | 25.0 (0.0; 25.0) | 25.0 (25.0; 25.0) | 25.0 (23.0; 27.0) | 25.0 (24.0; 25.0) |
| Trail Making test Part B (total correct) | ||||||
| n | 783 | 405 | 505 | 278 | 179 | 226 |
| Mean ± SD | 22.5 ± 10.3 | 24.7 ± 2.4 | 21.1 ± 12.6 | 24.8 ± 1.6 | 24.4 ± 3.5 | 24.9 ± 0.5 |
| MKedian (range) | 25.0 (0.0; 240.0) | 25.0 (0.0; 25.0) | 25.0 (0.0; 240.0) | 25.0 (7.0; 25.0) | 25.0 (0.0; 25.0) | 25.0 (18.0; 25.0) |
| Letter Verbal Fluency test (total correct) | ||||||
| n | 841 | 401 | 568 | 273 | 175 | 226 |
| Mean ± SD | 27.0 ± 15.8 | 40.6 ± 13.0 | 21.3 ± 13.3 | 38.9 ± 13.6 | 41.9 ± 14.3 | 39.7 ± 11.8 |
| Median (range) | 26.0 (0.0; 84.0) | 39.0 (0.0; 77.0) | 19.0 (0.0; 65.0) | 38.0 (10.0; 84.0) | 41.9 (0.0; 77.0) | 38.5 (13.0; 70.0) |
| MMSE: | ||||||
| n | 668 | 352 | 437 | 231 | 157 | 195 |
| Mean ± SD | 26.5 ± 3.8 | 28.9 ± 1.5 | 25.4 ± 4.2 | 28.5 ± 1.9 | 29.1 ± 1.5 | 28.7 ± 1.5 |
| Median (range) | 27.0 (0.0; 30.0) | 29.0 (19.0; 30.0) | 26.0 (0.0; 30.0) | 29.0 (16.0; 30.0) | 30.0 (19.0; 30.0) | 29.0 (24.0; 30.0) |
| HADS depression score | ||||||
| n | 672 | 341 | 442 | 228 | 157 | 184 |
| Mean ± SD | 5.7 ± 3.9 | 4.8 ± 3.4 | 6.3 ± 4.5 | 3.2 ± 3.3 | 2.6 ± 3.0 | 3.1 ± 2.6 |
| Median (range) | 5.0 (0.0; 19.0) | 4.0 (0.0; 16.0) | 6.0 (0.0; 21.0) | 3.0 (0.0; 20.0) | 2.0 (0.0; 15.0) | 3.0 (0.0; 14.0) |
| HADS anxiety score | ||||||
| n | 670 | 341 | 443 | 229 | 157 | 184 |
| Mean ± SD | 5.2 ± 4.4 | 2.9 ± 2.8 | 5.8 ± 4.1 | 5.5 ± 3.7 | 4.6 ± 3.6 | 5.0 ± 3.3 |
| Median (range) | 4.0 (0.0; 21.0) | 2.0 (0.0; 15.0) | 6.0 (0.0; 19.0) | 5.0 (0.0; 15.0) | 4.0 (0.0; 16.0) | 4.5 (0.0; 16.0) |
| SIS | ||||||
| n | 671 | 342 | 442 | 229 | 158 | 184 |
| Mean ± SD | 5.7 ± 4.4 | 4.0 ± 3.3 | 6.0 ± 4.5 | 5.3 ± 4.2 | 3.9 ± 3.7 | 4.2 ± 3.0 |
| Median (range) | 5.0 (0.0; 23.0) | 3.0 (0.0; 21.0) | 6.0 (0.0; 23.0) | 4.0 (0.0; 23.0) | 3.0 (0.0; 21.0) | 4.0 (0.0; 15.0) |
Figure 2.
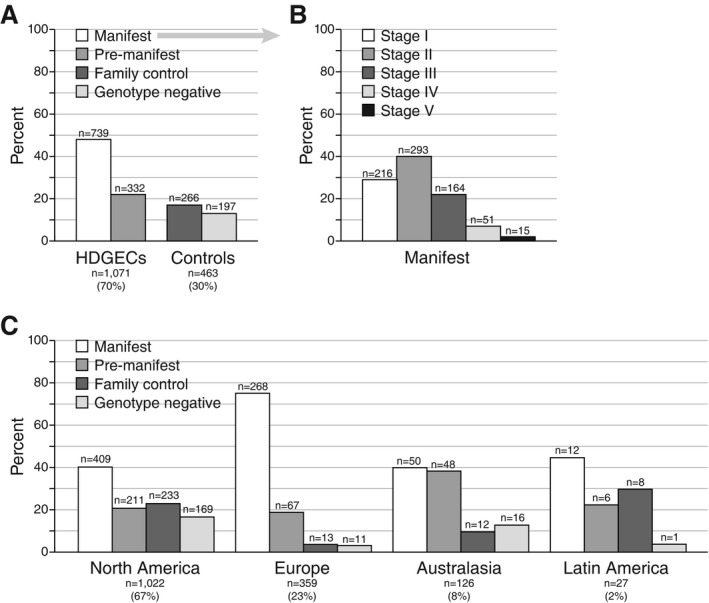
Frequencies of participant categories and HD stages: (A) overall population categories; (B) manifest population TFC stages; and (C) categories by geographical region. Participants in the enrollment category “genotype unknown” have been reclassified according to their research genotyping status.
During the data collection period, retention was high; only 42 (2.7%) participants withdrew from the study (manifest, n = 23; premanifest, n = 3; genotype negative: n = 4; family control: n = 12). The main reasons for premature discontinuation were participant's request (62%) and lost to follow‐up (24%).
Concomitant Therapies
The majority of participants reported having comorbidities and most were taking concomitant therapies and/or supplements (Table 2). In general, HD manifest participants used more pharmacotherapy (90.1%) than all other groups (63%–72%), but there was very similar usage of nonpharmacotherapy (21%–30%) and nutritional supplements (44%–49%) among all participant categories, including controls. Analysis by region (North America, Europe, and Australasia) revealed differences in overall usage of nutritional supplements (54%, 30%, and 37%, respectively). In particular, regional analysis of premanifest HDGECs shows that fewer European premanifest participants received nonpharmacological therapy (8% vs. 30%; P < 0.001) and nutritional supplements (30% vs. 50%; P < 0.001) than their North American counterparts.
Genotyping
Per definition, the mean ± SD CAG size for the larger allele was higher in HDGECs versus controls (43.5 ± 3.5 vs. 19.8 ± 3.4; Table 2). Interestingly, the mean and range of CAG sizes for the smaller allele was also higher in HDGECs than controls (mean ± SD: 18.5 ± 3.45 vs. 16.9 ± 2.1, respectively; P < 0.001). There was no correlation between the CAG sizes in small and large alleles in the HDGEC population (r = 0.056; P = 0.066), however a strong positive correlation was observed in the control population (r = 0.417; P < 0.001).
Regional analysis of the CAG sizes for the larger allele showed similar means across the four regions studied (Fig. 3). As anticipated, the mean ± SD disease burden was higher in subjects with manifest HD (416.6 ± 95.6) than in those with premanifest HD (266.9 ± 85.7).
Figure 3.
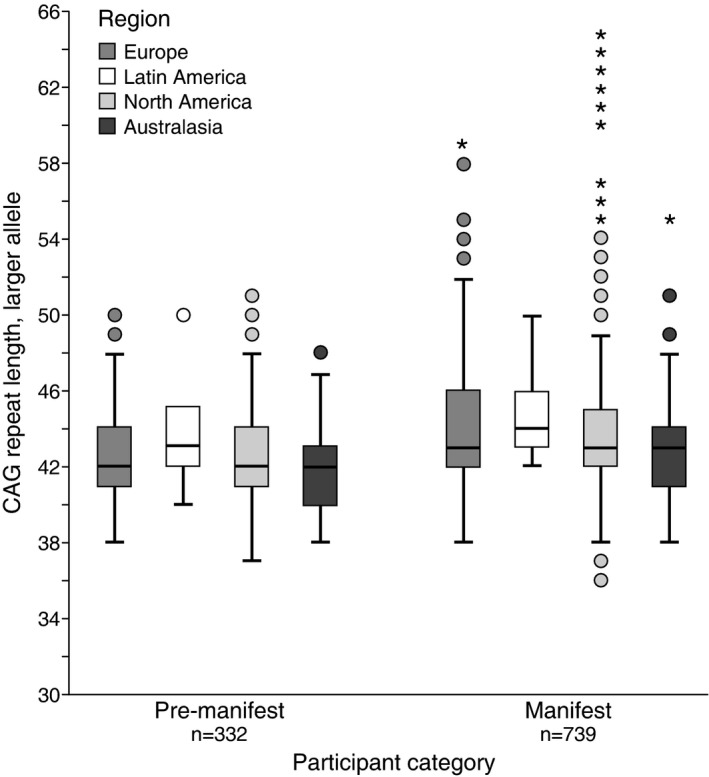
Distribution of CAG repeat lengths. Box‐and‐whisker plots showing distribution of CAG larger allele repeat length per region and HDGEC subject category. Circles represent values greater than 1.5 × IQR (interquartile range); stars represent values greater than 3 × IQR.
Clinical Assessments
As expected, mean ± SD UHDRS Total Motor Scores (TMS) were considerably higher in manifest (37.4 ± 19.0) than in premanifest HDGECs (3.5 ± 4.4) and genotype negative or family controls (2.3 ± 4.2 and 1.6 ± 2.9, respectively; Table 3). UHDRS TFC, Functional Assessment Scale (FAS), and independence scores were generally similar for the premanifest and control groups, and there was noticeable overlap in range of scores obtained. Manifest participants had lower scores for all three of these functional outcomes.
Four of five PBA‐s subscores (depression, irritability, apathy, and executive function) indicated numerical differences between controls and HDGECs (manifest > premanifest > controls). Similar patterns were observed with the combined Hospital Anxiety and Depression/Snaith Irritability Scale (HADS‐SIS) anxiety, depression, and irritability subscores (Table 4). For the majority of core cognitive tests (Symbol Digit Modalities, Categorical Verbal Fluency, and Stroop Color Naming and Word Reading), there were marked differences between participants with manifest HD and all other groups.
Discussion
The Enroll‐HD platform has been successfully launched and is beginning to yield important findings about current characteristics of HDGECs and their relatives/families (including controls) across four continents—North America, Europe, Australasia, and Latin America.
The first key aim of Enroll‐HD is to expedite recruitment into clinical trials. The platform achieves this in several ways. First, the willingness (consent) of Enroll‐HD participants to engage in all the research components (biosampling, collection of family history, and linkage of previous databases) is high (83%–98%). Second, the maintenance of a “live” secure database provides the necessary tools for the real‐time rapid identification of participants that meet specific inclusion and exclusion criteria for a given study protocol (e.g., defined HD symptoms or stages, concomitant medications). The ability to recruit HD family members while protecting them from knowing their genetic status and maintaining security of their data (keeping genetic data undisclosed and private at an individual level) potentially broadens recruitment for future clinical trials, while enabling the ongoing study of the earliest stages of HD; a recent survey showed that people at risk of familial Alzheimer's disease that did not want to know their genetic status were ready to change opinion if given the opportunity to participate in a clinical trial.12
The second key aim of Enroll‐HD is to improve understanding of HD, and the integrity of this first periodic data set demonstrates the efficiency of the platform in collecting high‐quality, clinically relevant data. For example, one of the challenges in assessing HD disability is to measure the impact of disease on behavior and mood. Although the PBA‐s has been recommended by the National Institute of Neurological Disorders and Stroke as a common data element for HD studies,13 until Enroll‐HD the PBA‐s had only been tested in smaller localized settings,10, 14, 15, 16 and this is the first time it has been assessed across a broad diversity of cultures and languages. A more thorough analysis of the scale's clinimetric properties and its usefulness in HD is now possible.
Enroll‐HD also enables the validation of hypotheses proposed by other studies. For example, it has been suggested that premanifest disease is better characterized by several epochs (far from diagnosis, intermediate, and close to diagnosis).17 That these epochs are not standardized highlights an important limitation in HD research, where the definition of the target population is critical. Validation of the proposed criteria to define the epochs of premanifest disease requires a second independent cohort of HDGECs. Although mean UHDRS TMS scores for premanifest participants are lower than in previously reported registry studies (3.5 in Enroll‐HD vs. 5.5 in PREDICT‐HD18 and 6.8–6.9 in COHORT19), the range for TMS in our study (0–32) is similar to that reported in PREDICT‐HD (0–34),18 thereby confirming that the study includes premanifest participants at all stages of the disease process. Given that we can unequivocally identify unique participants in Enroll‐HD that did not participate in previous studies used to generate such hypotheses, we are now in a good position to provide this validation sample within a short time frame.
Another area of current controversy is the influence of CAG repeat length on brain structure/function beyond the well‐established relationship with the current clinical definition of disease onset. Although it is well established that longer CAG repeats on the larger allele correlate with earlier onset of HD symptoms,20, 21 the contribution of the smaller allele is less certain. In HDGECs, the size of the smaller allele does not appear to influence disease onset,22 but studies in healthy controls have indicated that the CAG lengths of the two alleles is significantly correlated (albeit within normal limits).23, 24 We also observed this phenomenon and further observed that the CAG length of the small allele is larger in HDGECs than controls. However, our data in HDGECs did not find any correlation between the length of CAG repeats in the two alleles, as observed in controls. The finding of a longer CAG length on both alleles is consistent with the idea that there may be a genetic susceptibility in certain individuals to higher repeat lengths in both alleles as a function of the properties of the molecular machinery involved in expanding CAG repeat tracts.25 With Enroll‐HD, we can envision ways to further address this issue, for example, by genotyping individuals or subgroups to dissect these molecular mechanisms.
The third aim of Enroll‐HD is to improve clinical care. One of the strategies to develop standards of care is to study current practices in different geographies and settings, define commonalities and systematic variations, and study their effect on standardized outcomes. Enroll‐HD, with its expected 200 + sites and 19 + countries, is specifically designed to address such questions. Currently, the sample size in some regions is insufficient to allow clinically relevant assertions, but there are already indications of practice variations across regions. For example, the frequency of use of nonpharmacological treatments and nutritional supplements among premanifest participants in Europe is much lower than in North America (nonpharmacological treatments: 8% vs. 30%; nutritional supplements: 30% vs. 50%). Enroll‐HD data on nutritional supplements may reflect overall use of these products in the local general population given that their use seems to be independent of genetic or disease status (supplements were used equally by all groups in both regions). A limitation of this first periodic data set is the current lack of community controls who would not be influenced by living in an HD household.
An additional limitation of this report is the predominance of North American (67%) and European (23%) participants in Enroll‐HD, with much less data coming from Australasia and Latin America, reflecting the operational sequence of site entry into the platform. Furthermore, the present periodic data set provides mostly cross‐sectional data of a relatively small sample size; future data sets will include a greater proportion of longitudinal data. Moreover, Enroll‐HD incorporates many of the sites and participants from the previously reported COHORT19 and REGISTRY26 studies, and the large majority of these participants have consented to integrate their legacy data into Enroll‐HD (once the curation of these databases is complete). Therefore, future data sets from Enroll‐HD will be larger (as recruitment grows), more balanced regionally (as all planned sites enter the study), and have greater depth (with longitudinal data from Enroll‐HD or historical data from COHORT and REGISTRY).
In this report, we have used the first Enroll‐HD periodic data set to illustrate how this platform is able to handle the demands of clinical research technologies and manage the huge rise in data complexity that is increasingly part of innovative clinical research. If a clinical research infrastructure, once created, can be leveraged and reused multiple times rather than discarded when each study or trial ends, the gains in clinician/researcher/site staff engagement and experience, participant retention, and financial savings should be substantially advantageous to the research enterprise. These data sets will continue to be openly available to any interested researcher. In this way, we aim to direct as many minds as possible toward the terrible unmet medical need of HD and deliver therapeutics to affected families as soon as possible.
Author Roles
(1) Research Project: A. Conception, B. Organization, C. Execution; (2) Statistical Analysis: A. Design, B. Execution, C. Review and Critique; (3) Manuscript Preparation: A. Writing of the First Draft, B. Review and Critique.
G.B.L.: 1A, 1B, 1C, 2A, 2B, 2C, 3B
C.J.F.‐A.: 1A, 1B, 1C, 2A, 2B, 2C, 3A, 3B
J.G.: 1A, 1B, 1C, 2A, 2B, 2C, 3B
N.G.: 1A, 1B, 1C, 2A, 2B, 2C, 3B
K.E.A.: 1A, 1B, 1C, 2A, 2B, 2C, 3B
F.C.: 1A, 1B, 1C, 2A, 2B, 2C, 3B
J.J.F.: 1A, 1B, 1C, 2A, 2B, 2C, 3B
T.A.M.: 1A, 1B, 1C, 2A, 2B, 2C, 3B
J.C.S.: 1A, 1B, 1C, 2A, 2B, 2C, 3B
C.S.: 1A, 1B, 1C, 2A, 2B, 2C, 3A, 3B
Disclosures
Ethical Compliance Statement: We confirm that we have read the Journal's position on issues involved in ethical publication and affirm that this work is consistent with those guidelines.
Funding Sources and Conflicts of Interest: The CHDI Foundation funds the Enroll‐HD study. Cristina Sampaio, Cheryl J. Fitzer‐Attas, Joseph Giuliano, and G. Bernhard Landwehrmeyer have management functions within CHDI and were involved in the design and conduct of the study; collection, management, analysis, and interpretation of the data; as well as in the preparation, review, and approval of the manuscript. Karen E. Anderson, Francisco Cardoso, Joaquim J. Ferreira, Tiago Mestre, and Julie C. Stout are members of Enroll‐HD Governance Committees. The CHDI Foundation provided funding for medical writing assistance (literature searching, preparation of tables, and collation of authors comments) from Anita Chadha‐Patel, Ph.D. (ACP Clinical Communications Ltd) under direction of the authors. The authors report no conflicts of interest.
Financial Disclosures for previous 12 months: Karen Anderson has been a scientific advisor, North‐American co‐PI, and site PI for Teva, scientific advisor, global study PI and co‐PI, and site PI for Auspex, a scientific consultant for Azevan, a scientific advisor and site PI for CHDI Foundation, a scientific advisor for Prana, a scientific advisor and speaker for Lundbeck, and a site PI for Vaccinex. Francisco Cardoso has received honoraria for consultancy from Teva, UCB, and Zambon and for speaking engagements from Boehringer‐Ingelheim, MDS, Teva, UCB, and Zambon. Joaquim Ferreira has received grants from GlaxoSmithKline, Grunenthal, Fundação MSD (Portugal), Teva MSD, Allergan and Novartis. He received consultancy fees from GlaxoSmithKline, Novartis, TEVA, Lundbeck, Solvay, Abbott, BIAL, Merck‐Serono, Merz, Ipsen and Biogen. He is also employed by Centro Hospitalar Lisboa Norte and Faculdade de Medicina de Lisboa. Georg Bernhard Landwehrmeyer has provided consulting services, advisory board functions, clinical trial services and/or lectures for Affiris, AOP Orphan Pharmaceuticals AG, Desitin, GlaxoSmithKline, Hoffmann‐La Roche, Ionis Pharma, Pfizer, Prana Biotechnology, Raptor Pharmaceuticals, and TEVA and has received research grant support from the CHDI Foundation, the Bundesministerium für Bildung und Forschung (BMBF), the Deutsche Forschungsgemeinschaft (DFG), the European Commission (EU‐FP7). His study site Ulm has received compensation in the context of the observational REGISTRY‐Study of European Huntington's Disease Network (EHDN). Tiago Mestre has received honoraria from Abbvie, Teva and Academy of Neurology. He received grant from PSG/PDF and received consulting fees from CHDI Foundation. Cristina Sampaio has received consultancy fees from Neuroderm, Neurotrope, and Nestle, and speaker fee honorarium from the Movement Disorder Society. Julie Stout has received funds from HSG for her role as Treasurer, an honorarium from Roche for serving on an advisory committee, and funds from Teva Pharmaceuticals, Ionis Pharmaceuticals, and Vaccinex Inc. through Stout Neuropsych Pty Ltd.
Supporting information
Table S1. Enroll‐HD Governance Committee members.
Table S2. Clinical site contributors.
Acknowledgments
We thank all the people within the HD community who have contributed to Enroll‐HD, especially the participants and their families. We greatly appreciate the oversight of the Enroll‐HD Governance Committee members (Table S1) and the outstanding work of the clinical site contributors (Table S2).
Relevant disclosures and conflicts of interest are listed at the end of this article.
References
- 1. Organization for Economic Co‐operation and Development (OECD) . Dementia Research and Care. Paris: OECD Publishing. [Google Scholar]
- 2. Pringsheim T, Wiltshire K, Day L, Dykeman J, Steeves T, Jette N. The incidence and prevalence of Huntington's disease: a systematic review and meta‐analysis. Mov Disord 2012;27:1083–1091. [DOI] [PubMed] [Google Scholar]
- 3. Kay C, Fisher E, Hayden MR. Epidemiology In: Bates G, Tabrizi S, Jones L, eds. Huntington's Disease, 4th ed Oxford, UK: Oxford University Press; 2014:131–165. [Google Scholar]
- 4. Genetic Modifiers of Huntington's Disease Consortium . Electronic address ghmhe, Genetic Modifiers of Huntington's Disease Ge MHDC. Identification of genetic factors that modify clinical onset of Huntington's disease. Cell 2015;162:516–526. [DOI] [PMC free article] [PubMed] [Google Scholar]
- 5. A worldwide observational study for Huntington's disease families . http://www.enroll-hd.org. Accessed January 2016.
- 6. Losekoot M, van Belzen MJ, Seneca S, et al. EMQN/CMGS best practice guidelines for the molecular genetic testing of Huntington disease. Eur J Hum Genet 2013;21:480–486. [DOI] [PMC free article] [PubMed] [Google Scholar]
- 7. U.S. Food and Drug Asministration (FDA) . Guidance for industry: oversight of clinical investigations—a risk‐based approach to monitoring. 2013. Available at: http://www.fda.gov/downloads/Drugs/GuidanceComplianceRegulatoryInformation/Guidances/UCM269919.pdf. Accessed January 2016.
- 8. Shoulson I. Huntington disease: functional capacities in patients treated with neuroleptic and antidepressant drugs. Neurology 1981;31:1333–1335. [DOI] [PubMed] [Google Scholar]
- 9. Penney JB Jr, Vonsattel JP, MacDonald ME, Gusella JF, Myers RH. CAG repeat number governs the development rate of pathology in Huntington's disease. Ann Neurol 1997;41:689–692. [DOI] [PubMed] [Google Scholar]
- 10. Callaghan J, Stopford C, Arran N, et al. Reliability and factor structure of the Short Problem Behaviors Assessment for Huntington's disease (PBA‐s) in the TRACK‐HD and REGISTRY studies. J Neuropsychiatry Clin Neurosci 2015;27:59–64. [DOI] [PubMed] [Google Scholar]
- 11. U.S. Department of Health and Human Services Office for Civil Rights . HIPAA Administrative Simplification (45 CFR Parts 160, 162, and 164). Available at: http://www.hhs.gov/ocr/privacy/hipaa/administrative/combined/hipaa-simplification-201303.pdf. Accessed January 2016.
- 12. Grill JD, Bateman RJ, Buckles V, et al. A survey of attitudes toward clinical trials and genetic disclosure in autosomal dominant Alzheimer's disease. Alzheimers Res Ther 2015;7:50. [DOI] [PMC free article] [PubMed] [Google Scholar]
- 13. National Institute of Neurological Disorders and Stroke (NINDS) Common Data Elements (CDEs) for Huntington's Disease. Available at: http://www.commondataelements.ninds.nih.gov/hd.aspx ‐ tab=Data_Standards. Accessed January 2016.
- 14. Craufurd D, Thompson JC, Snowden JS. Behavioral changes in Huntington disease. Neuropsychiatry Neuropsychol Behav Neurol 2001;14:219–226. [PubMed] [Google Scholar]
- 15. Tabrizi SJ, Langbehn DR, Leavitt BR, et al. Biological and clinical manifestations of Huntington's disease in the longitudinal TRACK‐HD study: cross‐sectional analysis of baseline data. Lancet Neurol 2009;8:791–801. [DOI] [PMC free article] [PubMed] [Google Scholar]
- 16. Kingma EM, van Duijn E, Timman R, van der Mast RC, Roos RA. Behavioural problems in Huntington's disease using the Problem Behaviours Assessment. Gen Hosp Psychiatry 2008;30:155–161. [DOI] [PubMed] [Google Scholar]
- 17. Zhang Y, Long JD, Mills JA, et al. Indexing disease progression at study entry with individuals at‐risk for Huntington disease. Am J Med Genet B Neuropsychiatr Genet 2011;156B:751–763. [DOI] [PMC free article] [PubMed] [Google Scholar]
- 18. Paulsen JS, Langbehn DR, Stout JC, et al. Detection of Huntington's disease decades before diagnosis: the Predict‐HD study. J Neurol Neurosurg Psychiatry 2008;79:874–880. [DOI] [PMC free article] [PubMed] [Google Scholar]
- 19. Huntington Study Group . Characterization of a large group of individuals with Huntington disease and their relatives enrolled in the COHORT study. PLoS ONE 2012;7:e29522. [DOI] [PMC free article] [PubMed] [Google Scholar]
- 20. Duyao M, Ambrose C, Myers R, et al. Trinucleotide repeat length instability and age of onset in Huntington's disease. Nat Genet 1993;4:387–392. [DOI] [PubMed] [Google Scholar]
- 21. Langbehn DR, Brinkman RR, Falush D, Paulsen JS, Hayden MR. International Huntington's Disease Collaborative Group. A new model for prediction of the age of onset and penetrance for Huntington's disease based on CAG length. Clin Genet 2004;65:267–277. [DOI] [PubMed] [Google Scholar]
- 22. Klempir J, Zidovska J, Stochl J, Ing VK, Uhrova T, Roth J. The number of CAG repeats within the normal allele does not influence the age of onset in Huntington's disease. Mov Disord 2011;26:125–129. [DOI] [PubMed] [Google Scholar]
- 23. Nopoulos P, Epping EA, Wassink T, Schlaggar BL, Perlmutter J. Correlation of CAG repeat length between the maternal and paternal allele of the Huntingtin gene: evidence for assortative mating. Behav Brain Funct 2011;7:45. [DOI] [PMC free article] [PubMed] [Google Scholar]
- 24. Muhlau M, Winkelmann J, Rujescu D, et al. Variation within the Huntington's disease gene influences normal brain structure. PLoS ONE 2012;7:e29809. [DOI] [PMC free article] [PubMed] [Google Scholar]
- 25. Pinto RM, Dragileva E, Kirby A, et al. Mismatch repair genes Mlh1 and Mlh3 modify CAG instability in Huntington's disease mice: genome‐wide and candidate approaches. PLoS Genet 2013;9:e1003930. [DOI] [PMC free article] [PubMed] [Google Scholar]
- 26. Orth M, Handley OJ, Schwenke C, et al. Observing Huntington's disease: the European Huntington's Disease Network's REGISTRY. PLoS Curr 2010;2:RRN1184. [DOI] [PMC free article] [PubMed] [Google Scholar]
Associated Data
This section collects any data citations, data availability statements, or supplementary materials included in this article.
Supplementary Materials
Table S1. Enroll‐HD Governance Committee members.
Table S2. Clinical site contributors.