

Abstract
Objective
To systematically test dietary components for association with serum urate levels and to evaluate the relative contributions of estimates of diet pattern and inherited genetic variants to population variance in serum urate levels.
Design
Meta-analysis of cross sectional data from the United States.
Data sources
Five cohort studies.
Review methods
16 760 individuals of European ancestry (8414 men and 8346 women) from the US were included in analyses. Eligible individuals were aged over 18, without kidney disease or gout, and not taking urate lowering or diuretic drugs. All participants had serum urate measurements, dietary survey data, information on potential confounders (sex, age, body mass index, average daily calorie intake, years of education, exercise levels, smoking status, and menopausal status), and genome wide genotypes. The main outcome measures were average serum urate levels and variance in serum urate levels. β values (95% confidence intervals) and Bonferroni corrected P values from multivariable linear regression analyses, along with regression partial R2 values, were used to quantitate associations.
Results
Seven foods were associated with raised serum urate levels (beer, liquor, wine, potato, poultry, soft drinks, and meat (beef, pork, or lamb)) and eight foods were associated with reduced serum urate levels (eggs, peanuts, cold cereal, skim milk, cheese, brown bread, margarine, and non-citrus fruits) in the male, female, or full cohorts. Three diet scores, constructed on the basis of healthy diet guidelines, were inversely associated with serum urate levels and a fourth, data driven diet pattern positively associated with raised serum urate levels, but each explained ≤0.3% of variance in serum urate. In comparison, 23.9% of variance in serum urate levels was explained by common, genome wide single nucleotide variation.
Conclusion
In contrast with genetic contributions, diet explains very little variation in serum urate levels in the general population.
Introduction
Hyperuricaemia (elevated serum urate concentration) is a central risk factor for gout, and is also associated with chronic kidney disease, hypertension, and metabolic syndrome.1 2 3 4 The balance between hepatic production of urate and intestinal or renal urate excretion pathways determine an individual’s serum urate levels.5 This balance can be modified by both genetic and environmental factors. Familial and twin studies estimating the heritability of serum urate suggest genetic factors explain 25% to 60% of the variability in serum urate levels,6 7 8 9 10 11 12 13 consistent with estimates from a genome wide association study of unrelated individuals, which predicted that 25% to 40% of the variability in serum urate levels is controlled by common single nucleotide variants.14 The remaining 60% to 75% of serum urate variability is therefore explained by genetic factors (common and uncommon) not tagged by common variants, and non-genetic factors such as diet or other environmental exposures.
For centuries, diet has been identified as a risk factor for the development of gout.15 16 Consumption of red meat, shellfish, alcoholic beverages, sugary drinks, and tomatoes has been associated with increased serum urate levels, and low fat milk and coffee consumption with reduced serum urate levels.17 18 19 20 21 Certain diets (eg, the Dietary Approaches to Stop Hypertension (DASH) and the Mediterranean diet) have been shown to reduce serum urate levels and the risk of gout.22 23 24 In addition, food consumption is heritable, for example, heritability of coffee consumption is estimated to be between 36% to 58%,25 alcohol consumption to be between 43% to 53%,26 and sugar sweetened beverage consumption to be 48%.27 Genome wide association studies have identified genetic associations with coffee and alcohol consumption habits.28 29 It is therefore possible that the heritable component of specific food consumption contributes to the heritability of serum urate levels (eg, signals in the ABCG2, GCKR, and MLXIPL genes are common to genome wide association studies of coffee consumption and serum urate).14 28 To date, a systematic analysis of the contribution of diet to serum urate levels has not been performed in a sufficiently large dataset. Furthermore, the relative contributions of inherited genetic variants and overall diet to variance in serum urate concentrations is unknown. This study aimed to systematically test individual dietary components for association with serum urate in a diet wide association study and quantify the relative contributions of overall diet and common, genome wide single nucleotide variants in determining serum urate levels.
Methods
Participants
Demographic, anthropomorphic, and clinical data are presented in the supplementary materials (table S1). Information from the baseline visit of the Atherosclerosis Risk in Communities (ARIC, 1987-89), Coronary Artery Risk Development in (Young) Adults (CARDIA, 1985), Cardiovascular Heart (CHS, 1989-90), and Framingham Heart (FHS, 2002-05) studies was sourced through the Database of Genotypes and Phenotypes. Anonymised information from the Third National Health and Nutrition Examination Survey (NHANES III, 1988-91) was also used. These five studies all recruited participants from the United States.
Analysis sample sets of people of European ancestry were developed by using consistent exclusion criteria between study cohorts (supplementary materials, fig S1). People without serum urate measurements or genome wide genotypes were excluded, along with individuals aged under 18, people with kidney disease or gout, and those taking urate lowering drugs or diuretic drugs. Individuals who did not provide information for any of the covariates used in analyses were also excluded. Quality controls for the dietary data were also applied, with participants who answered less than 10% of the food frequency survey excluded, along with individuals whose estimated average daily calorie intake was less than 600 kcal/day or greater than 4200 kcal/day (inclusive; 1 kcal=4.18 kJ). Participants whose questionnaire answers were deemed unreliable by the study interviewer at recruitment were also excluded.
Dietary assessment
During recruitment, participants from the five cohorts completed a validated food frequency questionnaire. The participants in the ARIC, CHS, and FHS studies completed similar questionnaires in which participants were asked to answer the question “How often, on average, in the past year did you eat [this food]?” by choosing from several frequency categories (66 questions and nine answer categories for ARIC, 99 questions and six answer categories for CHS, and 126 questions and nine answer categories for FHS).30 31 32 33 34 These categorical answers were converted to average serves per week for analysis (supplementary materials, table S2). Participants in the CARDIA study answered a specifically designed and validated diet history which assessed their consumption frequency of 100 food items by using a series of questions, “Do you eat [this food]?” if yes, “How much do you usually have?” and “How often do you usually have it?” Answers were then converted to servings per week by the study researchers using the Nutrition Coordinating Centre dietary analysis system.35 36 Participants in the NHANES III study were given a questionnaire (60 questions) similar to that of the ARIC, CHS, and FHS studies in which they were asked “How often, in your usual diet over the past month, have you eaten [this food item]?” Answers were given in serves per month and converted to serves per week for analysis (supplementary materials, table S2).37
As each study administered a slightly different food frequency questionnaire, with a differing number of questions (60 to 126) and a slightly different list of food items within each question, questionnaires were assessed for between-study comparability. Briefly, questions were grouped together based on food type. Where questions were identical between studies no changes to the data were made. Where questions were not identical between studies (eg, questionnaires asked about any wine consumption v separate red and white wine consumption) the answers were combined (after conversion to serves per week) to create identical questions with the aim of retaining as many food items as possible, while reducing the variability in questions between the five studies. The decisions on which questions were able to be combined were made by one analyst (TJM) in consultation with the other three authors. If an identical question could not be created, the non-matching information was excluded, either from only the cohort with non-matching data (eg, the NHANES III study asked about consumption of peanuts, peanut butter, nuts, and seeds in a single question, making this non-comparable to either the nuts or peanuts questions of the other four studies), or if at least three of the five cohorts did not have identical questions, the extra information was excluded from the entire analysis (eg, only the CHS and FHS studies asked about berry consumption, so berries were not included). These exclusions resulted in a group of 63 food items with comparable questions within at least three of the five studies (supplementary materials, table S3). Average consumption of each of these 63 food items, per sample set, is presented in the supplementary materials, table S4. We were not able to adjust average consumption for portion size in the aggregated data, because the NHANES III study did not specify portion size, the CHS study only specified a relative portion size (small, medium, or large), and the portion sizes specified by the ARIC, CARDIA, and FHS studies were inconsistent with each other.
Measurement of serum urate levels
The ARIC, CARDIA, and NHANES III studies used a standard uricase oxidation assay to measure serum urate levels.37 38 39 40 The CHS study used a Kodak Ektachem 700 analyser and reagents to measure serum urate levels.41 The FHS study used a phosphotungstic acid reagent autoanalyser to measure serum urate levels.42
Diet wide association study
We performed a multivariable linear regression for each of the 63 food items in each separate cohort for the diet wide association study (supplementary material, supplemental methods). We combined effect sizes (β values, representing the change in serum urate level (μmol/L) per additional weekly serving) for each food item by inverse variance weighted meta-analysis over the five cohorts. We set diet wide significance at Pβ<7.94×10⁻⁴ after Bonferroni correction for multiple testing (0.05 divided by 63 food items).
Diet scores
We evaluated four diet scores: a Healthy Eating diet score calculated on the basis of the Harvard Healthy Eating Pyramid guidelines,43 44 the DASH diet score based on the Dietary Approaches to Stop Hypertension guidelines,45 46 the Mediterranean diet score,47 and a data driven measure of the true dietary patterns in the datasets used. For the Healthy Eating, DASH, and Mediterranean diet scores, specific food items or food groups of relevance to the particular diet being considered were identified. The consumption frequency for each of these food items or groups was then split into four, five, or six predefined consumption categories, respectively. These categories were then weighted based on how closely the consumption level matched that recommended by the respective dietary advice, and these weighted consumption levels were summed together to create each diet score. For these three diet scores, a larger number indicated healthier dietary habits as defined by the specific dietary recommendations. For the data driven diet pattern, we conducted factor analysis using data from the 37 food items with complete information in all five cohorts, and the resulting factor loadings were used to weight and combine the consumption of seven food items determined to define the data driven dietary pattern.48 Computation of the four diet scores is described in more detail in the supplementary materials.
Genetic analysis
We assessed the percentage of variance in serum urate explained by common genetic variants in two ways (supplementary materials). Firstly, the 30 genome wide significant variants identified in the largest European genome wide association study of serum urate were obtained from the whole-genome genotyping data of the ARIC, CARDIA, CHS, and FHS cohorts.14 A weighted genetic risk score was constructed from these genotypes and assessed for its contribution to serum urate variability. To create the genetic risk score, we coded genotypes (0, 1, 2) to represent the number of urate raising alleles present, as defined by the effect directions previously reported, and then multiplied by the effect size (β value; converted to μmol/L).14 We summed these weighted variables, resulting in a genetic risk score with a minimum value of 0 and a maximum value of 236.15 (supplementary materials, fig S7). Secondly, we generated heritability estimates under an additive model in the combined cohort from the genome wide genotype data by using the Genome-wide Complex Trait Analysis (GCTA) version 1.26.0 software.49 NHANES III was unable to be included in the genetic analyses due to a lack of genotype data.
Patient and public involvement
No patients were involved in setting the research question or the outcome measures, nor were they involved in developing plans for design or implementation of the study. No patients were asked to advise on interpretation or writing up of results. There are no plans to disseminate the results of the research to study participants, although they will be widely disseminated to the general public and relevant patient community.
ND and TRM are founding members of the Auckland (New Zealand) based Counties Manukau District Health Board Māori Gout Action Group.50 TJM has conducted qualitative interviews with gout patients in New Zealand; the lived experiences of these gout patients and the views of the Māori Gout Action Group informed our research on the causes and management of gout and influenced our design and conclusions of this study.
Results
Diet wide association analysis
Figure 1 and table 1 show that 15 food items were significantly associated with serum urate levels in the full, male, or female cohorts (Pβ<7.94×10⁻⁴; supplementary materials, tables S4-S7). Seven food items were associated with raised serum urate levels (beer, liquor, wine, potato, poultry, soft drink, and meat (beef, pork, or lamb)) and eight were associated with lower serum urate levels (eggs, peanuts, cold cereal, skim milk, cheese, brown bread, margarine, and non-citrus fruit). The food items with the strongest urate raising effect (beer and liquor) were associated with a 1.38 μmol/L increase in serum urate per serving per week, equating to a 9.66 μmol/L (0.16 mg/dL) increase per daily serving. In the full cohort, wine was only nominally significant (Pβ<0.05, Pβ≥7.94×10⁻⁴). Wine was significantly associated with serum urate levels in the male cohort, along with eight other food items (beer, soft drink, skim milk, peanuts, eggs, cold cereal, brown bread, and non-citrus fruit). In the female cohort, seven food items (beer, liquor, cold cereal, skim milk, cheese, brown bread, and margarine) were significantly associated with serum urate (table 1). The effect size for skim milk was similar to that reported in a previous study.52 The effect sizes for beer, liquor, soft drink, and meat (beef, pork, or lamb) were within the range of previously reported values.18 19 21 51 52
Fig 1.
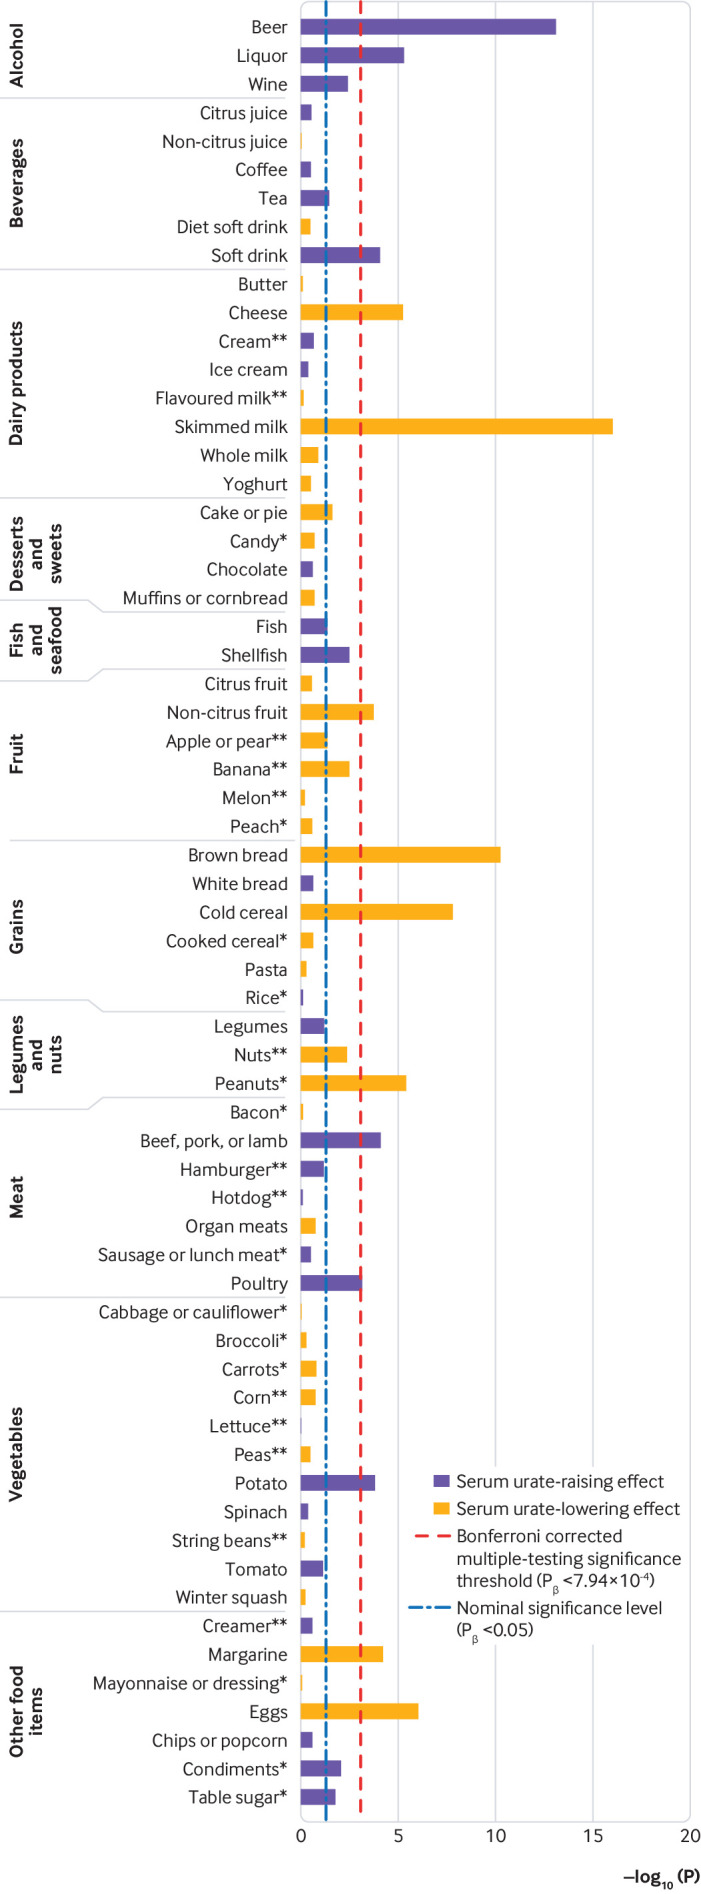
Manhattan plot of −log10(P values) for 63 food items associated with serum urate levels. *Not all datasets were included in the analysis. The number of asterisks represents the number of datasets missing
Table 1.
Diet wide significant associations with serum urate levels (μmol/L) in full, male, and female study cohorts
| Food items | Full cohort | Male cohort | Female cohort | ||||||||||||
|---|---|---|---|---|---|---|---|---|---|---|---|---|---|---|---|
| No | β (95% CI)† | Pβ | R2 (%)‡ | β§ | No | β (95% CI) | Pβ | R2 (%) | No | β (95% CI) | Pβ | R2 (%) | |||
| Associated with higher urate levels | |||||||||||||||
| Beer | 16 724 | 1.38 (1.02 to 1.74)¶ | <0.001 | 0.99 | 3.91 | 8392 | 1.33 (0.93 to 1.74)¶ | <0.001 | 1.31 | 8332 | 1.78 (1.22 to 2.34) | <0.001 | 0.49 | ||
| Liquor | 16 743 | 1.38 (0.79 to 1.98)¶ | <0.001 | 0.40 | 2.46 | 8403 | 1.16 (0.46 to 1.86)¶ | 0.001 | 0.41 | 8340 | 1.84 (1.21 to 2.48) | <0.001 | 0.44 | ||
| Wine | 16 743 | 1.07 (0.34 to 1.80)¶ | 0.004 | 0.17 | NA | 8402 | 1.30 (0.64 to 1.96) | <0.001 | 0.16 | 8341 | 0.89 (−0.17 to 1.94)¶ | 0.10 | 0.20 | ||
| Potato | 16 754 | 0.87 (0.42 to 1.32) | <0.001 | 0.11 | NA | 8411 | 0.90 (0.25 to 1.56) | 0.007 | 0.09 | 8343 | 0.77 (0.15 to 1.40) | 0.02 | 0.09 | ||
| Poultry | 16 740 | 0.70 (0.29 to 1.10) | <0.001 | 0.08 | NA | 8403 | 0.94 (0.33 to 1.56) | 0.003 | 0.10 | 8337 | 0.50 (−0.02 to 1.02) | 0.06 | 0.05 | ||
| Soft drink | 16 745 | 0.68 (0.34 to 1.02)¶ | <0.001 | 0.30 | 0.89; 0.58; 0.56 | 8404 | 0.79 (0.53 to 1.04) | <0.001 | 0.39 | 8341 | 0.55 (0.09 to 1.01)¶ | 0.02 | 0.16 | ||
| Beef, pork, or lamb | 16 757 | 0.63 (0.32 to 0.95) | <0.001 | 0.08 | 1.95; 0.43 | 8412 | 0.72 (0.28 to 1.16) | 0.001 | 0.12 | 8345 | 0.47 (0.02 to 0.92) | 0.04 | 0.04 | ||
| Associated with lower urate levels | |||||||||||||||
| Eggs | 16 736 | −1.10 (−1.54 to −0.66) | <0.001 | 0.13 | NA | 8403 | −1.45 (−2.03 to −0.86) | <0.001 | 0.27 | 8333 | −0.45 (−1.74 to 0.84)¶ | 0.49 | 0.01 | ||
| Peanuts* | 12 504 | −0.88 (−1.25 to −0.51) | <0.001 | 0.18 | NA | 6277 | −1.01 (−1.51 to −0.52) | <0.001 | 0.24 | 6227 | −0.65 (−1.23 to −0.07) | 0.03 | 0.07 | ||
| Cold cereal | 16 751 | −0.72 (−0.97 to −0.47) | <0.001 | 0.14 | NA | 8409 | −0.73 (−1.07 to −0.38) | <0.001 | 0.19 | 8342 | −0.67 (−1.04 to −0.30) | <0.001 | 0.08 | ||
| Skim milk | 16 714 | −0.63 (−0.78 to −0.48) | <0.001 | 0.40 | −0.63 | 8390 | −0.78 (−1.00 to −0.56) | <0.001 | 0.55 | 8324 | −0.48 (−0.68 to −0.28) | <0.001 | 0.24 | ||
| Cheese | 16 755 | −0.62 (−0.89 to −0.35) | <0.001 | 0.09 | NA | 8410 | −0.64 (−1.05 to −0.23) | 0.002 | 0.10 | 8345 | −0.64 (−0.99 to −0.29) | <0.001 | 0.09 | ||
| Brown bread | 16 710 | −0.60 (−0.77 to −0.42) | <0.001 | 0.22 | NA | 8382 | −0.68 (−0.93 to−0.44)¶ | <0.001 | 0.34 | 8328 | −0.45 (−0.71 to −0.20) | <0.001 | 0.11 | ||
| Margarine | 16 716 | −0.29 (−0.44 to −0.15) | <0.001 | 0.10 | NA | 8383 | −0.25 (−0.69 to 0.18)¶ | 0.26 | 0.10 | 8333 | −0.34 (−0.53 to −0.14) | <0.001 | 0.11 | ||
| Non-citrus fruit | 16 760 | −0.28 (−0.43 to −0.13) | <0.001 | 0.06 | NA | 8414 | −0.43 (−0.66 to −0.19) | <0.001 | 0.14 | 8346 | −0.14 (−0.33 to 0.04) | 0.13 | 0.01 | ||
NA=not applicable.
Not all datasets were included in the analysis. The number of asterisks represents the number of datasets missing.
Effect size, reflecting the change in serum urate level (μmol/L) per weekly serve.
Partial R2 value (R2 B) converted to a percentage (R2×100) that quantitates the percent variance in serum urate levels explained by the food item.
Values from significantly associated analyses from published data in combined men and women: beer and liquor were obtained from reference 21; soft drink data from references 18, 51, and 52; meat (beef, pork, or lamb) data from references 19 and 52; skim milk data from reference 52. References 18, 19, and 21 analysed NHANES III and therefore are not independent of our study.
A random effect model was used in the meta-analysis (PQ<0.1).
Association of diet scores with serum urate levels
Table 2 shows that increases in the Healthy Eating, DASH, and Mediterranean diet scores (indicating a healthier diet) were significantly associated with lowered serum urate levels in the full cohort (β=−0.72 μmol/L, Pβ<0.001; β=−0.73 μmol/L, Pβ<0.001; β=−0.38 μmol/L, Pβ<0.001, respectively) and the male cohort (β=−0.97 μmol/L, Pβ<0.001; β=−0.86 μmol/L, Pβ<0.001; β=−0.58 μmol/L, Pβ=0.02, respectively), but only the DASH diet score was significantly associated with lowered serum urate levels in the female cohort (β=−0.64 μmol/L, Pβ=0.03). The data driven diet pattern, which represented a diet high in less healthy foods, associated with increased serum urate levels in the full, male, and female cohorts (β=0.57 μmol/L, Pβ<0.001; β=0.62 μmol/L, Pβ<0.001; β=0.53 μmol/L, Pβ<0.001, respectively). These diet scores(the s were significantly correlated with each other (all ≥0.29 (absolute values), PCor<0.001) and the results of the regression analyses for the Healthy Eating, DASH, and Mediterranean diet scores were not significantly different in the male and female cohorts (PDiff≥0.10 and PDiff≥0.17, respectively). In the full cohort, the Healthy Eating and DASH diet scores and the Healthy Eating and Mediterranean diet scores did not have significantly different results (PDiff=0.95 and PDiff=0.06, respectively). The DASH and Mediterranean diet score results were mildly different (PDiff=0.03). The results of the data driven diet pattern were significantly different to the other three diet scores in the full, male, and female cohorts (PDiff<0.001, PDiff<0.001, and PDiff≤0.03, respectively).
Table 2.
Percent variance in serum urate levels (μmol/L) explained by dietary and genetic factors in full, male, and female study cohorts
| Diet, genetic score, and additional adjuster | Full cohort | Male cohort | Female cohort | |||||||||||
|---|---|---|---|---|---|---|---|---|---|---|---|---|---|---|
| No | β (95% CI)* | Pβ | R2 (%)† | No | β (95% CI) | Pβ | R2 (%) | No | β (95% CI) | Pβ | R2 (%) | |||
| Dietary effect | ||||||||||||||
| Healthy Eating | ||||||||||||||
| Unadjusted | 16 759 | −0.72 (−1.01 to −0.43) | <0.001 | 0.15 | 8413 | −0.97 (−1.41 to −0.54) | <0.001 | 0.21 | 8346 | −0.43 (−1.25 to 0.38)‡ | 0.30 | 0.07 | ||
| Genetic risk score | 12 162 | −0.61 (−0.93 to −0.29) | <0.001 | 0.12 | 6109 | −0.82 (−1.31 to −0.33) | <0.001 | 0.16 | 6053 | −0.35 (−1.31 to 0.61)‡ | 0.48 | 0.05 | ||
| DASH | ||||||||||||||
| Unadjusted | 16 731 | −0.73 (−0.96 to −0.50) | <0.001 | 0.28 | 8402 | −0.86 (−1.20 to −0.52) | <0.001 | 0.31 | 8329 | −0.64 (−1.23 to −0.05)‡ | 0.03 | 0.17 | ||
| Genetic risk score | 12 139 | −0.75 (−1.01 to −0.50) | <0.001 | 0.37 | 6100 | −0.89 (−1.28 to −0.51) | <0.001 | 0.43 | 6039 | −0.71 (−1.45 to 0.03)‡ | 0.06 | 0.25 | ||
| Mediterranean | ||||||||||||||
| Unadjusted | 16 719 | −0.38 (−0.59 to −0.18) | <0.001 | 0.06 | 8392 | −0.58 (−1.05 to −0.11)‡ | 0.02 | 0.10 | 8327 | −0.18 (−0.46 to 0.09) | 0.19 | 0.01 | ||
| Genetic risk score | 12 131 | −0.56 (−0.96 to −0.16)‡ | 0.006 | 0.12 | 6092 | −0.83 (−1.47 to −0.19)‡ | 0.01 | 0.23 | 6039 | −0.28 (−0.84 to 0.28)‡ | 0.32 | 0.02 | ||
| Data driven | ||||||||||||||
| Unadjusted | 16 652 | 0.57 (0.26 to 0.88)‡ | <0.001 | 0.16 | 8354 | 0.62 (0.33 to 0.91) | <0.001 | 0.17 | 8298 | 0.53 (0.24 to 0.83) | <0.001 | 0.14 | ||
| Genetic risk score | 12 078 | 0.48 (0.25 to 0.71) | <0.001 | 0.08 | 6063 | 0.43 (0.10 to 0.76) | 0.01 | 0.08 | 6015 | 0.54 (−0.18 to 1.27)‡ | 0.14 | 0.10 | ||
| Genetic effect | ||||||||||||||
| Genetic risk score | ||||||||||||||
| Unadjusted | 12 162 | 0.99 (0.93 to 1.05) | <0.001 | 7.85 | 6109 | 0.93 (0.84 to 1.03) | <0.001 | 5.89 | 6053 | 1.04 (0.97 to 1.12) | <0.001 | 10.55 | ||
| Healthy Eating | 12 162 | 0.99 (0.93 to 1.05) | <0.001 | 7.82 | 6109 | 0.93 (0.84 to 1.03) | <0.001 | 5.87 | 6053 | 1.04 (0.96 to 1.12) | <0.001 | 10.51 | ||
| DASH | 12 147 | 0.99 (0.93 to 1.05) | <0.001 | 7.85 | 6106 | 0.94 (0.84 to 1.03) | <0.001 | 5.91 | 6041 | 1.04 (0.96 to 1.12) | <0.001 | 10.55 | ||
| Mediterranean | 12 131 | 0.99 (0.93 to 1.05) | <0.001 | 7.86 | 6092 | 0.94 (0.84 to 1.03) | <0.001 | 5.93 | 6039 | 1.04 (0.97 to 1.12) | <0.001 | 10.53 | ||
| Data driven | 12 078 | 0.99 (0.93 to 1.05) | <0.001 | 7.84 | 6063 | 0.94 (0.84 to 1.03) | <0.001 | 5.89 | 6015 | 1.04 (0.97 to 1.12) | <0.001 | 10.53 | ||
| Heritability estimate | ||||||||||||||
| Unadjusted | 12 162 | NA | <0.001 | 23.9 (20.2 to 27.5) | 6109 | NA | <0.001 | 23.8 (16.6 to 30.0) | 6053 | NA | <0.001 | 40.3 (33.5 to 47.1) | ||
NHANES III was unable to be included in the genetic risk score or heritability analyses.
DASH=Dietary Approaches to Stop Hypertension; Healthy Eating=based on the Harvard Healthy Eating Pyramid guidelines; NA=not applicable. 95% confidence interval given for the heritability estimate.
Effect size reflecting the change in serum urate level (μmol/L) per one unit increase in diet score or genetic risk score.
Partial R2 value (R2 B) converted to a percentage (R2×100), except in the final row where it represents the heritability estimate.
A random effect model was used in the meta-analysis (PQ<0.1).
Given that foods are rarely consumed in isolation, and significant correlations (PCor<0.001) were observed between every food item and at least one other food item (supplementary materials, fig S8), the diet wide analysis was repeated with adjustment for the diet scores to account for confounding owing to usual dietary habits. Eight (beer, liquor, cold cereal, skim milk, cheese, brown bread, margarine, and eggs) of the 14 significant food items in the full cohort remained significantly associated after adjustment for each of the four dietary scores (supplementary materials, table S5). Non-citrus fruit was non-significant after adjustment for each of the four diet scores. Peanuts, meat (beef, pork, or lamb), potatoes, soft drink, and poultry all had an attenuated association after adjustment for one (or more) of the separate diet scores. Adjustment for the Healthy Eating, DASH, and Mediterranean diet scores resulted in consistently significant associations between serum urate levels and fish consumption, while legumes, tomatoes, and white bread also had significant associations after adjustment for one or more of the separate diet scores. In the male cohort, five (beer, wine, eggs, skim milk, and brown bread) of the nine previously associated foods maintained their significance after adjustment for each of the four diet scores separately (supplementary materials, table S6). Peanuts and cold cereal did not maintain their significance after adjustment for the DASH diet score (supplementary materials, table S6). In the female cohort, only beer, liquor, cheese, and skim milk maintained their significance after the diet score adjustments. Margarine maintained significance when adjusted for three of the four diet scores. Brown bread and cold cereal were not significant after adjustment for each of the four dietary scores separately (supplementary materials, table S7).
Variance in serum urate explained by dietary scores and inherited genetic variants
Individually, the 14 food items associating with serum urate in the full cohort explained 0.06% to 0.99% of the variation in serum urate levels, and summed they explained 3.28% of the variation (table 1). All 63 food items, when summed, explained 4.29% of variation in serum urate levels (supplementary materials, table S5). Food groups (fruit, vegetables, meat, and dairy products) explained between 0.16% and 0.52% of variation in serum urate levels (supplementary materials, table S5). Unadjusted by the genetic risk score, the DASH diet score explained more of the variation in serum urate levels in the full cohort (0.28%; table 2) than the Healthy Eating (0.15%), Mediterranean (0.06%), or data driven (0.16%) diet scores, but each diet score explained less variation in serum urate than the most strongly associated individual food items (table 1).
In contrast, 30 genetic variants previously associated with serum urate levels at a genome wide level of significance in Europeans additively explained 8.7% of the variance in serum urate levels in the full cohort (excluding the NHANES III study; supplementary materials, table S8). A weighted serum urate genetic risk score constructed from these 30 variants,14 unadjusted by any dietary score, explained 7.9% of the variance (table 2). When included in models with the dietary scores, the percentage variance explained did not substantially change in the full, male, and female cohorts (maximum difference of 0.04%; table 2). The percentage variance explained by the dietary scores after adjustment for the genetic risk score fluctuated from a −0.09% difference for the data driven diet pattern in the male cohort to a +0.13% difference in the Mediterranean diet score in the male cohort (table 2). Genome wide estimations of serum urate heritability explained 23.9% of variance in serum urate levels in the full cohort (excluding the NHANES III study). The heritability estimates were 23.8% in the male cohort and 40.3% in the female cohort. Only the DASH diet score showed any evidence for an interaction with the weighted genetic risk score, and only in the female cohort (P=0.04); for all other interactions the P value was ≥0.21 (supplementary materials, table S9).
Discussion
Principal findings
Fifteen different food items were significantly associated with serum urate levels. These foods included six established urate modifying foods: beer, liquor, wine, soft drink, skim milk, and meat (beef, pork, or lamb). The nine other foods included two less established urate modifying foods (cheese and non-citrus fruit) and seven food items without established associations (poultry, potatoes, brown bread, peanuts, margarine, cold cereal, and eggs). The associations observed in this diet wide study with known, confirmed serum urate influencing food items were consistent in direction of effect and magnitude with previously reported associations (urate raising: beer, liquor, wine, soft drinks, and meat (beef, pork, or lamb); urate lowering: skim milk; table 1). However, each of these established foods explained less than 1% of variation in serum urate levels within the full cohort. Similarly, the diet scores explained very little variance in serum urate levels (0.28% for the DASH diet, 0.15% for the Healthy Eating diet, 0.06% for the Mediterranean diet, and 0.16% for the data driven diet pattern; table 2). In comparison, the heritability explained by common genetic variants, was estimated to be 23.9%, with a weighted genome wide association study identified genetic risk score explaining 7.9% of the variability in serum urate levels (table 2). Thus, in the datasets analysed here, overall diet explains much less variance in serum urate levels when compared with inherited genetic variants.
Strengths and limitations of study
The primary limitation to our study was the use of differing food frequency questionnaires between studies, which led to methodological challenges when combining the study specific effects and could have led to the study participants giving information of variable accuracy between studies. To circumvent these issues, the food frequency data were carefully inspected for between study comparability and several quality controls were applied to the data before use. Adjustment for estimated average daily calorie intake was also consistently performed during analysis to further minimise any bias or inaccuracies caused by these differing questionnaires. Owing to the differing questionnaires between studies, some food items were unable to be included in the diet wide analysis. These exclusions could have resulted in this study not including some foods that have real effects on urate; however, the number of these exclusions was minimal (several items per study, none in the ARIC study). Where the exclusion of a question only occurred in one cohort (owing to non-comparability of the question), it is possible that the analysis of the remaining cohorts had a reduction in power to detect an effect. Given that data were collected at different times (from 1985 to 2005) food compositions might also have changed, resulting in unintentional combining of non-comparable food items in this analysis. This situation might be particularly important when processed foods are being assessed (such as cereals, bread, and mayonnaise or dressing).53 This consideration is also important for the generalisation of results to the present day or to other countries. Our study population included individuals of European ancestry living in the US, and the dietary and genetic analysis might not be generalisable to other populations. Additionally, as with any large scale set of analyses, the likelihood of finding a falsely significant result increases with every extra test added. The application of a Bonferroni correction to account for this multiple testing effect reduces this likelihood. However, some of the food items that were nominally significant (P<0.05) could have had a real effect undetected in this study (type II error). Furthermore, measurement error of dietary intake will contribute to suppressed R2 estimates of the contribution of diet to variance in serum urate levels relative to that of the genetic R2 estimates,54 which will have minimal measurement error. Finally, a heritable component to food preferences has been reported in other studies, including food and alcohol consumption,25 26 27 implying non-independence between the diet scores and the genetic risk score. To mitigate this non-independence, the additionally adjusted analyses presented in table 2 included both diet and genetic risk scores in the same model.
Comparison with other studies
Owing to the diet wide approach to our analysis, associations with novel and less established foods were identified. Of the nine novel or less established associations, we found some evidence in the literature to support the associations of cheese, non-citrus fruit, egg, brown bread, and cold cereal. Egg consumption has previously been associated with reduced urate levels in a Croatian study and protection from hyperuricaemia in a Taiwanese Nutrition and Health Survey.55 56 A third study showed no noticeable association with the risk of hyperuricaemia in elderly Taiwanese men, although a trend towards protection was evident.57 Finally, association between egg consumption and increased serum urate levels has been reported in two cohorts of European ancestry.58 Certainly the current cumulative evidence is ambiguous regarding a possible role for egg consumption in urate control. We also observed an association between non-citrus fruit and reduced serum urate levels, which is supported by association of fruit consumption with reduced urate levels in an Australian cohort.58 The loss of significance (in the full cohort) when the association of non-citrus fruit with serum urate was adjusted for the diet scores could indicate that greater consumption of fruit is reflective of differing general dietary habits (also inferred from the correlation matrix; supplementary materials, fig S8) and could reflect confounding due to healthier dietary habits. Coarse bread and cheese were associated with reduced urate levels in two cohorts of European ancestry, and cereal in one of two cohorts of European ancestry.58 This finding supports our data associating brown bread, cold cereal, and cheese with reduced serum urate levels. We are not aware of other studies specifically testing for association of potatoes, peanuts, and margarine consumption with serum urate levels. Thus these findings need to be replicated before they can be identified as genuine urate raising or urate lowering foods.
Several studies have used food frequency data to estimate the effect of dietary habits on serum urate levels (similar to the various diet score analyses presented here) with varying results. Heidemann and colleagues used a factor analysis to create two indicators of dietary habits in a group of German individuals.59 This study showed that individuals whose diet was characterised by high intake of refined grains, processed meats, eggs, and sugar sweetened beverages (processed food dietary pattern) had higher urate levels than people who did not commonly eat these foods. We also used factor analysis, identifying a dietary pattern, comprising non-citrus juice, soft drinks, butter, white bread, pasta, meat (beef, pork, or lamb), and chips or popcorn, within the five combined cohorts. Given that this pattern includes similar foods to those in Heidemann and colleagues’ processed food pattern and several established urate raising foods, the association with raised serum urate levels (β=0.57 μmol/L per unit change; table 2) was not unexpected. When Heidemann and colleagues reversed their analysis using a diet score that represented a health conscious dietary pattern (characterised by a high intake of fruit, vegetables, and whole grains), no association with serum urate was seen.59 This result contradicts our study results, for both the individual effects of non-citrus fruit and brown bread, and the urate lowering influence of the three dietary scores constructed based on conventional healthy diet advice. In another study that assessed the association between estimates of three dietary patterns and serum urate levels in Taiwanese individuals, researchers found no noticeable association between urate levels and estimates of a urate raising dietary pattern (consuming high levels of seafood, meat, sugar sweetened beverages, and organ meats), a fish and fried food dietary pattern, or a vegetable and fruit dietary pattern. They posited that other clinical factors such as obesity and concomitant drugs are more important than diet in determining serum urate levels,60 a suggestion supported by the greater effect of genetics versus diet observed here.
Our results using the DASH diet score compare well with those from the randomised control trial by Juraschek and colleagues, who showed an average reduction of serum urate of 21 μmol/L (0.35 mg/dL) when comparing the DASH diet with an average American diet in individuals with prehypertension or stage 1 hypertension.23 There was a greater reduction of 77 μmol/L (1.29 mg/dL) in participants with hyperuricaemia (although the trial had very few participants with hyperuricaemia, n=8). In our analysis, the DASH diet scores varied from 8 to 40, with each unit increase in score associated with a 0.73 μmol/L decrease in serum urate. This finding corresponds with a decrease of 23.4 μmol/L between the least DASH-like diet and the most DASH-like diet, comparable to the decrease of 21 μmol/L reported by Juraschek and colleagues.23 Certainly, if a DASH diet can be maintained outside the research setting, our data as well as those from the Juraschek trial indicate that relative to a non-DASH diet,23 a clinically relevant decrease in serum urate levels can be achieved. However, implementation of the DASH diet might not be straightforward. This diet was reported two decades ago,45 but the barriers to implementing this diet both at the population level and in a primary care setting are yet to be overcome.61
Conclusions
This study has identified an association between estimates of healthier dietary habits and reduced serum urate levels in people of European ancestry. Aside from the CHS cohort for which gout ascertainment information was not available, the study population excluded people with a diagnosis of gout or those taking urate lowering drugs, and therefore these results cannot be generalised to people with gout or to people of non-European ancestry. Our data are important in showing the relative contributions of overall diet and inherited genetic factors to the population variance of serum urate levels. Our results challenge widely held community perceptions that hyperuricaemia is primarily caused by diet,62 63 64 65 showing that genetic variants have a much greater contribution to hyperuricaemia in the general population than dietary exposure.
What is already known on this topic
Serum urate levels are influenced by genetic and environmental exposure, including specific foods
What this study adds
Estimates of dietary patterns were associated with serum urate levels in individuals of European ancestry in the United States
Individual food items and estimates of dietary patterns explain very little variation in serum urate levels
Genetic variants explain substantially more of the variation in serum urate levels compared with dietary patterns
Acknowledgments
The ARIC study is carried out as a collaborative study supported by National Heart, Lung, and Blood Institute contracts N01-HC-55015, N01-HC-55016, N01-HC-55018, N01-HC-55019, N01-HC-55020, N01-HC-55021, N01-HC-55022, R01HL087641, R01HL59367, and R01HL086694; National Human Genome Research Institute contract U01HG004402; and National Institutes of Health contract HHSN268200625226C. Infrastructure was partly supported by Grant Number UL1RR025005, a component of the National Institutes of Health and NIH Roadmap for Medical Research. The FHS and the Framingham SHARe project are conducted and supported by the National Heart, Lung, and Blood Institute in collaboration with Boston University. The Framingham SHARe data used for the analyses described in this manuscript were obtained through the Database of Genotypes and Phenotypes. The CHS research reported in this article was supported by contract numbers N01-HC-85079, N01-HC-85080, N01-HC-85081, N01-HC-85082, N01-HC-85083, N01-HC-85084, N01-HC-85085, N01-HC-85086, N01-HC-35129, N01 HC-15103, N01 HC-55222, N01-HC-75150, N01-HC-45133, N01-HC-85239, and HHSN268201200036C; grant numbers U01 HL080295 from the National Heart, Lung, and Blood Institute and R01 AG-023629 from the National Institute on Ageing, with additional contribution from the National Institute of Neurological Disorders and Stroke. A full list of principal CHS investigators and institutions can be found at www.chs-nhlbi.org/pi.htm. The Coronary Artery Risk Development in Young Adults Study (CARDIA) is conducted and supported by the National Heart, Lung, and Blood Institute (NHLBI) in collaboration with the University of Alabama at Birmingham (N01-HC95095 and N01-HC48047), University of Minnesota (N01-HC48048), Northwestern University (N01-HC48049), and Kaiser Foundation Research Institute (N01-HC48050).
We thank the staff, participants, and funding bodies of the ARIC, CARDIA, CHS, FHS, and NHANES III studies for their important contributions. This manuscript was not prepared in collaboration with, nor approved by, investigators of the ARIC, CARDIA, CHS, FHS, or NHANES III studies and does not necessarily reflect the opinions or views of these studies or their institutions or funding bodies (Boston University, or the National Heart, Lung and Blood Institute). We thank the Centres for Disease Control and Prevention (CDC) and National Centre for Health Statistics (NCHS) (Hyattsville, MD) for data from NHANES.
Web Extra.
Extra material supplied by the author
Supplementary materials 1: Supplemental methods, tables S1-S9, and figures S1-S8
Contributors: TJM, ND, and TRM conceived the study. TJM and RKT managed and analysed the data. TJM and TRM wrote the manuscript. ND and RKT commented on drafts. All authors had full access to the data in the study and can take responsibility for the integrity of the data and accuracy of the data analysis. TRM is the guarantor. The corresponding author attests that all listed authors meet authorship criteria and that no others meeting the criteria have been omitted.
Funding: This work was supported by the Health Research Council of New Zealand and the University of Otago. The Sponsors had no role in designing, carrying out, and reporting the study.
Competing interests: All authors have completed the ICMJE uniform disclosure form at www.icmje.org/coi_disclosure.pdf and declare: ND has received consulting fees, speaker fees, or grants from the following companies who have developed or marketed urate lowering drugs for management of gout: Takeda, Ardea Biosciences/AstraZeneca, Cymabay/Kowa, and Crealta/Horizon. TRM has received grants from Ardea Biosciences/AstraZeneca and Ironwood Pharmaceuticals.
Ethical approval: The ARIC, FHS, CHS, and CARDIA datasets were accessed through the Database of Genotype and Phenotype (www.ncbi.nlm.nih.gov/gap) via approval #834 and access was approved by the relevant Data Access Committees. All participants, including those in the NHANES III study, gave their written informed consent.
Data sharing: Code available from the corresponding author at tony.merriman@otago.ac.nz. Dataset also available provided that the requestor has the appropriate Database of Genotype and Phenotype approval.
The manuscript’s guarantor affirms that the manuscript is an honest, accurate, and transparent account of the study being reported; that no important aspects of the study have been omitted; and that any discrepancies from the study as planned have been explained.
References
- 1. Choi HK, Ford ES. Prevalence of the metabolic syndrome in individuals with hyperuricemia. Am J Med 2007;120:442-7 10.1016/j.amjmed.2006.06.040 [DOI] [PubMed] [Google Scholar]
- 2. Niskanen LK, Laaksonen DE, Nyyssonen K, et al. Uric acid level as a risk factor for cardiovascular and all-cause mortality in middle-aged men: A prospective cohort study. Arch Intern Med 2004;164:1546-51 10.1001/archinte.164.14.1546 [DOI] [PubMed] [Google Scholar]
- 3. Winnard D, Wright C, Jackson G, et al. Gout, diabetes and cardiovascular disease in the Aotearoa New Zealand adult population: co-prevalence and implications for clinical practice. N Z Med J 2013;126:53-64 [PubMed] [Google Scholar]
- 4. Zhu Y, Pandya BJ, Choi HK. Comorbidities of gout and hyperuricemia in the US general population: NHANES 2007-2008. Am J Med 2012;125:679-87 10.1016/j.amjmed.2011.09.033 [DOI] [PubMed] [Google Scholar]
- 5. Dalbeth N, Merriman TR, Stamp LK. Gout. Lancet 2016;388:2039-52 10.1016/S0140-6736(16)00346-9 [DOI] [PubMed] [Google Scholar]
- 6. Duan H-P, Pang Z-C, Zhang D-F, et al. Heritability of serum uric acid in adult twins. Zhonghua Liu Xing Bing Xue Za Zhi 2010;31:384-8 [PubMed] [Google Scholar]
- 7. Friedlander Y, Kark J, Stein Y. Family resemblance for serum uric acid in a Jerusalem sample of families. Hum Genet 1988;79:58-63 10.1007/BF00291711 [DOI] [PubMed] [Google Scholar]
- 8. Gulbrandsen C, Morton N, Rao D, Rhoads GG, Kagan A. Determinants of plasma uric acid. Hum Genet 1979;50:307-12 10.1007/BF00399397 [DOI] [PubMed] [Google Scholar]
- 9. Kalousdian S, Fabsitz R, Havlik R, Christian J, Rosenman R. Heritability of clinical chemistries in an older twin cohort: the NHLBI Twin Study. Genet Epidemiol 1987;4:1-11 10.1002/gepi.1370040102 [DOI] [PubMed] [Google Scholar]
- 10. Krishnan E, Lessov-Schlaggar CN, Krasnow RE, Swan GE. Nature versus nurture in gout: A twin study. Am J Med 2012;125:499-504 10.1016/j.amjmed.2011.11.010 [DOI] [PubMed] [Google Scholar]
- 11. Rice T, Vogler GP, Perry TS, Laskarzewski PM, Province MA, Rao DC. Heterogeneity in the familial aggregation of fasting serum uric acid level in five North American populations: the lipid research clinics family study. Am J Med Genet 1990;36:219-25 10.1002/ajmg.1320360216 [DOI] [PubMed] [Google Scholar]
- 12. Voruganti VS, Goring HH, Mottl A, et al. Genetic influence on variation in serum uric acid in American Indians: the strong heart family study. Hum Genet 2009;126:667-76 10.1007/s00439-009-0716-8 [DOI] [PMC free article] [PubMed] [Google Scholar]
- 13. Wilk JB, Djousse L, Borecki I, et al. Segregation analysis of serum uric acid in the NHLBI Family Heart Study. Hum Genet 2000;106:355-9 10.1007/s004390051050 [DOI] [PubMed] [Google Scholar]
- 14. Köttgen A, Albrecht E, Teumer A, et al. Genome-wide association analyses identify 18 new loci associated with serum urate concentrations. Nat Genet 2013;45:145-54 10.1038/ng.2500 [DOI] [PMC free article] [PubMed] [Google Scholar]
- 15. Nuki G, Simkin PA. A concise history of gout and hyperuricemia and their treatment. Arthritis Res Ther 2006;8:S1 10.1186/ar1906 [DOI] [PMC free article] [PubMed] [Google Scholar]
- 16. Porter R, Rousseau GS. Gout: The patrician malady. Yale University Press, 1998. [Google Scholar]
- 17. Choi HK, Curhan G. Coffee, tea, and caffeine consumption and serum uric acid level: The Third National Health and Nutrition Examination Survey. Arthritis Rheum 2007;57:816-21 10.1002/art.22762 [DOI] [PubMed] [Google Scholar]
- 18. Choi JW, Ford ES, Gao X, Choi HK. Sugar-sweetened soft drinks, diet soft drinks, and serum uric acid level: The Third National Health and Nutrition Examination Survey. Arthritis Rheum 2008;59:109-16 10.1002/art.23245 [DOI] [PubMed] [Google Scholar]
- 19. Choi HK, Liu S, Curhan G. Intake of purine-rich foods, protein, and dairy products and relationship to serum levels of uric acid: the Third National Health and Nutrition Examination Survey. Arthritis Rheum 2005;52:283-9 10.1002/art.20761 [DOI] [PubMed] [Google Scholar]
- 20. Flynn TJ, Cadzow M, Dalbeth N, et al. Positive association of tomato consumption with serum urate: support for tomato consumption as an anecdotal trigger of gout flares. BMC Musculoskelet Disord 2015;16:196 10.1186/s12891-015-0661-8 [DOI] [PMC free article] [PubMed] [Google Scholar]
- 21. Choi HK, Curhan G. Beer, liquor, and wine consumption and serum uric acid level: the Third National Health and Nutrition Examination Survey. Arthritis Rheum 2004;51:1023-9 10.1002/art.20821 [DOI] [PubMed] [Google Scholar]
- 22. Kontogianni MD, Chrysohoou C, Panagiotakos DB, et al. Adherence to the Mediterranean diet and serum uric acid: the ATTICA study. Scand J Rheumatol 2012;41:442-9 10.3109/03009742.2012.679964 [DOI] [PubMed] [Google Scholar]
- 23. Juraschek SP, Gelber AC, Choi HK, Appel LJ, Miller ER., 3rd Effects of the dietary approaches to Stop hypertension (DASH) diet and sodium intake on serum uric acid. Arthritis Rheumatol 2016;68:3002-9 10.1002/art.39813 [DOI] [PMC free article] [PubMed] [Google Scholar]
- 24. Rai SK, Fung TT, Lu N, Keller SF, Curhan GC, Choi HK. The Dietary Approaches to Stop Hypertension (DASH) diet, Western diet, and risk of gout in men: prospective cohort study. BMJ 2017;357:j1794 10.1136/bmj.j1794 [DOI] [PMC free article] [PubMed] [Google Scholar]
- 25. Yang A, Palmer AA, de Wit H. Genetics of caffeine consumption and responses to caffeine. Psychopharmacology (Berl) 2010;211:245-57 10.1007/s00213-010-1900-1 [DOI] [PMC free article] [PubMed] [Google Scholar]
- 26. Verhulst B, Neale MC, Kendler KS. The heritability of alcohol use disorders: a meta-analysis of twin and adoption studies. Psychol Med 2015;45:1061-72 10.1017/S0033291714002165 [DOI] [PMC free article] [PubMed] [Google Scholar]
- 27. Treur JL, Boomsma DI, Ligthart L, Willemsen G, Vink JM. Heritability of high sugar consumption through drinks and the genetic correlation with substance use. Am J Clin Nutr 2016;104:1144-50 10.3945/ajcn.115.127324 [DOI] [PubMed] [Google Scholar]
- 28. Cornelis MC, Byrne EM, Esko T, et al. Genome-wide meta-analysis identified six novel loci associated with habitual coffee consumption. Mol Psychiatry 2015;20:647-56 10.1038/mp.2014.107 [DOI] [PMC free article] [PubMed] [Google Scholar]
- 29. Clarke T-J, Adams MJ, Davies G, et al. Genome-wide association study of alcohol consumption and genetic overlap with other health-related trtaits in UK Biobank (N=122 117). Mol Psychiatry 2017;22:1376-84 10.1038/mp.2017.153 [DOI] [PMC free article] [PubMed] [Google Scholar]
- 30. Kumanyika S, Tell GS, Fried L, Martel JK, Chinchilli VM. Picture-sort method for administering a food frequency questionnaire to older adults. J Am Diet Assoc 1996;96:137-44 10.1016/S0002-8223(96)00042-9 [DOI] [PubMed] [Google Scholar]
- 31. Rimm EB, Giovannucci EL, Stampfer MJ, Colditz GA, Litin LB, Willett WC. Reproducibility and validity of an expanded self-administered semiquantitative food frequency questionnaire among male health professionals. Am J Epidemiol 1992;135:1114-26 10.1093/oxfordjournals.aje.a116211 [DOI] [PubMed] [Google Scholar]
- 32. Salvini S, Hunter DJ, Sampson L, et al. Food-based validation of a dietary questionnaire: The effects of week-to-week variation in food consumption. Int J Epidemiol 1989;18:858-67 10.1093/ije/18.4.858 [DOI] [PubMed] [Google Scholar]
- 33. Stevens J, Metcalf PA, Dennis BH, Tell GS, Shimakawa T, Folsom MD. Reliability of a food frequency questionnaire by ethnicity, gender, age and education. Nutr Res 1996;16:735-45 10.1016/0271-5317(96)00064-4 [DOI] [Google Scholar]
- 34. Willett WC, Sampson L, Stampfer MJ, et al. Reproducibility and validity of a semiquantitative food frequency questionnaire. Am J Epidemiol 1985;122:51-65 10.1093/oxfordjournals.aje.a114086 [DOI] [PubMed] [Google Scholar]
- 35. McDonald A, Van Horn L, Slattery M, et al. The CARDIA dietary history: development, implementation, and evaluation. J Am Diet Assoc 1991;91:1104-12. [PubMed] [Google Scholar]
- 36. Schakel SF, Buzzard IM, Gebhardt SE. Procedures for estimating nutrient values for food composition databases. J Food Compos Anal 1997;10:102-14 10.1006/jfca.1997.0527 [DOI] [Google Scholar]
- 37. National Center for Health Statistics Plan and operation of the Third National Health and Nutritional Examination Survey, 1988-94. Series 1: programs and collection procedures. Vital Health Stat 1994;1:1-407. [PubMed] [Google Scholar]
- 38. ARIC Investigators The Atherosclerosis Risk in Communities (ARIC) study: design and objectives. Am J Epidemiol 1989;129:687-702 10.1093/oxfordjournals.aje.a115184 [DOI] [PubMed] [Google Scholar]
- 39. Henry R, Sobel C, Kim J. A modified carbonate-phosphotungstate method for the determination of uric acid and comparison with the spectrophotometric uricase method. Am J Clin Pathol 1957;28:152-60 10.1093/ajcp/28.2.152 [DOI] [PubMed] [Google Scholar]
- 40. Jiang Y, Liu O, Xu G. Assessment of the trueness and inter-laboratory precision of routine uric acid assays using 4 frozen pooled serum samples measured by the Japan Society of Clinical Chemistry’s HPLC method. Ann Lab Med 2014;34:104-10 10.3343/alm.2014.34.2.104 [DOI] [PMC free article] [PubMed] [Google Scholar]
- 41. Cushman M, Cornell ES, Howard PR, Bovill EG, Tracy RP. Laboratory methods and quality assurance in the Cardiovascular Health Study. Clin Chem 1995;41:264-70. [PubMed] [Google Scholar]
- 42. Crowley LV. Determination of uric acid an automated analysis based on a carbonate method. Clin Chem 1964;10:838-44. [PubMed] [Google Scholar]
- 43. Nettleton JA, Hivert M-F, Lemaitre RN, et al. Meta-analysis investigating associations between healthy diet and fasting glucose and insulin levels and modification by loci associated with glucose homeostasis in data from 15 cohorts. Am J Epidemiol 2013;177:103-15 10.1093/aje/kws297 [DOI] [PMC free article] [PubMed] [Google Scholar]
- 44.Department of Nutrition Harvard. The Nutrition Source: Harvard T.H. Chan School of Public Health. Secondary The Nutrition Source: Harvard T.H. Chan School of Public Health 2015. https://www.hsph.harvard.edu/nutritionsource/healthy-eating-plate/.
- 45. Appel LJ, Moore TJ, Obarzanek E, et al. A clinical trial of the effects of dietary patterns on blood pressure. N Engl J Med 1997;336:1117-24 10.1056/NEJM199704173361601 [DOI] [PubMed] [Google Scholar]
- 46. Fung TT, Chiuve SE, McCullough ML, Rexrode ML, Logroscino G, Hu FB. Adherence to a DASH-style diet and risk of coronary heart disease and stroke in women. Arch Intern Med 2008;168:713-20 10.1001/archinte.168.7.713 [DOI] [PubMed] [Google Scholar]
- 47. Panagiotakos DB, Pitsavos C, Stefanadis C. Dietary patterns: A Mediterranean diet score and its relation to clinical and biological markers of cardiovascular disease risk. Nutr Metab Cardiovasc Dis 2006;16:559-68 10.1016/j.numecd.2005.08.006 [DOI] [PubMed] [Google Scholar]
- 48. Panaretos D, Tzavelas G, Vamvakari M, Panagiotakos D. Factor analysis as a tool for pattern recognition in biomedical research; a review with application in R software. J Data Sci 2017;16:615-30. [Google Scholar]
- 49. Yang J, Lee SH, Goddard ME, Visscher PM. GCTA: a tool for genome-wide complex trait analysis. Am J Hum Genet 2011;88:76-82 10.1016/j.ajhg.2010.11.011 [DOI] [PMC free article] [PubMed] [Google Scholar]
- 50. Winnard D, Kake T, Gow P, et al. Debunking the myths to provide 21st Century management of gout. N Z Med J 2008;121:1274. [PubMed] [Google Scholar]
- 51. Gao X, Qi L, Qiao N, et al. Intake of added sugar and sugar-sweetened drink and serum uric acid concentration in US men and women. Hypertension 2007;50:306-12 10.1161/HYPERTENSIONAHA.107.091041 [DOI] [PubMed] [Google Scholar]
- 52. Zgaga L, Theodoratou E, Kyle J, et al. The association of dietary intake of purine-rich vegetables, sugar-sweetened beverages and dairy with plasma urate, in a cross-sectional study. PLoS One 2012;7:e38123 10.1371/journal.pone.0038123 [DOI] [PMC free article] [PubMed] [Google Scholar]
- 53. Johnson RJ. The Fat Switch. Second Edition ed. mercola.com, 2012. [Google Scholar]
- 54. Freedman LS, Schatzkin A, Midthune D, Kipnis V. Dealing with dietary measurement error in nutritional cohort studies. J Natl Cancer Inst 2011;103:1086-92 10.1093/jnci/djr189 [DOI] [PMC free article] [PubMed] [Google Scholar]
- 55. Jerončić I, Mulić R, Klišmanić Z, Rudan D, Boban M, Zgaga L. Interactions between genetic variants in glucose transporter type 9 (SLC2A9) and dietary habits in serum uric acid regulation. Croat Med J 2010;51:40-7 10.3325/cmj.2010.51.40 [DOI] [PMC free article] [PubMed] [Google Scholar]
- 56. Chuang S-Y, Lee S-C, Hsieh Y-T, Pan W-H. Trends in hyperuricemia and gout prevalence: Nutrition and Health Survey in Taiwan from 1993-1996 to 2005-2008. Asia Pac J Clin Nutr 2011;20:301-8. [PubMed] [Google Scholar]
- 57. Chang WC. Dietary intake and the risk of hyperuricemia, gout and chronic kidney disease in elderly Taiwanese men. Aging Male 2011;14:195-202 10.3109/13685538.2010.512372 [DOI] [PubMed] [Google Scholar]
- 58. Zykova SN, Storhaug HM, Toft I, Chadban SJ, Jenssen TG, White SL. Cross-sectional analysis of nutrition and serum uric acid in two Caucasian cohorts: the AusDiab Study and the Tromso study. Nutr J 2015;14:49 10.1186/s12937-015-0032-1 [DOI] [PMC free article] [PubMed] [Google Scholar]
- 59. Heidemann C, Scheidt-Nave C, Richter A, Mensink G. Dietary patterns are associated with cardiometabolic risk factors in a representative study population of German adults. Br J Nutr 2011;106:1253-62 10.1017/S0007114511001504 [DOI] [PubMed] [Google Scholar]
- 60. Tsai Y-T, Liu J-P, Tu Y-K, et al. Relationship between dietary patterns and serum uric acid concentrations among ethnic Chinese adults in Taiwan. Asia Pac J Clin Nutr 2012;21:263-70. [PubMed] [Google Scholar]
- 61. Steinberg D, Bennett GG, Svetkey L. The DASH diet, 20 years later. JAMA 2017;317:1529-30 10.1001/jama.2017.1628 [DOI] [PMC free article] [PubMed] [Google Scholar]
- 62. Dalbeth N, Petrie KJ, House M, et al. Illness perceptions in patients with gout and the relationship with progression of musculoskeletal disability. Arthritis Care Res (Hoboken) 2011;63:1605-12 10.1002/acr.20570 [DOI] [PubMed] [Google Scholar]
- 63. Duyck SD, Petrie KJ, Dalbeth N. “You Don’t Have to Be a Drinker to Get Gout, But It Helps”: A Content Analysis of the Depiction of Gout in Popular Newspapers. Arthritis Care Res (Hoboken) 2016;68:1721-5 10.1002/acr.22879 [DOI] [PubMed] [Google Scholar]
- 64. Spaetgens B, Pustjens T, Scheepers LE, Janssens HJEM, van der Linden S, Boonen A. Knowledge, illness perceptions and stated clinical practice behaviour in management of gout: a mixed methods study in general practice. Clin Rheumatol 2016;35:2053-61 10.1007/s10067-016-3212-2 [DOI] [PMC free article] [PubMed] [Google Scholar]
- 65. Spencer K, Carr A, Doherty M. Patient and provider barriers to effective management of gout in general practice: a qualitative study. Ann Rheum Dis 2012;71:1490-5 10.1136/annrheumdis-2011-200801 [DOI] [PubMed] [Google Scholar]
Associated Data
This section collects any data citations, data availability statements, or supplementary materials included in this article.
Supplementary Materials
Supplementary materials 1: Supplemental methods, tables S1-S9, and figures S1-S8