

Abstract
Background and Objectives
Patients with isolated colorectal‐cancer‐liver‐metastases (CRCLM) frequently undergo metastatectomy. Tumor‐infiltrating‐lymphocytes (TILs) have prognostic potential in the setting of primary colorectal cancer, however, their role in CRCLM is less studied. We aimed to study the spatial distribution and prognostic role of tumor‐infiltrating CD8+ cytotoxic T‐cells and FoxP3+ regulatory T‐cells at the metastatic site of CRCLM patients.
Methods
TILs were isolated from fresh metastatic tissues of 47 patients with CRCLM. Archived paraffin‐embedded tissue, from the same patients, was retrieved. CD8+ and FoxP3+ cells, both in the intra‐tumoral and the peri‐tumoral compartments, were measured by immunohistochemistry on full tissue sections. Proportions of cytotoxic T‐cells (CD8+) and regulatory T‐cells (CD4+CD25+FoxP3+), within CD45+TILs, were measured by flow‐cytometry.
Results
By immunohistochemistry, individual densities of intra‐tumoral or peri‐tumoral CD8+ and FoxP3+ cells were not prognostic of survival. However, the intra‐tumoral, but not the peri‐tumoral, CD8+/FoxP3+ ratio was an independent predictor of survival (HR 0.43, 95%CI 0.19‐0.95, P = 0.032). By flow cytometry, the intra‐tumoral CD8+/regulatory T‐cell ratio was also an independent predictor of survival (HR 0.45, 95%CI 0.20‐0.99, P = 0.044).
Conclusions
The ratio of cytotoxic (CD8+) to regulatory (FoxP3+) T‐cells, in the intra‐tumoral compartment, but not in the peri‐tumoral compartment, can predict survival after resection of CRCLM.
Keywords: biomarkers, colorectal cancer, FoxP3, metastasis, tumor infiltrating lymphocytes
Abbreviations
- CRCLM
colorectal cancer liver metastasis
- CRS
clinical risk score
- TIL
tumor infiltrating lymphocytes
- TMA
Tissue microarray
- Tregs
T‐regulatory cells
1. INTRODUCTION
Colorectal cancer is a leading cause of cancer death.1 It is now standard for limited colorectal‐cancer‐liver metastases (CRCLM) to be considered for resection.2 While clinical characteristics, such as the clinical‐risk score (CRS),3 or the resection margin status,4 can prognosticate patients, the prognostication is far from ideal.
The immune system plays an important role in cancer surveillance and elimination.5 Tumor infiltrating lymphocytes (TILs) have emerged as potential biomarkers in various cancers.6 In primary colorectal cancer TILs represent a robust prognostic biomarker that is superior to clinicopathologic characteristics7, 8 with higher number of TILs associated with improved survival.9, 10, 11 Naturally, the effect of TILs on prognosis has subsequently been studied in the setting of resected CRCLM. Kito et al12 showed that the presence of CD8+ TILs in CRCLM was associated with longer tumor doubling times, while Wagner et al13 showed that TILs isolated from freshly resected CRCLM tumors, and analyzed by flow cytometry, were equally abundant, although more activated, than lymphocytes from the surrounding normal liver tissue. Moreover, at least four studies have directly related the numbers of TILs in CRCLM to patient prognosis.14, 15, 16, 17 Halama et al16 and Katz et al15 showed that TILs present at the invasive margin or in the intratumoral compartment of metastatic CRC lesions, respectively, are associated with improved survival, while Lee et al17 and Nakagawa et al14 showed that only numbers of FoxP3+ regulatory T cells at the metastatic site relate to prognosis.
However, TILs are heterogeneously defined in the literature and different T‐cell subsets have opposite effects.18 While cytotoxic CD8+ T‐lymphocytes have antitumor properties, CD4+CD25+FoxP3+ T‐cells, representing T‐regulatory cells (Tregs), have immunosuppressive and tumor‐supporting properties.19 Another source of heterogeneity is the histologic distribution of TILs at the tumor site. The majority of TILs are concentrated in the peri‐tumoral area and only a minority penetrates to the tumor tissue itself. It is unclear what the relative significance of these TIL cell populations is.
The aim of this study was to examine the composition and spatial distribution of TILs in CRCLM in relation to prognosis. We focused on the role of CD8+ T‐cells and Tregs. We determined the spatial distribution of TILs by using immunohistochemistry on full tissue slides and quantified lymphocytic populations both in the peri‐tumoral and intra‐tumoral areas separately. We hypothesized that TIL infiltration in the intra‐tumoral area will be more prognostic than the peri‐tumoral area and that the ratio of immune effector (CD8+) to immune suppressive (Tregs) T‐cells will be more prognostic than the density of each individual cell type alone. In addition, we used flow‐cytometry on TILs freshly isolated from tumor tissues and compared the results obtained.
2. MATERIALS AND METHODS
2.1. Patient cohort and tissue samples
A total of 47 patients, who underwent resection for CRCLM between September 2009 and November 2011, were enrolled. Fresh liver tumor tissue was used to isolate TILs. Formalin fixed paraffin‐embedded tissue, from these same patients, was retrieved from the archive. Baseline characteristics and follow‐up information were retrospectively collected from the electronic record. The Clinical Risk Score was calculated according to Fong et al.3 Patients were included only when no chemotherapy was given for at least 3 months prior to the metastatectomy. The study protocol conforms to the ethical guidelines of the 1975 Declaration of Helsinki and was approved by the Medical Ethical Committee of Erasmus MC.
2.2. Immunohistochemistry
Four micrometre thick sections were cut and mounted on Superfrost PlusTM slides. For the stainings a Ventana Benchmark Ultra automated staining system (Ventana Medical System, Tuscon, AZ) was used, in a clinical laboratory setting. For CD8 the sectioned specimens were processed for 16 min antigen retrieval using Cell Conditioning Solution (CC1 Ventana Ref.: 950‐124). After 32 min incubation with the primary antibody (clone SP‐57, Ventana Ref.: 950‐124, ready to use) at 36°C, followed by amplification with Optiview amplification kit (Ventana ref.:760‐099), detection and visualization was performed with OptiView Universal DAB detection kit (Ventana Ref.: 760‐700). The sections were counterstained with hematoxylin II (Ventana Ref.: 790‐2208). For Fox‐P3 the same protocol was applied with the exception the sectioned specimens were processed for 64 min antigen retrieval, the primary antibody (clone 236A/E7, e‐bioscience) dilution was 1:100, and amplification was performed with the Ultraview amplification kit (Ventana ref.:760‐080). Representative stainings are seen in Figure 1.
Figure 1.
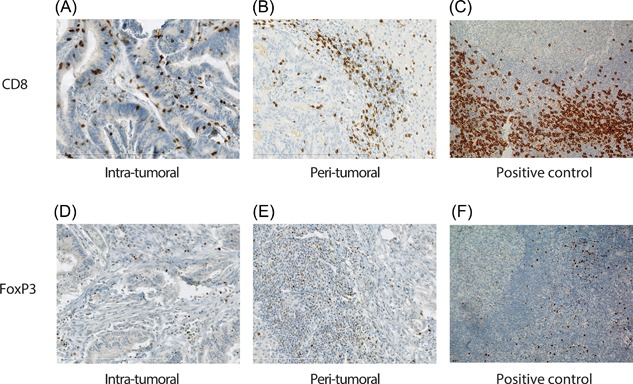
Representative CD8 and FoxP3 immunohistochemical stains. A, Intra‐tumoral and (B) peri‐tumoral CD8+ cells in CRCLM. C, CD8+ cells in positive control tonsil tissue. D, Intra‐tumoral and (E) peri‐tumoral FoxP3+ cells in CRCLM. F, FoxP3+ positive cells in positive control tonsil tissue.
2.3. Evaluation of immunohistochemistry staining
Stained slides were scanned using NanoZoomer 2.0HT (Hamamatsu Photonic, Shizuoka, Japan) at 40×. Automated digital image analysis was performed using the Visiopharm Integrator System (version 4.2.2.0, Visiopharm, Hoersholm, Denmark). For the intra‐tumoral areas several (4‐6) randomly chosen large circular areas were analyzed (Figure 2). Necrotic areas where viable cells were virtually absent were excluded. In many cases the total evaluated intra‐tumoral area represented the majority of the tumor section. For the peri‐tumoral areas, four representative circular areas with a diameter of 0.54 mm (area = 1 high‐power field), at the interphase between tumor and surrounding tissue, were analyzed (Figure 2). The definition of the peri‐tumoral area is similar to Halama et al.16 CD8+ and FoxP3+ cell densities were measured as cells/mm2. All cases were visually reviewed to ensure accuracy.
Figure 2.
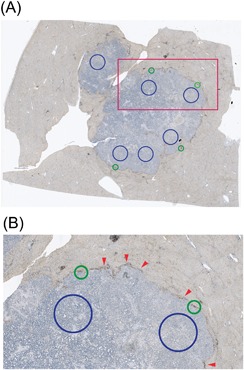
Representative example of areas used for analysis of CD8+ and FoxP3+ cell densities. A, Photograph of full slide. B, Zoom‐in on red square of image (A). Blue circles represent intra‐tumoral areas used for analysis. Green circles represent peri‐tumoral areas used for analysis. The green circles have a diameter of 0.54 mm (area of 0.23 mm2 or 1 HPF). Note that the areas used for peri‐tumoral analysis are centered on the middle of the peri‐tumoral infiltrate. Red arrows indicate the peri‐tumoral infiltrate.
2.4. TIL isolation and flow‐cytometry
Single cell TILs were isolated via tissue digestion as previously described.20, 21 Mononuclear cells were analyzed using the following anti‐human antibodies: PerCP‐labeled anti‐CD8 (SK‐1) and APC‐H7‐labeled anti‐CD4 (SK3) from BD Biosciences; APC‐labeled anti‐FoxP3 (PCH101), PeCy7‐labeled anti‐CD3 (UCTH1), eFluor® 450‐labeled anti‐CD45 (HI30), and PE‐labeled anti‐CD25 (BC96) from e‐bioscience. The gating strategy has been previously described.20 Numbers of CD8+ TILs were defined as the proportion of CD8+ cells within live CD45+ cells, while numbers of T‐regulatory cells were defined as the proportion of CD4+ CD25+ FoxP3+ cells within live CD45+ cells. The gating strategy can be seen in Supplementary Figure S1. More detailed information on TIL isolation and flow‐cytometry analysis can be found in the supplementary information.
2.5. Statistical analysis
All analyses were performed in duplicate. Cancer‐specific survival and recurrence‐free survival were calculated from the date of metastatectomy to the date of event (death from cancer or recurrence of cancer, respectively). Survival curves were estimated by the Kaplan‐Meier method. Differences between survival curves were evaluated by the log‐rank test. In case of no event patients were censored at the date of last follow‐up. The median density or median proportion values of TIL populations were used to discriminate high vresus low groups in both immunohistochemistry and flow‐cytometry. For multivariate analysis, the Cox proportional Hazard regression analysis was used with both the ENTER method and by backwards variable selection. Patients with missing values for the co‐variates of interest were excluded from the statistical analysis. The associations between clinicopathologic parameters and TIL subpopulations were examined using the χ2 tests or the T‐test as appropriate. Sensitivity analysis was performed by excluding the three patients who underwent a second metastatectomy as well as excluding the two patients who had a CEA>200 ng/mL. The statistical analysis was performed using the SPSS© 21 software.
3. RESULTS
3.1. Patients and clinicopathologic characteristics
Median time to recurrence was 13.1 months and median survival was 50.9 months. Cancer recurrence occurred in 37/47 patients while 28/47 patients died from colorectal cancer. Baseline characteristics are seen in Table 1. In univariate analysis only a positive lymph‐node status and a high pre‐operative CEA value were associated with cancer survival (Table 2A), while only the pre‐operative CEA value was associated with cancer recurrence (data not shown).
Table 1.
Baseline characteristics
| Baseline characteristics | N = 47 (% or range) |
|---|---|
| Age (median) | 63.8 (35.2‐84.7) |
| Gender (male/female) | 31 (66.0)/16 (34.0) |
| Clinical risk score | |
| Primary cancer lymph node status positive | 27 (57.4) |
| Time from primary to CRCLM <12 months | 17 (36.2) |
| Largest metastatectomy tumor size >5 cm | 11 (23.4) |
| >1 metastatic lesion | 30 (63.8) |
| CEA >200 ng/mL | 2 (4.7) |
| Margin status positive (R1) | 8 (17.0) |
| Recurrence | 37 (78.7) |
| Cancer specific death | 28 (59.6) |
Table 2.
Univariate Cox proportional Hazard regression analysis of patients’ survival
| Variables | HR | 95%CI | P‐value |
|---|---|---|---|
| (A) Baseline characteristics | |||
| Age (per decade increase) | 0.99 | 0.71‐1.38 | 0.957 |
| Gender (male vs female) | 0.78 | 0.35‐1.64 | 0.485 |
| Primary cancer lymph node status positive | 2.58 | 1.15‐5.78 | 0.022 |
| Time from primary to CRCLM <12 months | 1.01 | 0.47‐2.16 | 0.977 |
| Largest metastatectomy tumor size >5 cm | 1.17 | 0.50‐2.75 | 0.730 |
| >1 metastatic lesion | 1.07 | 0.49‐2.31 | 0.872 |
| CEA >200 ng/mL | 6.88 | 1.82‐25.98 | 0.004 |
| CRS (0‐5) | 1.25 | 0.88‐1.77 | 0.221 |
| Margin Margin status (R0 vs R1) | 1.46 | 0.59‐3.61 | 0.412 |
| (B) TIL parameters a | |||
| CD8 peri‐tumoral area | 0.80 | 0.38‐1.75 | 0.571 |
| FoxP3 peri‐tumoral area | 1.08 | 0.50‐2.29 | 0.852 |
| CD8/FoxP3 peri‐tumoral area | 0.91 | 0.43‐1.95 | 0.813 |
| CD8 intra‐tumoral area | 0.58 | 0.27‐1.27 | 0.169 |
| FoxP3 intra‐tumoral area | 0.83 | 0.39‐1.77 | 0.622 |
| CD8/FoxP3 intra‐tumoral area | 0.43 | 0.19‐0.95 | 0.038 |
Median values were used as cutoffs.
Bold values signify statistically significant parameters.
3.2. CD8+ and FoxP3+ immunohistochemical distribution
The majority of TILs were located in the peri‐tumoral areas (Figure 1 and Figure 2). The median intra‐tumoral CD8+ and FoxP3+ TIL densities were 58.6/mm2 (range 8.8‐795) and 26.4/mm2 (range 0.44‐255), respectively. The median peri‐tumoral CD8+ and FoxP3+ TIL densities were 883/mm2 (range 409‐1731) and 127/mm2 (range 8.4‐525), respectively.
3.3. Prognostic value of intra‐tumoral and peri‐tumoral TILs by immunohistochemistry
Median values were used for cutoffs. Table 2B shows the univariate analysis for the TIL populations in the intra‐tumoral and peri‐tumoral areas, while Figure 3 shows the respective Kaplan‐Meier curves. Neither intra‐tumoral nor peri‐tumoral CD8+ or FoxP3+ TIL densities did, individually, predict colorectal‐cancer survival. An a priori hypothesis was that the ratio of CD8+ to FoxP3+ TILs would be a better prognosticator than the individual TIL sub‐populations. With a median cutoff of 2.42, a high intra‐tumoral CD8+/FoxP3+ TIL ratio was predictive of improved colorectal cancer survival (HR 0.43, 95%CI 0.19‐0.95, P = 0.032). On the other hand, the peri‐tumoral CD8+/FoxP3+ TIL ratio was not predictive of colorectal cancer survival. None of the TIL parameters were predictive of colorectal cancer recurrence.
Figure 3.
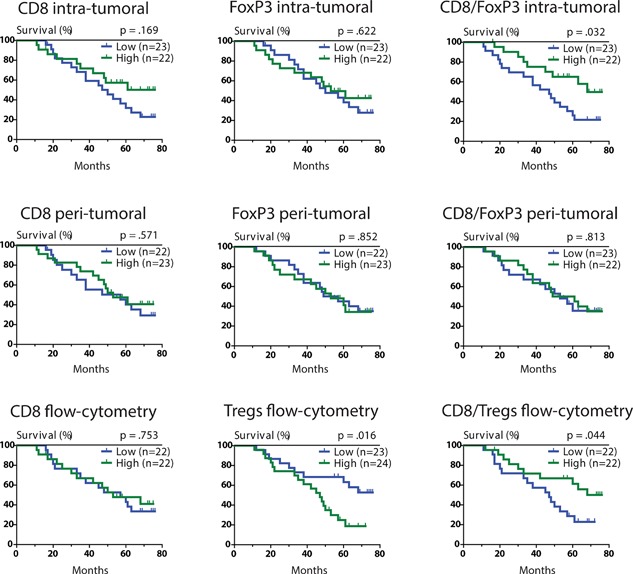
Kaplan Meier curves of potential TIL biomarkers. CD8+ and FoxP3+ cell densities by immunohistochemistry were measured as numbers of cells/mm2 tissue. Cytotoxic T‐cells and Treg proportions by flow‐cytometry were measured as proportions of CD8+ or CD4 + CD25 + FoxP3+ cells within CD45+ leukocytes respectively. Median numbers were used for all the cutoff values.
3.4. Prognostic value of TILs by flow‐cytometry
Flow‐cytometry on freshly isolated TILs, representing the intra‐tumoral compartment, was used to validate the immunohistochemical findings. Median values were used for cutoffs. While CD8+ TILs were not predictive of colorectal cancer survival, high percentages of Tregs within CD45+ leukocytes were associated with worse colorectal cancer survival (HR 2.61, 95%CI 1.17‐5.83, P = 0.016). In addition, a high CD8+/Treg TIL ratio (median cutoff of 7) was associated with improved colorectal‐cancer survival (HR 0.45, 95%CI 0.20‐0.99, P = 0.044). Figure 3 shows the representative Kaplan‐Meier curves. TIL measurement by flow‐cytometry was not predictive of recurrence.
3.5. Multivariate analysis
Multivariate analysis included all known clinicopathologic characteristics and TIL ratios predictive of survival. Both the intra‐tumoral CD8+/FoxP3+ TIL ratio obtained by immunohistochemistry (Table 3) and the CD8+/Treg TIL ratio obtained by flow‐cytometry (Table 4) were independent predictors of colorectal cancer survival. From the clinicopathologic characteristics only lymph node status of the primary tumor and pre‐operative CEA values were independent predictors of survival (Tables 3 and 4).
Table 3.
Multivariate Cox proportional Hazard regression analysis of intratumoral CD8+/FoxP3+ TIL ratio obtained by immunohistochemistry adjusted for clinicopathologic characteristics
| Variables | HR | 95%CI | P‐value |
|---|---|---|---|
| Age (per decade increase) | 1.33 | 0.81‐2.18 | 0.264 |
| Gender | 0.81 | 0.28‐2.40 | 0.708 |
| Primary cancer lymph node status | 4.80 | 1.48‐15.6 | 0.009 |
| Time to CRCLM <12 months | 0.58 | 0.21‐1.58 | 0.285 |
| Largest tumor size >5 cm | 0.40 | 0.97‐1.64 | 0.201 |
| >1 metastatic lesion | 1.15 | 0.39‐3.36 | 0.798 |
| CEA >200 ng/mL | 10.1 | 0.99‐120 | 0.051 |
| Margin status (R0 vs R1) | 0.82 | 0.20‐3.41 | 0.786 |
| Intra‐tumoral CD8+/FoxP3+ TIL ratio | 0.27 | 0.09‐0.81 | 0.020 |
For the TIL ratios median values were used as cutoffs.
Bold values signify statistically significant parameters.
Table 4.
Multivariate Cox proportional Hazard regression analysis of CD8+/Treg TIL ratio obtained by flow cytometry adjusted for clinicopathologic characteristics
| Variables | HR | 95%CI lower limit/upper limit | P‐value | |
|---|---|---|---|---|
| Age (per decade increase) | 1.64 | 0.96‐2.83 | 0.073 | |
| Gender | 0.44 | 0.14‐1.42 | 0.169 | |
| Primary cancer lymph node status | 8.09 | 2.01‐32.6 | 0.003 | |
| Time to CRCLM <12 months | 0.77 | 0.28‐2.13 | 0.615 | |
| Largest tumor size >5 cm | 0.41 | 0.11‐1.44 | 0.162 | |
| >1 metastatic lesion | 0.58 | 0.19‐1.83 | 0.353 | |
| CEA >200 ng/mL | 45.1 | 3.88‐525 | 0.002 | |
| Margin status (R0 vs R1) | 1.14 | 0.34‐5.96 | 0.637 | |
| CD8+/Treg TIL ratio | 0.28 | 0.10‐0.84 | 0.022 | |
For the TIL ratios median values were used as cutoffs.
Bold values signify statistically significant parameters.
3.6. Sensitivity analysis
Excluding the three patients who underwent a second curative intent metastatectomy, as well as excluding the two patients with a pre‐operative CEA value at or above 200 ng/mL, led to no significant differences in the multivariate analysis. The intratumoral CD8+/Treg TIL ratio remained an independent predictor of colorectal cancer survival. We also repeated the multivariate analysis using backward variable selection. We found that the intra‐tumoral CD8+/FoxP3+ TIL ratio, obtained by immunohistochemistry, remained an independent predictor colorectal cancer survival (HR 0.40, 95%CI 0.17‐0.95, P = 0.037), while the CD8+/Treg TIL ratio obtained by flow‐cytometry showed a trend towards such independence (HR 0.46, 95%CI 0.19‐1.12, P = 0.087). Finally, we analyzed for any possible effect that chemotherapy given prior to metastatectomy, may have had on TIL populations. In Supplementary Figure S2 we show that prior chemotherapy, given at least 3 months prior to metastatectomy (range 3‐36 months) had no effect on TIL populations measured either by immunohistochemistry (a‐d) or by flow cytometry (e‐f).
4. DISCUSSION
We show that the intra‐tumoral ratio, but not the peri‐tumoral ratio, of effector T‐cells (CD8+ cells) to immune inhibitory T‐cells (FoxP3+ T‐cells), measured by immunohistochemistry, is a predictor of cancer survival in the setting of resected CRCLM. In contrast, intra‐tumoral CD8+ T‐cells or FoxP3+ T‐cells, individually, could not predict survival. In addition, we show that measuring the same ratio of effector T‐cells (CD8+ cells) to immune inhibitory T‐cells (Tregs) by flow‐cytometry, using freshly isolated TILs, can also predict cancer survival following CRCLM resection.
This observation is consistent with the hypothesis that the quality matters more than the quantity of the immune infiltrate.22 Specifically, ratios of effector to regulatory immune cells may provide a more comprehensive view of what occurs in the tumor microenvironment. In fact, a large meta‐analysis of TIL phenotyping, including 33 studies and nearly 10 000 patients, showed that lymphocyte ratios and specifically the CD8/FoxP3 ratio, have more prognostic potential than individual lymphocytic subtype densities.23 In addition, while a lymphocytic infiltrate may be attracted to the margin of the tumor it does not mean that it will lead to tumor disruption. CRCLM may prevent the migration of TILs into the tumor itself, which may be due to chemokine to chemokine receptor mismatch, aberrant microvasculature, cytokine production, a mechanical barrier, or immunosuppression itself.24
Four prior studies have attempted to examine the prognostic role of TILs in CRCLM. Halama et al16 examined TIL infiltration on full slides in a 500 μm area from the tumor edge. The area was termed the “invasive margin”, which may be similar to what we defined as peri‐tumoral area in our study. In 33 resected patients (68 additional patients had unresectable disease) Halama et al16 found that high “TIL density” was associated with improved survival. Differences with our study are that Halama et al16 studied only the area of the peri‐tumoral infiltrate (the invasive margin) and “TIL density” was defined as a combination of CD3, CD8, and granzyme B staining.
A study by Katz et al15 used three 0.6 mm TMA cores per patient, taken from 188 patients with CRCLM. They showed that a high CD8/FoxP3 ratio (or a low FoxP3/CD8 ratio as defined in their study) predicts improved survival following CRCLM resection, a finding that is in agreement with our immunohistochemical findings. The fact that they used only three small TMA cores means they examined a much smaller area of tumor than in our study but reached a similar conclusion nonetheless. The TMA cores from the Katz et al15 study likely correspond to the intra‐tumoral areas in our study, which may explaining the similarity in our results. Katz et al15 however, did not examine the peri‐tumoral area, given the general difficulty of TMA cores to reliably capture the histologic complexity of that narrow area.
A study by Lee et al17 examined TMAs consisting of 5 mm cores taken from 79 patients with synchronous only CRCLM. TILs in the liver metastasis were compared to TILs in the corresponding primary tumors. While in univariate analysis a higher FoxP3+ density at the metastatic site corresponded to better outcome, in multivariate analysis only CD45RO+ cell density at the primary site was prognostic of survival. Our study did not examine the relative role of TILs in the corresponding primary sites thus is difficult to compare our findings to the study by Lee et al17 More importantly however, it is unclear where the TMA cores were taken from and no CD8/FoxP3 ratio was reported.
Finally, a more recent study by Nakagawa et al14 examined full slides from 162 patients with CRCLM. Both intra‐tumoral and peri‐tumoral areas were examined according to the authors. High peri‐tumoral FoxP3 density was found to be associated with improved survival, while peri‐tumoral CD8 and intra‐tumoral CD8 and FoxP3 densities did not predict survival individually. Ratios of CD8 to FoxP3 densities were not examined. In addition, no definition of what constituted peri‐tumoral or intra‐tumoral areas was given.
It is clear from the above studies that significant heterogeneity in study design and terminology exists. In fact, differences in methodology, rather than differences in biology, have been hypothesized before to account in differences amongst study observations.23 In the case of CRCLM, only two prior studies14, 16 have used full slides, allowing for comparison of intra‐tumoral and peri‐tumoral TIL populations and none of these studies commented on the possible significance of the CD8/FoxP3 ratio, which we show to be the strongest prognostic marker. On the other hand, the study by Katz et al15 which found the CD8/FoxP3 ratio to be prognostic of survival, concordant to our immunohistochemical findings, did not examine the peri‐tumoral infiltrate.15 While we validate the findings of Katz et al15 we show, in addition, that it is indeed the intra‐tumoral infiltrate that matters the most.
A novelty of our study is the validation of our immunohistochemical observations by flow‐cytometry on prospectively collected TILs. There are however several differences in determining TIL densities by immunohistochemistry versus flow‐cytometry. First, immunohistochemistry measures absolute numbers of cells over a specific area of tissue, while flow‐cytometry measures proportions of cells within the total isolated cells. Second, flow‐cytometry can define cell subpopulations to a more detailed extent. While the use of FoxP3 to represent Tregs in immunohistochemistry is logical and justified,25 this strategy has its limitations. For example, FoxP3 can in humans, in contrast to mice, also be expressed by activated helper T‐cells.26, 27 In addition, activation‐induced FoxP3 in human T‐effector cells does not suppress proliferation or cytokine production.27 Finally, since flow cytometry uses macroscopically resected material, it is virtually impossible to exclude the possibility that some of the peri‐tumoral region is present with the tumor sample in some of the cases. On the other hand the distinction of intra‐tumoral and peri‐tumoral compartments can be accurately made with immunohistochemistry.
No association of immune infiltrate with cancer recurrence was found. However, overall survival likely reflects the biologic behavior of colorectal cancer much better than recurrence. While recurrence is undoubtedly a surrogate of cancer survival, many patients with recurrence still enjoy long term survival, or cure, due to additional interventions. A recurrence may not represent aggressive biologic behavior, but rather metastatic lesions too small to be clinically detected at the time of initial metastatectomy.
While our study has several strengths it also has limitations. The main limitation relates to the sample size of our study, stemming from the need for both prospectively collected flow‐cytometric data and retrospectively collected immunohistochemistry data, in the same patients. However, despite our sample size, which is comparable to other similar studies using full slides, and we were able to statistically confirm our a priori generated hypothesis.
5. CONCLUSIONS
The ratio of cytotoxic (CD8+) to regulatory (FoxP3+) T‐cells, in the intra‐tumoral compartment, but not in the peri‐tumoral compartment, can predict survival after resection of CRCLM.
SYNOPSIS
Tumor infiltrating lymphocytes (TILs) have the potential to prognosticate patients with colorectal cancer liver metastasis (CRCLM). We evaluated the spatial distribution of TILs in full slide cuts of patients with CRCLM. We show that both the quality of the infiltrate (CD8/FoxP3 ratio), as well as the location of the infiltrate (intra‐tumoral but not peri‐tumoral), should be taken into consideration when characterizing TILs in this clinical scenario.
Supporting information
Additional supporting information may be found in the online version of this article at the publisher's web‐site
Figure S1. Flow cytometric analysis of intra‐tumoral lymphocytes from patients with colorectal cancerliver metastasis. A, Viable (aqua dye‐negative) leukocytes were gated based on CD45 expression. B, T cells were defined based on the expression of CD3. C, CD3+ T cells were further analyzed for CD4 and CD8. D, Percentages of Treg cells were then defined as CD4+ CD25+ FoxP3+.
Figure S2. Box‐plots of TIL populations in relation to wheather patients received (n = 17) or did not receive (n = 30) prior systemic chemotherapy. Note that no patient received chemotherapy in the 3 month period prior to tumor resection. Also, note that the x‐axis range differs based on the population. A, CD8 intra‐tumoral TIL population by IHC, (B) CD8 peri‐tumoral TIL population by IHC, (C) FoxP3 intra‐tumoral TIL population by IHC, (D) FoxP3 peri‐tumoral TIL population by IHC, (E) CD8 TIL population by flow cytometry, (F) CD4/CD25/FoxP3 TIL population by flow cytometry.
Sideras K, Galjart B, Vasaturo A, et al. Prognostic value of intra‐tumoral CD8+/FoxP3+ lymphocyte ratio in patients with resected colorectal cancer liver metastasis. J Surg Oncol. 2018;118:68–76. 10.1002/jso.25091
Current address of Alexander Pedroza‐Gonzalez is Laboratory of Immunology Research, Medicine, Faculty of Higher Studies Iztacala, National Autonomous University of Mexico, FES‐Iztacala, UNAM, Mexico City, Mexico.
Current address of Angela Vasaturo is Integrative Cancer Immunology (Equipe 15), Cordeliers Research Center, Paris, France.
REFERENCES
- 1. Jemal A, Bray F, Center MM, et al. Global cancer statistics. CA Cancer J Clin. 2011; 61:69–90. [DOI] [PubMed] [Google Scholar]
- 2. Kopetz S, Chang GJ, Overman MJ, et al. Improved survival in metastatic colorectal cancer is associated with adoption of hepatic resection and improved chemotherapy. J Clin Oncol. 2009; 27:3677–3683. [DOI] [PMC free article] [PubMed] [Google Scholar]
- 3. Fong Y, Fortner J, Sun RL, et al. Clinical score for predicting recurrence after hepatic resection for metastatic colorectal cancer: analysis of 1001 consecutive cases. Ann Surg. 1999; 230:309–318. discussion 318‐321. [DOI] [PMC free article] [PubMed] [Google Scholar]
- 4. Rees M, Tekkis PP, Welsh FK, et al. Evaluation of long‐term survival after hepatic resection for metastatic colorectal cancer: a multifactorial model of 929 patients. Ann Surg. 2008; 247:125–135. [DOI] [PubMed] [Google Scholar]
- 5. Zou W. Immunosuppressive networks in the tumour environment and their therapeutic relevance. Nat Rev Cancer. 2005; 5:263–274. [DOI] [PubMed] [Google Scholar]
- 6. Pages F, Galon J, Dieu‐Nosjean MC, et al. Immune infiltration in human tumors: a prognostic factor that should not be ignored. Oncogene. 2010; 29:1093–1102. [DOI] [PubMed] [Google Scholar]
- 7. Galon J, Costes A, Sanchez‐Cabo F, et al. Type, density, and location of immune cells within human colorectal tumors predict clinical outcome. Science. 2006; 313:1960–1964. [DOI] [PubMed] [Google Scholar]
- 8. Pages F, Kirilovsky A, Mlecnik B, et al. In situ cytotoxic and memory T cells predict outcome in patients with early‐stage colorectal cancer. J Clin Oncol. 2009; 27:5944–5951. [DOI] [PubMed] [Google Scholar]
- 9. Mei Z, Liu Y, Liu C, et al. Tumour‐infiltrating inflammation and prognosis in colorectal cancer: systematic review and meta‐analysis. Br J Cancer. 2014; 110:1595–1605. [DOI] [PMC free article] [PubMed] [Google Scholar]
- 10. Richards CH, Roxburgh CS, Powell AG, et al. The clinical utility of the local inflammatory response in colorectal cancer. Eur J Cancer. 2014; 50:309–319. [DOI] [PubMed] [Google Scholar]
- 11. Vayrynen JP, Tuomisto A, Klintrup K, et al. Detailed analysis of inflammatory cell infiltration in colorectal cancer. Br J Cancer. 2013; 109:1839–1847. [DOI] [PMC free article] [PubMed] [Google Scholar]
- 12. Kito A, Tanaka K, Fujimaki H, et al. Tumor doubling time and local immune response to hepatic metastases from colorectal cancer. J Surg Oncol. 2007; 96:525–533. [DOI] [PubMed] [Google Scholar]
- 13. Wagner P, Koch M, Nummer D, et al. Detection and functional analysis of tumor infiltrating T‐lymphocytes (TIL) in liver metastases from colorectal cancer. Ann Surg Oncol. 2008; 15:2310–2317. [DOI] [PubMed] [Google Scholar]
- 14. Nakagawa K, Tanaka K, Homma Y, et al. Low infiltration of peritumoral regulatory T cells predicts worse outcome following resection of colorectal liver metastases. Ann Surg Oncol. 2015; 22:180–186. [DOI] [PubMed] [Google Scholar]
- 15. Katz SC, Bamboat ZM, Maker AV, et al. Regulatory T cell infiltration predicts outcome following resection of colorectal cancer liver metastases. Ann Surg Oncol. 2013; 20:946–955. [DOI] [PMC free article] [PubMed] [Google Scholar]
- 16. Halama N, Michel S, Kloor M, et al. Localization and density of immune cells in the invasive margin of human colorectal cancer liver metastases are prognostic for response to chemotherapy. Cancer Res. 2011; 71:5670–5677. [DOI] [PubMed] [Google Scholar]
- 17. Lee WS, Kang M, Baek JH, et al. Clinical impact of tumor‐infiltrating lymphocytes for survival in curatively resected stage IV colon cancer with isolated liver or lung metastasis. Ann Surg Oncol. 2013; 20:697–702. [DOI] [PubMed] [Google Scholar]
- 18. Scurr M, Gallimore A, Godkin A. T cell subsets and colorectal cancer: discerning the good from the bad. Cell Immunol. 2012; 279:21–24. [DOI] [PubMed] [Google Scholar]
- 19. Shang B, Liu Y, Jiang SJ, Liu Y. Prognostic value of tumor‐infiltrating FoxP3+ regulatory T cells in cancers: a systematic review and meta‐analysis. Sci Rep. 2015; 5:15179. [DOI] [PMC free article] [PubMed] [Google Scholar]
- 20. Pedroza‐Gonzalez A, Verhoef C, Ijzermans JN, et al. Activated tumor‐infiltrating CD4+ regulatory T cells restrain antitumor immunity in patients with primary or metastatic liver cancer. Hepatology. 2013; 57:183–194. [DOI] [PubMed] [Google Scholar]
- 21. Pedroza‐Gonzalez A, Zhou G, Singh SP, et al. GITR engagement in combination with CTLA‐4 blockade completely abrogates immunosuppression mediated by human liver tumor‐derived regulatory T cells ex vivo. Oncoimmunology. 2015; 4:e1051297. [DOI] [PMC free article] [PubMed] [Google Scholar]
- 22. Fridman WH, Pages F, Sautes‐Fridman C, Galon J. The immune contexture in human tumours: impact on clinical outcome. Nat Rev Cancer. 2012; 12:298–306. [DOI] [PubMed] [Google Scholar]
- 23. Gooden MJ, de Bock GH, Leffers N, et al. The prognostic influence of tumour‐infiltrating lymphocytes in cancer: a systematic review with meta‐analysis. Br J Cancer. 2011; 105:93–103. [DOI] [PMC free article] [PubMed] [Google Scholar]
- 24. Slaney CY, Kershaw MH, Darcy PK. Trafficking of T cells into tumors. Cancer Res. 2014; 74:7168–7174. [DOI] [PubMed] [Google Scholar]
- 25. Ladoire S, Martin F, Ghiringhelli F. Prognostic role of FOXP3+ regulatory T cells infiltrating human carcinomas: the paradox of colorectal cancer. Cancer Immunol Immunother. 2011; 60:909–918. [DOI] [PMC free article] [PubMed] [Google Scholar]
- 26. Wang J, Ioan‐Facsinay A, van der Voort, et al. Transient expression of FOXP3 in human activated nonregulatory CD4+ T cells. Eur J Immunol. 2007; 37:129–138. [DOI] [PubMed] [Google Scholar]
- 27. Allan SE, Crome SQ, Crellin NK, et al. Activation‐induced FOXP3 in human T effector cells does not suppress proliferation or cytokine production. Int Immunol. 2007; 19:345–354. [DOI] [PubMed] [Google Scholar]
Associated Data
This section collects any data citations, data availability statements, or supplementary materials included in this article.
Supplementary Materials
Additional supporting information may be found in the online version of this article at the publisher's web‐site
Figure S1. Flow cytometric analysis of intra‐tumoral lymphocytes from patients with colorectal cancerliver metastasis. A, Viable (aqua dye‐negative) leukocytes were gated based on CD45 expression. B, T cells were defined based on the expression of CD3. C, CD3+ T cells were further analyzed for CD4 and CD8. D, Percentages of Treg cells were then defined as CD4+ CD25+ FoxP3+.
Figure S2. Box‐plots of TIL populations in relation to wheather patients received (n = 17) or did not receive (n = 30) prior systemic chemotherapy. Note that no patient received chemotherapy in the 3 month period prior to tumor resection. Also, note that the x‐axis range differs based on the population. A, CD8 intra‐tumoral TIL population by IHC, (B) CD8 peri‐tumoral TIL population by IHC, (C) FoxP3 intra‐tumoral TIL population by IHC, (D) FoxP3 peri‐tumoral TIL population by IHC, (E) CD8 TIL population by flow cytometry, (F) CD4/CD25/FoxP3 TIL population by flow cytometry.