Abstract
It was established through in vivo T1 measurements at low magnetic fields that tumour cells display proton T1 values that are markedly longer than those shown by healthy tissue. Moreover, it has been found that the elongation of T1 parallels the aggressiveness of the investigated tumour. The T1 lengthening is associated with an enhanced water exchange rate across the transcytolemmal membrane through an overexpression/upregulation of GLUT1 and Na+/K+ ATPase transporters. It follows that the intracellular water lifetime represents a hallmark of tumour cells that can be easily monitored by measuring T1 at different magnetic field strengths ranging from 0.2 to 200 mT.
Keywords: intracellular water lifetime, magnetic resonance imaging, relaxometry, tumor detection
Magnetic resonance imaging (MRI) has played a key role in the field of oncology over the last few decades. The prominent role of MRI relies on its superb spatial and temporal resolution, and its diagnostic power basically arises from the differences in the longitudinal (T 1) and transverse (T 2) proton relaxation times between healthy and pathological tissues. However, at the magnetic field strength of the currently available MRI scanners, changes in T 1 do not appear to be sensitive enough to report on the particular aspects of the tumour stage.1 However, there is widespread opinion that at low magnetic field strength, the marked increase in R 1 (=1/T 1) observed in biological tissues might be beneficial towards improving the MRI diagnostic potential in tumour phenotyping.2
Herein, it is shown that the in vivo acquisition of 1/T 1 nuclear magnetic resonance dispersion (NMRD) profiles (from 0.2 to 200 mT) fully supports this expectation as the observed R 1 values at low magnetic fields (<0.2 T) enable the clear discrimination between tumours characterised by different metastatic potentials.
The 1/T 1 NMRD profiles were acquired on fast field cycling (FFC) relaxometers, which are able to switch the magnetic field between different field strengths during the measurement procedure.3 A field cycle overcomes the problem of the low sensitivity at low fields and allows for the rapid acquisition of an NMRD profile (Figure 1 A). The most diffuse FFC relaxometers are designed for measurements of liquid or solid small samples (<1 cm3). To perform this study, prototype FFC‐NMR equipment was developed by STELAR (Mede, PV, Italy) for the acquisition of in vivo NMRD profiles on animal models. To host a mouse (ca. 20 g), a 0.5 T wide bore FFC magnet was used with the implementation of a dedicated 11 mm transmitter/receiver solenoid detection coil placed around the mouse's leg (Figure 1 B) where the tumour graft was located.
Figure 1.
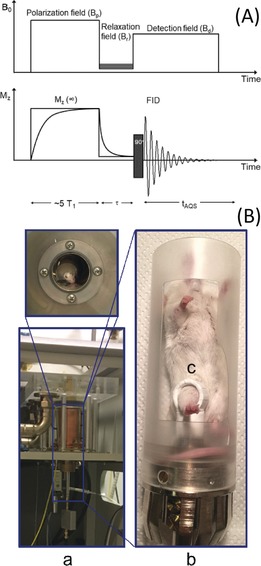
A) The FFC experiment: The nuclear spin polarization is built up during the pre‐polarization phase, at Bp. Relaxation occurs during the evolution period (τ) at Br, then the NMR signal is detected at Bd. The sequence is repeated, staggering τ each time. For Br>7 MHz, the cycle starts in the absence of any polarization field. B) Photographs of the FFC‐NMR relaxometer showing the introduced modifications for the in vivo acquisition: a) the FFC magnet; b) the mouse holding system; c) the transmitter/receiver coil around the mouse's leg.
In this study, mouse mammary adenocarcinoma cells, namely TS/A, 4T1, and 168FARN, were injected into the muscle of the hind limb to obtain tumour xenografts suitable for in vivo studies. The three cell lines were selected because they display different aggressiveness and metastatic potential (i.e., 168FARN<TS/A<4T1).4 When the tumour mass covers 65–85 % of the leg, the T 2‐weighted images were acquired by MRI (1 T; Figure 2 A). The NMRD data points were obtained by using the procedure depicted in Figure 1 A (16 τ values).
Figure 2.
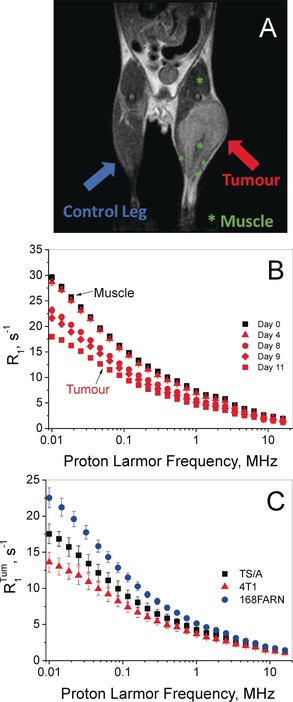
A) T 2‐weighted MRI of the tumour‐bearing mouse (4T1 graft). B) 1/T 1 NMRD profile of a mouse leg tissue before (day 0) and after the intramuscular injection of one million 4T1 cells. C) NMRD profiles of the tumour tissues grown on hind limbs: 4T1 (▴), TS/A (▪), and 168FARN (•) acquired 11±2, 13±3, and 25±1 days after intramuscular injection, respectively. R 1 tum is the averaged relaxation rate normalized to the tumour mass fraction compared to the whole hind limb. Error bars report the standard deviation (SD).
The fitting of the magnetization decay curves (Mz) for the determination of T 1 was carried out by means of the monoexponential Bloch equation, despite the fact that the Mz decay may display biexponential characteristics (see below). A simple inspection of the obtained profiles allowed us to clearly distinguish healthy from tumour tissue (Figure 2 B) as the tumour invariantly showed lower R 1 values. Furthermore, the large differences observed in the R 1 data at low fields provided insight into particular characteristics of the considered tumour grafts. The elongation of T 1 followed the tumour size in different ways for the three models, essentially reflecting the differences in their aggressiveness (Figure 2 C). The observed behaviour clearly showed that the differences in T 1 between the healthy and tumour tissue were significantly larger at low magnetic field strengths. The absence of extended necrotic/cystic areas was assessed by T 2‐weighted image analysis (see the Supporting Information, Figure S1). As the averaged signal intensities measured on the three tumour models were not significantly different, it was possible to exclude that T 1 elongation was mainly caused by the presence of microscopic necrotic areas.
To gain more insight into the factors determining the observed behaviour, one needs to remember that each R 1 data point represents an average of the water R 1 in different tissue microenvironments, basically 1) the extracellular (EX) space with an averaged R 1ex value and 2) the intracellular (IN) compartment with a more restricted water mobility, with a relaxation of R 1in, with V ex and V in being the respective volume fractions. The intravascular volume may be neglected as it represents a tiny percentage of the total value.5 Water can cross the barriers between the two compartments, thus contributing to mixing, to some extent, towards the R 1s of the IN and EX compartments. Therefore, τ in and τ ex (the IN and EX water residence times, respectively) have to be introduced in the model (Figure 3). Such exchange rates are correlated, according to the mass balance, through the volume fractions of the two compartments:
| (1) |
Figure 3.
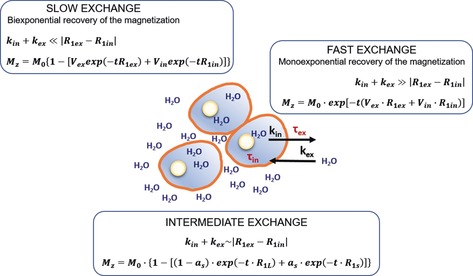
The water exchange regime and the resulting MZ value in a schematic representation of the relationship between the compartmentalized system formed by the IN and the EX space. In the case of intermediate exchange, aS and R 1S are the fraction and the rate constant for the apparent component with the shorter T 1 (R 1S=1/T 1S); (1−a S)=a L and R 1L are the fraction and rate constant for the apparent component with the longer T 1 (R 1L=1/T 1L), and t is the running time for recovery by relaxation.
According to this bicompartmental model, the evolution time of MZ is dependent on the relationship between the absolute values of the “relaxation” term, |R 1in−R 1ex|, and an “exchange” term |k in+k ex| (where k in=1/τ in and k ex=1/τ ex) in a relationship that has been previously defined as the NMR “shutter speed”.6
On the basis of this model (Figure 3), a monoexponential time course of MZ is expected only in a fast‐exchange regime, that is, when the condition |k in+k ex|≫|R 1in−R 1ex| is met. In this case, analysis of the saturation recovery (SR) data provides a single R 1 value, which corresponds to the average between R 1in and R 1ex weighted by the volume fractions of the two sites. Conversely, when there is no exchange between the two compartments, the recovery of MZ will be biexponential, thus enabling the accurate determination of both R 1in and R 1ex values through a simple biexponential analysis of the SR data. In between, there is the intermediate‐exchange region in which the time evolution of MZ can still be biexponential, but the R 1s obtained from the fitting of the SR data can be “contaminated” by the exchange occurring between the two compartments.
The greater the exchange rate between the two compartments, the larger the T 1 contamination arising by the EX compartment (endowed with a lower volume fraction). To estimate the different parameters, the MZ recovery was then re‐acquired over an extended number of τ intervals (n=48), to improve the sampling of both fast and slow T 1 components. Moreover, an experimental approach to assess R 1ex values was pursued by measuring the 1/T 1 profile of Matrigel (Figure 4).
Figure 4.
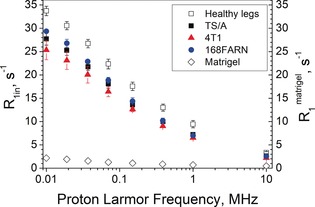
R 1in of mouse leg tissue: healthy legs and tumour‐bearing legs. Values were obtained from the NMRD data by fitting to the 2SX model. For comparison, the R 1 values measured for Matrigel are reported (◊). Error bars indicate SDs from at least five independent experiments.
Matrigel is a gelatinous protein mixture secreted by Engelbreth–Holm–Swarm mouse sarcoma cells. It is a model of the EX environment found in many tissues and used as a substrate for cell culturing.7 The similarity of the NMRD profiles acquired on matrigel incubated for 72 h (Figure S2) in the absence or in the presence of 4T1, TS/A, and 168FARN cells supports the view that the presence of factors secreted by cells (e.g., proteins, enzymes, metabolites) does not affect the observed water proton R 1s. This finding made us confident of the use of the Matrigel model to mimic the EX matrix compartment. By introducing the T 1 values obtained for the Matrigel solution as the “long” T 1 component, a good fit of the Mz recovery curves was obtained using the mode equation for two‐site exchange (2SX model; see Section V in the Supporting Information). The V ex was allowed to vary within a feasible range, in accordance with results already reported in the literature (0.09–0.19 for a healthy mouse hind limb, 0.15–0.5 for a tumourous mouse hind limb).6b, 8 The values of τ in and V ex given by the fitting are listed in Table 1.
Table 1.
List of parameters derived by fitting the Mz recovery data.
| In vivo experiment (NMRD profile)[a] |
In vitro experiment (cell pellet)[b] |
||
|---|---|---|---|
| V ex | τ in [s] | τ in [s] | |
| muscle leg | 0.14±0.02 | 1.24±0.25 | – |
| 4T1 | 0.22±0.08 | 0.68±0.20 | 0.023±0.009 |
| TS/A | 0.20±0.02 | 0.99±0.19 | 0.039±0.012 |
| 168FARN | 0.15±0.01 | 1.12±0.32 | 0.111±0.014 |
[a] Data acquired on healthy and tumour‐bearing mouse legs between 0.01 and 10 MHz (number of B r: 8) were simultaneously fitted; the mean±SD is calculated from at least five independent experiments. [b] Data acquired on cells in the presence of Gd‐HPDO3A; the mean±SD is calculated from at least 4 independent experiments.
The most striking result from the fitting procedure is that the decrease in τ in to indicate that the water exchange rate across the plasmalemmal membrane is a distinctive hallmark that differentiates between muscle (representative of healthy cells) and tumour cells. This finding clearly reports on the peculiar characteristics of the given tumour cell type. In fact, the IN water lifetime τ in values reported in Table 1 for three breast cancer cell lines are inversely proportional to their metastatic potential. 4T1 cells are highly metastatic and form metastases in many organs (lungs, lymph nodes, brain, bone),4a TS/A cells display limited metastatic activity in the lungs,4a, 9 and 168FARN cells only produce local micro‐metastases.9
Support for this conclusion was gained by measuring τ in values of the different cell lines in vitro, following a well‐established relaxometric procedure.10 For this purpose, measurements were carried out at 0.5 T in the presence of increasing amounts of the paramagnetic Gd‐HPDO3A complex in the EX space of cell suspensions. Then, the inversion recovery data were analysed according to the 2SX model.6b The obtained τ in values are reported in Table 1. Although the drastically different experimental conditions caused a large decrease for the τ in values obtained in vitro, they maintained analogous differences among the cell lines as observed in vivo, suggesting common determinants for τ in/τ ex.
Finally, it is worth noting that the IN relaxation times (R 1in) appear rather insensitive to the cell type characteristics (Figure 4). These results confirm that the R 1 values of IN water are markedly higher than those of EX water. IN water is embedded in an organized and immobilized protein network (cytoskeleton) that can be considered as a dynamic gel, and is more ordered than EX water.11 Figure 4 clearly indicates that IN water is the principal component of the typical 1/T 1 NMRD tissue profile whereas EX water has a higher mobility and a lower R 1. The latter result, well understandable for vascular water, may appear a bit odd for the EX matrix, which contains a high protein concentration. However, the experimental finding of low Matrigel R 1 values confirms the hypothesis that this low value is most likely due to the higher water mobility of these proteins.
It follows that the main determinant of the elongation of T 1 in tumour cells is τ in, which decreases as the aggressiveness increases.
Examples of 1/T 1 NMRD profiles acquired on fresh or thawed surgical specimens have been reported previously.12 However, the use of ex vivo samples has the flaw that it cannot take into account the dynamics of water mobility, which is a key term determining the NMRD profile.
Why do tumour cells display a shorter τ in value than healthy cells? The answer may rely on the increased glycolytic activity of tumour cells, which leads to an increased production of metabolites with a consequent increase in the IN osmotic pressure. The tumour cells cope with this issue by increasing the exchange rate of water with the external compartment. Therefore, to gain further support for our views, the expression of glucose transporter GLUT‐1 and Na+/K+ ATPase was evaluated by immunofluorescence (Figure 5).
Figure 5.
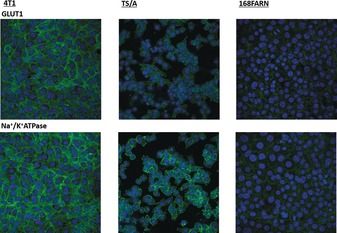
Immunofluorescence confocal images (63X). Cells were stained for GLUT‐1 (upper panels) and Na+/K+ ATPase (bottom). Nuclei were counterstained with DAPI (blue).
To unambiguously demonstrate that the expression of these transporters is directly correlated with the decrease in τ in observed for the three cell lines (4T1<TS/A<168FARN), the effect of the inhibition of GLUT‐1 and Na+/K+ ATPase was assessed. Cells were incubated for 24 h in the presence of 5 μm of WZB117,13 the GLUT‐1 inhibitor, or 100 μm of Ouabain,14 the Na+/K+ ATPase inhibitor. Then, τ in was determined on the cell lines “in vitro” following the above described procedure. Cell vitality, determined by MTT assays, was >90 % also after WZB117 and Ouabain treatment (see Figures S9 and S10). The treated 4T1 and TS/A cells showed a marked increase in τ in (Figure 6), confirming the suggestion about the relevant role of the expression of this transporter in the modulation of transcytolemmal water exchange rates. As expected, the longer τ in of 168FARN is less dependent on both inhibitors.
Figure 6.
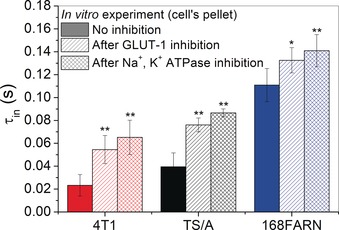
τ in values determined “in vitro” on cells with and without GLUT‐1 and Na+/K+ ATPase inhibition. Errors bars indicate SDs from at least four independent experiments. *P<0.05; **P<0.01; Student's t‐test.
The results reported herein show that 1/T 1 NMRD profiles measured in vivo on implanted mammary tumours clearly allow for the assessment of marked T 1 increases, with respect to healthy tissues, that occur at low magnetic fields (<0.2 T). This achievement may open new horizons for the non‐invasive evaluation of tumour metabolic phenotypes by providing useful and more detailed information related to the metastatic propensity of the tumour without requiring the administration of exogenous contrast agents. This finding outlines the dependence of the observed T 1 on the transcytolemmal water exchange rate when the two involved compartments have a sufficiently different R 1, as observed at low magnetic fields (<0.2 T). The simultaneous fitting of the Mz over an extended range of magnetic field strengths allows for a good estimation of τ in. Water transport across the plasma membrane is crucial to cell function. Cell water content and cell volume are related to the concentration of IN osmotically active compounds as well as to the EX tonicity. Cations, anions, and other metabolites are transported across the cell membrane by active transporters whose up/downregulation occurring in the presence of a pathological state can act as a specific reporter of the cellular state. τ in reports on the activities of a number of transporters, and collectively, it may represent a hallmark of tumour‐cell aggressiveness. The τ in is the result of contributions from a number of sources, including overexpression/upregulation of transporters such as GLUT‐1 and Na+/K+ ATPase. We may conclude that the measurement of transmembrane permeability provides insight for more specific assessments of the pathophysiological status of tumours. Even though FFC‐NMR instrumentation is not endowed with spatial resolution, the fundamental knowledge obtained in this study can enable new diagnostic opportunities in oncology that were previously unrecognized and are potentially transferable to the two prototype human‐whole‐body‐sized FFC‐MRI scanners recently built at Aberdeen University by Lurie and co‐workers. Pilot studies performed on these FFC‐MRI scanners have already demonstrated the potential use of FFC‐MRI in a range of several pathologies such us musculoskeletal and cardiovascular diseases.15
Conflict of interest
The authors declare no conflict of interest.
Supporting information
As a service to our authors and readers, this journal provides supporting information supplied by the authors. Such materials are peer reviewed and may be re‐organized for online delivery, but are not copy‐edited or typeset. Technical support issues arising from supporting information (other than missing files) should be addressed to the authors.
Supplementary
Acknowledgements
This project has received funding from the European Union's Horizon 2020 research and innovation programme under grant agreement No 668119 (project “IDentIFY”), and it was performed in the framework of the Consorzio CIRCMSB and of COST Action AC15209 (EURELAX).
M. R. Ruggiero, S. Baroni, S. Pezzana, G. Ferrante, S. Geninatti Crich, S. Aime, Angew. Chem. Int. Ed. 2018, 57, 7468.
References
- 1. Johnson L. M., Turkbey B., Figg W. D., Choyke P. L., Nat. Rev. Clin. Oncol. 2014, 11, 346–53. [DOI] [PMC free article] [PubMed] [Google Scholar]
- 2.
- 2a. Pine K. J., Davies G. R., Lurie D. J., J. Magn. Reson. Med. 2010, 63, 1698–1702; [DOI] [PubMed] [Google Scholar]
- 2b. Koenig S. H., R. D. Brown III , Adams D., Emerson D., Harrison C. G., Invest. Radiol. 1984, 19, 76–81; [DOI] [PubMed] [Google Scholar]
- 2c. Rössler E., Mattea C., Stapf S., J. Magn. Reson. 2015, 251, 43–51. [DOI] [PubMed] [Google Scholar]
- 3. Steele R. M., Korb J. P., Ferrante G., Bubici S., Magn. Reson. Chem. 2016, 54, 502–509. [DOI] [PubMed] [Google Scholar]
- 4.
- 4a. Aslakson C. J., Miller F. R., Cancer Res. 1992, 52, 1399–1405; [PubMed] [Google Scholar]
- 4b. Rozera C., Carlei D., Lollini P. L., De Giovanni C., Musiani P., Di Carlo E., Belardelli F., Ferrantini M., Am. J. Pathol. 1999, 154, 1211–1222; [DOI] [PMC free article] [PubMed] [Google Scholar]
- 4c. Simões R. V., Serganova I. S., Kruchevsky N., Leftin A., Shestov A. A., Thaler H. T., Sukenick G., Locasale J. W., Blasberg R. G., Koutcher J. A., Ackerstaff E., Neoplasia 2015, 17, 671–684. [DOI] [PMC free article] [PubMed] [Google Scholar]
- 5. Longo D. L., Dastrù W., Consolino L., Espak M., Arigoni M., Cavallo F., Magn. Reson. Imaging 2015, 33, 725–736. [DOI] [PubMed] [Google Scholar]
- 6.
- 6a. C. J. Springer, Jr. , Li X., Tudorica L. A., Oh K. Y., Roy N., Chui S. Y.-C., Naik A. M., Holtorf M. L., Afzal A., Rooney W. D., Huang W., NMR Biomed. 2014, 27, 760–773; [DOI] [PMC free article] [PubMed] [Google Scholar]
- 6b. Landis C. S., Lin X., Telaqng F. W., Molina P. E., Palyka I., Vetek G., C. S. Springer, Jr. , Magn. Reson. Med. 1999, 42, 467–478; [DOI] [PubMed] [Google Scholar]
- 6c. Hazlewood C. F., Chang D. C., Nichols B. L., Woessner D. E., Biophys. J. 1974, 14, 583–606. [DOI] [PMC free article] [PubMed] [Google Scholar]
- 7. Hughes C. S., Postovit L. M., Lajoie G. A., Proteomics 2010, 10, 1886–1890. [DOI] [PubMed] [Google Scholar]
- 8.
- 8a. Li X., Rooney W. D., C. S. Springer, Jr. , Proc. Natl. Acad. Sci. USA 2008, 105, 17937–17942; [DOI] [PMC free article] [PubMed] [Google Scholar]
- 8b. Barnes S. L., Sorace A. G., Loveless M. E., Whisenant J. G., Yankeelov T. E., NMR Biomed. 2015, 28, 1345–1356; [DOI] [PMC free article] [PubMed] [Google Scholar]
- 8c. Panagiotaki E., Walker-Samuel S., Siow B., Johnson S. P., Rajkumar V., Pedley R. B., Lythgoe M. F., Alexander D. C., Cancer Res. 2014, 74, 1902–1912. [DOI] [PubMed] [Google Scholar]
- 9. Nanni P., de Giovanni C., Lollini P. L., Nicoletti G., Prodi G., Clin. Exp. Metastasis 1983, 1, 373–380. [DOI] [PubMed] [Google Scholar]
- 10.
- 10a. Terreno E., Geninatti Crich S., Belfiore S., Biancone L., Cabella C., Esposito G., Manazza A. D., Aime S., Magn. Reson. Med. 2006, 55, 491–497; [DOI] [PubMed] [Google Scholar]
- 10b. Gianolio E., Ferrauto G., Di Gregorio E., Aime S., Biochim. Biophys. Acta Biomembr. 2016, 1858, 627–631; [DOI] [PubMed] [Google Scholar]
- 10c. Labadie C., Lee J. H., Vétek G., C. S. Springer, Jr. , Magn. Reson. B 1994, 105, 99–112. [DOI] [PubMed] [Google Scholar]
- 11.
- 11a. Shepherd V. A., Curr. Top. Dev. Biol. 2006, 75, 171–222; [DOI] [PubMed] [Google Scholar]
- 11b. Ball P., Proc. Natl. Acad. Sci. USA 2017, 114, 13327–13335; [DOI] [PMC free article] [PubMed] [Google Scholar]
- 11c. Ball P., Chem. Rev. 2008, 108, 74–108. [DOI] [PubMed] [Google Scholar]
- 12.
- 12a. Koenig S. H., Acad. Radiol. 1996, 3, 597–606; [DOI] [PubMed] [Google Scholar]
- 12b. Diakova G., Korb J. P., Bryant R. G., Magn. Reson. Med. 2012, 68, 272–277; [DOI] [PMC free article] [PubMed] [Google Scholar]
- 12c. Araya Y. T., Martínez-Santiesteban F., Handler W. B., Harris C. T., Chronik B. A., Scholl T. J., NMR Biomed. 2017, 30, 1–10. [DOI] [PubMed] [Google Scholar]
- 13. Liu Y., Cao Y., Zhang W., Bergmeier S., Qian Y., Akbar H., Colvin R., Ding J., Tong L., Wu S., Hines J., Chen X., Mol. Cancer Ther. 2012, 11, 1672–1782. [DOI] [PubMed] [Google Scholar]
- 14.
- 14a. Wasserstrom J. A., Aistrup G. L., Am. J. Physiol. Heart Circ. Physiol. 2005, 289, H1781–H1793; [DOI] [PubMed] [Google Scholar]
- 14b. Bai R., C. S. Springer, Jr. , Plenz D., Basser P. J., Magn. Reson. Med. 2017, DOI: 10.1002/mrm.26980. [DOI] [PMC free article] [PubMed] [Google Scholar]
- 15.
- 15a. Ross P. J., Broche L. M., Lurie D. J., Magn. Reson. Med. 2015, 73, 1120–1124; [DOI] [PubMed] [Google Scholar]
- 15b. Broche L. M., Ashcroft G. P., Lurie D. J., Magn. Reson. Med. 2012, 68, 358–362. [DOI] [PubMed] [Google Scholar]
Associated Data
This section collects any data citations, data availability statements, or supplementary materials included in this article.
Supplementary Materials
As a service to our authors and readers, this journal provides supporting information supplied by the authors. Such materials are peer reviewed and may be re‐organized for online delivery, but are not copy‐edited or typeset. Technical support issues arising from supporting information (other than missing files) should be addressed to the authors.
Supplementary


