

Summary
Coccolithophores are globally distributed unicellular marine algae that are characterized by their covering of calcite coccoliths. Calcification by coccolithophores contributes significantly to global biogeochemical cycles. However, the physiological requirement for calcification remains poorly understood as non‐calcifying strains of some commonly used model species, such as Emiliania huxleyi, grow normally in laboratory culture.
To determine whether the requirement for calcification differs between coccolithophore species, we utilized multiple independent methodologies to disrupt calcification in two important species of coccolithophore: E. huxleyi and Coccolithus braarudii. We investigated their physiological response and used time‐lapse imaging to visualize the processes of calcification and cell division in individual cells.
Disruption of calcification resulted in major growth defects in C. braarudii, but not in E. huxleyi. We found no evidence that calcification supports photosynthesis in C. braarudii, but showed that an inability to maintain an intact coccosphere results in cell cycle arrest.
We found that C. braarudii is very different from E. huxleyi as it exhibits an obligate requirement for calcification. The identification of a growth defect in C. braarudii resulting from disruption of the coccosphere may be important in considering their response to future changes in ocean carbonate chemistry.
Keywords: calcification, coccolithophore, Coccolithus braarudii, Emiliania huxleyi, phytoplankton
Short abstract
See also the Commentary on this article by https://doi.org/10.1111/nph.15409.
Introduction
Coccolithophores (Calcihaptophycidae) are globally abundant, single‐celled marine phytoplankton characterized by the production of elaborate calcite platelets (coccoliths). These are produced in an intracellular compartment (coccolith vesicle) and secreted to the cell surface, where they are arranged extracellularly to form a coccosphere (Brownlee & Taylor, 2003; Marsh, 2003; Taylor et al., 2017). As a result of their global prevalence and ability to form vast blooms (Westbroek et al., 1993), coccolithophores are estimated to be responsible for up to 10% of global carbon fixation (Poulton et al., 2007) and are major producers of oceanic biogenic calcium carbonate. Calcification by coccolithophores contributes to a rain of calcite from surface waters to depth, which can remineralize and contribute to a vertical alkalinity gradient in the water column (Milliman, 1993) or form vast sedimentary deposits on the ocean floor (Thierstein et al., 1977). In addition, sinking coccoliths ballast particulate organic matter, enabling the transfer of organic carbon to depth (Ziveri et al., 2007). Consequently, coccolithophores are crucial contributors to ocean biogeochemical cycles and much research has focused on how calcification may be impacted by future changes in ocean carbonate chemistry (Riebesell et al., 2000; Rost & Riebesell, 2004; Ridgwell et al., 2009; Meyer & Riebesell, 2015).
Given the biogeochemical importance of calcification, it is surprising that the ecological and physiological reasons underlying coccolith production remain uncertain (Tyrrell & Merico, 2004; Monteiro et al., 2016). Several species exhibit the ability to grow without coccoliths in laboratory culture, most notably Emiliania huxleyi and Chrysotila carterae (formerly Pleurochrysis carterae) (Paasche, 2001; Marsh, 2003). The diploid heterococcolith‐bearing life stages of these species are invariably fully calcified on initial isolation, although many strains that have been maintained in laboratory culture for several years are only partially calcified or have lost the ability to calcify entirely (Paasche, 2001; Marsh, 2003). Non‐calcifying strains of E. huxleyi are genetically diverse, suggesting that this characteristic is not restricted to a single lineage or morphotype (Kegel et al., 2013; Read et al., 2013). These observations suggest that calcification is not essential for the growth of coccolithophores, at least when they are maintained in laboratory culture. In turn, this finding has important implications for our understanding of coccolithophore ecology, especially when we consider the potential impact of future changes in ocean carbonate chemistry on the calcification process (Riebesell et al., 2000).
However, there is currently little experimental evidence examining the requirement for calcification in other coccolithophore species, and there is evidence suggesting that the commonly used laboratory models E. huxleyi and C. carterae may not be typical of all coccolithophores. For example, the large, heavily calcified species, such as Calcidiscus leptoporus and Coccolithus braarudii, which contribute significantly to calcification in our global oceans (Daniels et al., 2014), always appear to be fully calcified in exponentially growing diploid cultures. In addition, there are some indications of mechanistic differences in the process of calcification between coccolithophores. For example, several species, including C. braarudii, exhibit a requirement for silicon (Si) in the calcification process, whereas this requirement is entirely absent from other species, such as E. huxleyi (Durak et al., 2016). It is also likely that coccolith production fulfils multiple roles within coccolithophores, which may differ between species (Monteiro et al., 2016). In the light of these contrasts, it is essential to question whether these species exhibit an obligate dependence on calcification for cellular fitness that relates to important differences in either the process or the function of calcification between coccolithophore lineages.
The availability of non‐calcifying strains of E. huxleyi has been used to assess the potential role of calcification in this species. Surprisingly, the absence of calcification, in either non‐calcifying strains or by depletion of Ca2+ in calcifying strains, has little obvious impact on E. huxleyi physiology in laboratory cultures, with no reduction in growth rate or photosynthesis (Herfort et al., 2004; Trimborn et al., 2007; Leonardos et al., 2009). Although calcification in E. huxleyi commonly occurs at a similar rate to photosynthesis, current evidence does not support a role for calcification as a carbon‐concentrating mechanism in this species (Herfort et al., 2002; Trimborn et al., 2007; Leonardos et al., 2009; Bach et al., 2013). There is also no evidence to suggest that calcified E. huxleyi cells are better protected from zooplankton grazing (Harris, 1994) or viral infection (Wilson et al., 2002). Several studies have also indicated that the coccosphere does not contribute to the protection from photoinhibition (Nanninga & Tyrrell, 1996; Trimborn et al., 2007), although recent evidence indicates that the non‐calcifying strains may be more sensitive to UV radiation and grow less well under natural light (Xu et al., 2016). Given that there are few clear physiological differences between calcifying and non‐calcifying E. huxleyi strains, evidence in support of the many proposed roles of calcification remains limited.
The absence of non‐calcifying strains has precluded similar investigations into the requirement for calcification in most other coccolithophore species. However, it is possible to disrupt calcification in coccolithophores experimentally by using a range of different techniques. For example, E. huxleyi cells grown at 0.1 mM Ca2+ in artificial seawater media are non‐calcified, whereas cells grown at 1 mM Ca2+ produce incomplete coccoliths with extensive malformations (Herfort et al., 2002, 2004; Trimborn et al., 2007; Leonardos et al., 2009). At 1 mM Ca2+, E. huxleyi cells grow normally, although cells grown at extremely low Ca2+ (< 0.1 mM) exhibit minor growth defects (Trimborn et al., 2007; Mackinder et al., 2011). Chrysotila haptonemofera (formerly Pleurochrysis haptonemofera) exhibited reduced calcification at 5 mM Ca2+ and growth was negatively impacted at concentrations of 0.5 mM Ca2+ (Katagiri et al., 2010). As Ca2+ is essential for many cellular processes, most notably cell signalling, extreme Ca2+ depletion could potentially affect many wider aspects of cell physiology. An alternative mechanism to inhibit calcification is the application of bisphosphonates, such as 1‐hydroxyethane 1,1‐diphosphonic acid (HEDP), which inhibit calcification through their ability to chelate metal ions and prevent the growth of calcium carbonate crystals. HEDP has been used extensively in other calcified organisms (e.g. fresh water algae (Heath et al., 1995) and corals (Yamashiro, 1995)) and also inhibits calcification in the coccolithophores E. huxleyi (1 mM) (Sekino & Shiraiwa, 1994) and C. carterae (0.5 and 1 mM) (Asahina & Okazaki, 2004). In addition, we have recently identified that the Si analogue germanium (Ge) may be used to disrupt calcification in the coccolithophore species that exhibit a requirement for Si in coccolith production (Durak et al., 2016).
In this study, we have examined whether the ecologically important species C. braarudii exhibits an obligate dependence on calcification for growth. C. braarudii and the closely related species C. pelagicus are abundant in temperate and subarctic regions, respectively, of the Atlantic and Pacific oceans, and their large coccoliths contribute significantly to the sedimentary deposition of calcite from the photic zone (Ziveri et al., 2004; Daniels et al., 2016; Tsutsui et al., 2016). Although C. braarudii strains have been maintained in laboratory culture for many years, non‐calcifying diploid strains have not been identified. Previous experiments to manipulate calcification in coccolithophores have primarily utilized a single disruption technique, limiting the ability to identify non‐specific impacts of the treatment on other cellular functions. We have therefore employed multiple methodologies to disrupt calcification to ensure that our observations are primarily a result of a defect in coccolith production. We show that disruption of calcification using four different methods leads to inhibition of growth in C. braarudii. We do not find evidence for a link between calcification and photosynthetic function, but find that cell division is inhibited in cells that are unable to form a complete coccosphere.
Materials and Methods
Algal strains and culture conditions
Coccolithus braarudii (PLY182g) (formerly Coccolithus pelagicus ssp. braarudii) and E. huxleyi (CCMP1516) were grown in filtered seawater (FSW) with added f/2 nutrients (Guillard & Ryther, 1962) and added [dSi] 10 μM (unless specified). Cells were grown in triplicate batch cultures, incubated at 15°C and illuminated with 65–75 μmol photons m−2 s−1 in a 16 h : 8 h, light : dark cycle.
Cell growth and discarded coccoliths
Cells were counted using light microscopy and a Sedgewick–Rafter counting chamber. Growth rates (d−1) were determined from the initial and final cell densities (N t0, N t1) using the formula: SGR = [loge(N t1) − loge(N t0)]/t. Discarded coccoliths were also counted by light microscopy. We did not discriminate between regular and aberrant coccoliths for this count. Statistics were completed using sigmaplot v.13.0 software (Systat Software Inc., London, UK).
Disruption of calcification
Low Ca2+
To control the availability of Ca2+, Harrison's broad‐spectrum artificial seawater (ASW; Harrison et al., 1980) was used, with the addition of H2SeO (final concentration, 5 nM) and omission of CaCl2. The addition of H2SeO was made as it has been shown previously that E. huxleyi requires selenium for growth (Danbara & Shiraiwa, 1999). Before treatment, C. braarudii and E. huxleyi cells were acclimated at 10 mM Ca2+ ASW for several generations (> 2 wk) and then treated with a range of Ca2+ concentrations from 0 to 10 mM (specified).
HEDP
Cells were grown in f/2 FSW with the addition of HEDP (50 μM) (Sigma Aldrich, Poole, UK). Before the inoculation of cells, the pH of the f/2 plus HEDP medium was adjusted to pH 8.2 using 1 M NaOH and the medium was sterile filtered (0.22 μm) (PALL, Port Washington, NY, USA).
Ge/Si manipulation
Low‐Si seawater was collected in early summer (May 2015) from the western English Channel (station L4). This batch of seawater was used for all Ge addition experiments and [dSi] was determined to be 2.0 μM using a silicate–molybdate–ascorbate assay (Kirkwood, 1989). Coccolithus braarudii cultures were grown in a Ge/Si ratio of 0.2 to disrupt calcification. Ge was added in the form of GeO2 to a final concentration of 2 or 20 μM (specified). [dSi] was amended by the addition of Na2SiO3.5H2O to give a final [dSi] of 10 or 100 μM (specified). For growth experiments, coccolithophore cultures were acclimated to the appropriate [dSi] for several generations (> 2 wk) before the investigation.
Very low Si
As it is difficult to routinely obtain natural seawater with [dSi] < 1 μM, [dSi] was further depleted using growth of the diatom Thalassiosira weissflogii (PLY541), as described previously (Timmermans et al., 2007; Durak et al., 2016), termed diatom deplete seawater (DDSW). Diatoms were removed by sterile filtration and f/4 nutrients were added (without Si). [dSi] was below the level of detection (< 0.2 μM) in all DDSW media prepared by this method. Coccolithophore cultures were acclimated to DDSW for several generations (> 2 wk) before the investigation with amended [dSi] (addition of Na2SiO3·5H2O) to 20 μM. Before inoculation, C. braarudii cells were washed with < 0.2 μM [dSi] DDSW to avoid carry‐over of dSi. Cells were grown in semi‐continuous batch cultures, control and very low [dSi] (20 and < 0.2 μM, respectively) DDSW, subculturing every 9 d into fresh media to maintain cells in exponential growth.
Measurements of photosynthesis
Measurements of chlorophyll fluorescence were taken to assess the performance of the photosynthetic apparatus. The maximum quantum yield of photosystem II (F v/F m) was determined using a Z985 AquaPen chlorophyll fluorimeter (Qubit Systems, Kingston, ON, Canada). Cells were dark adapted for 20 min before measurements. Cell densities of > 10 000 cells ml−1 were required to produce consistent F v/F m measurements. O2 evolution measurements were performed using a Firesting O2 meter with an OXVIAL 4 respiration vial with integrated optical oxygen sensor (Pyro Science, Aachen, Germany). Cells were stirred constantly during measurements and kept at 20°C using a water‐cooled glass jacket. As high cell densities are required for robust O2 evolution measurements in C. braarudii (> 35 000 cells ml−1), cells for analysis were grown to late exponential phase in ASW at 10 mM Ca2+, washed and incubated in different Ca2+ concentrations (0, 1 and 10 mM) for 24 h before being placed in the O2 vial. A dark period of at least 5 min was used to record the respiration rate and then O2 evolution was monitored with illumination at 200 μmol photons m−2 s−1 for 5 min.
Time‐lapse microscopy
Light microscopy images were acquired using a DMi8 Inverted Microscope with a DFC700 T colour camera (Leica Microsystems, Milton Keynes, UK). During time‐lapse imaging, cells were placed on a cooled stage at 17°C. For time‐lapse imaging of cell division, cells were maintained in the dark and illuminated only for image capture (exposure, 300 ms; frame rate, 5 min). Approximately 10–20 cells were viewed simultaneously for each time lapse. Where stated, cells were gently decalcified with 0 mM Ca2+ ASW at pH 7.0 for 1 h before resuspension in FSW f/2. To monitor the response to Ge treatment, cells were grown in 40 ml of culture and 1 ml aliquots were removed every 24 h for time‐lapse imaging over a period of 12 h. Cells were maintained on the microscope in constant light to encourage calcification. Approximately 100–120 cells were viewed simultaneously for these time lapses. Images and sequences were processed using Leica Applications Suite X and ImageJ (Abràmoff et al., 2004) software.
Fluorescence microscopy
Nuclei of Ge‐treated cells were stained with Hoechst 33342 (Invitrogen) at a final concentration of 1 μg ml−1, and incubated in the dark at 15°C for 1 h. The cells were then stained with FM 1‐43 (N‐(3‐triethylammoniumpropyl)‐4‐(4‐(dibutylamino) styryl) pyridinium dibromide) (Thermo Fisher, Loughborough, UK) immediately before imaging with a DMi8 Inverted Microscope (Leica Microsystems) with an ORCA Flash 4.0 camera (Hamamatsu, Hamamatsu, Japan). Hoescht 33342 was excited at 395 nm with emission at 435–485 nm. FM 1‐43 was excited at 470 nm with emission at 500–550 nm. Extracellular polysaccharides were stained using the fluorescent lectin, FITC‐Concanavalin A (100 μg ml−1). Cells were rapidly decalcified in situ on the microscope to ensure that the occurrence of paired cells was not induced by the decalcification process; 1 ml of C. braarudii cells was decalcified following the addition of 10 μl of 1 M HCl for 10 min. pH was then restored by the addition of an equal volume of 1 M NaOH. Cells were imaged using a Zeiss LSM 510 laser scanning confocal microscope (Zeiss, Cambridge, UK), with excitation at 488 nm and emission at 500–530 nm (FITC) and 650–715 nm (chlorophyll).
Scanning electron microscopy (SEM)
Samples for SEM were filtered onto a 13‐mm, 0.4‐μm Isopore filter (Millipore EMD, Watford, UK) and rinsed with 5 ml of 1 mM HEPES‐buffered (pH 8.2) MilliQ water to remove any salt. Filters were air dried, mounted onto an aluminium stub and sputter coated with 10 nm Pt/Pd (Cressington, Watford, UK). Samples were examined using a Phillips XL30S FEG SEM (FEI‐Phillips, Hillsboro, OR, USA) and imaged in high‐resolution secondary electron mode with a beam acceleration of 5 kV. SEM was used to score malformed, incomplete and normal coccoliths for each cell examined (> 30 cells per sample).
Immunofluorescence microscopy
Samples were prepared for immunofluorescence microscopy as described by Durak et al. (2017). Briefly, C. braarudii cells were decalcified with Ca2+‐free ASW pH 8.0 containing 25 mM ethylene glycol‐bis(β‐aminoethyl ether)‐N,N,N′,N′‐tetraacetic acid (EGTA). Cells were then fixed for 10 min in an ASW solution containing 2% glutaraldehyde and 1.7% BSA (bovine serum albumin). Samples were washed three times with a solution of ASW with 1.7% BSA and 0.5% glutaraldehyde, and then incubated for 10 min in 0.05% Triton X‐100 in ASW. Samples were then washed three times with ASW/1.7% BSA and incubated for a further 20 min. Fixed samples were incubated overnight in a 1/50 dilution of the primary anti‐α‐tubulin antibody, washed three times with ASW/1% BSA and then incubated in a 1/150 dilution of the secondary Texas Red‐conjugated antibody for 2.5 h. Cells were then washed a final three times with ASW/1.7% BSA. Cells were imaged using an LSM 510 confocal laser scanning microscope (Zeiss). Texas Red was excited at 543 nm, with emission at 575–625 nm. Calcite was imaged using reflectance, with excitation at 633 nm and a short‐pass emission filter at 685 nm.
Results
Disruption of calcification in C. braarudii
We examined the physiological effects of disrupting calcification in E. huxleyi and C. braarudii using multiple independent methodologies: low‐Ca2+ seawater, the addition of HEDP or the addition of Ge. Ge was not applied to E. huxleyi, as we have demonstrated previously that this species does not require Si for calcification and is consequently unaffected by Ge, even at very high Ge/Si ratios (Durak et al., 2016). Calcification was substantially disrupted in E. huxleyi cultures grown at 1 mM Ca2+ or in the presence of 50 μM HEDP, consistent with previous reports (Sekino & Shiraiwa, 1994; Herfort et al., 2002; Trimborn et al., 2007; Leonardos et al., 2009; Mackinder et al., 2011). All three treatments (low Ca2+, HEDP and Ge) also had profound and specific impacts on the calcification process in C. braarudii. SEM revealed the presence of one to two incomplete coccoliths in C. braarudii cells grown at 1 mM Ca2+ for 48 h, suggesting that this treatment interfered with the ability to form new coccoliths, but did not cause extensive dissolution of existing coccoliths (Fig. 1a; Supporting Information, Table S1). Treatment with 50 μM HEDP resulted in grossly malformed coccoliths that could be initially observed after 24 h and were abundant after 72 h. Cells exposed to Ge at a Ge/Si ratio of 0.2 generated highly malformed coccoliths within 24 h that were morphologically distinct from the malformed coccoliths formed following HEDP treatment. Polarized light microscopy of decalcified C. braarudii cells after 24 h of Ge treatment allowed us to confirm that the coccolith malformations occur internally, within the coccolith vesicle (Fig. S1). We have observed previously that malformed coccoliths in C. braarudii often fail to integrate into the coccosphere and accumulate in the seawater medium around the cell (Durak et al., 2016). All three treatments applied to C. braarudii cells in this study resulted in a significant increase in discarded coccoliths after 48 and 72 h (Fig. 1b), indicating that many of the newly produced coccoliths were not incorporated into the coccosphere. Thus, although the cells continue to calcify and produce coccoliths following treatment with low Ca2+, HEDP or Ge, their ability to maintain a complete coccosphere is compromised.
Figure 1.
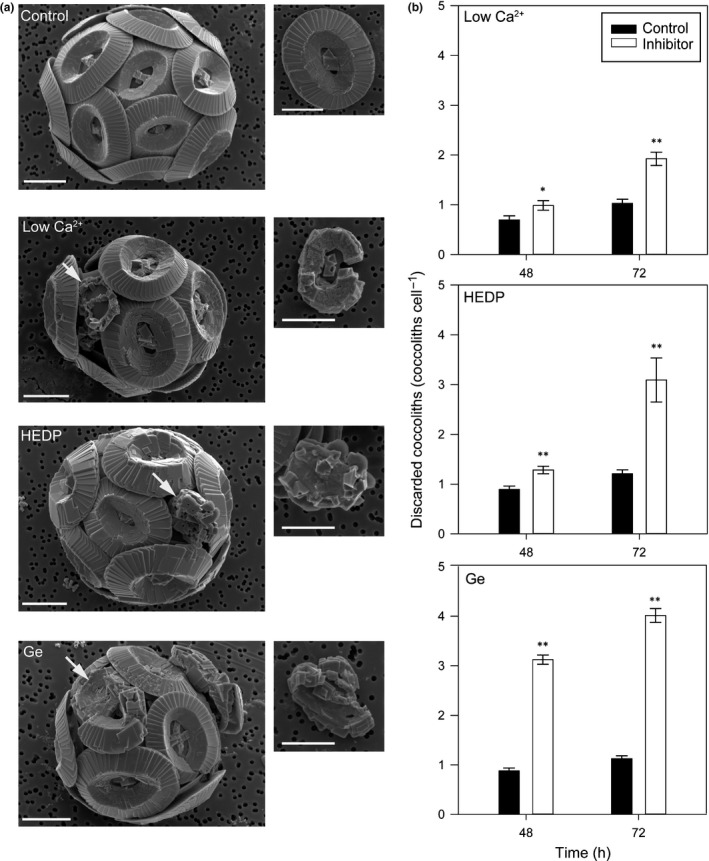
Disruption of calcification in Coccolithus braarudii. (a) Representative scanning electron microscopy (SEM) images of C. braarudii cells grown in 1 mM Ca2+ (48 h), 5 μM HEDP (24 h) and 0.2 germanium (Ge)/silicon (Si) (100 μM Si, 24 h). Incomplete or malformed coccoliths can be observed in response to all three treatments (arrows), whereas these are largely absent from control cells. Insets show representative incomplete or malformed coccoliths in greater detail. Incomplete coccoliths are defined as those that exhibit the oval shape of control coccoliths, but calcite precipitation is not complete. Malformed coccoliths are defined as coccoliths with gross defects in crystal morphology and no longer resemble the oval morphology of control coccoliths. Bars, 5 μm. (b) Treatments used to disrupt calcification in C. braarudii result in a significant increase in discarded coccoliths per cell (*, P < 0.05; **, P < 0.01, one‐way ANOVA with Holm–Sidak post hoc test), indicative of incomplete or malformed coccoliths that fail to integrate successfully into the coccosphere. Error bars denote ± SE. n = 3.
Disruption of calcification inhibits growth in C. braarudii
Disruption of calcification with 1 mM Ca2+ or 50 μM HEDP had dramatically different effects on growth in E. huxleyi and C. braarudii (Fig. 2a,b). Emiliania huxleyi did not exhibit any significant change in growth at 1 mM Ca2+ or 50 μM HEDP, confirming previous reports (Sekino & Shiraiwa, 1994; Herfort et al., 2002, 2004; Shiraiwa, 2003; Trimborn et al., 2007; Leonardos et al., 2009), whereas growth of C. braarudii was severely inhibited by both treatments. The growth of C. braarudii was also severely inhibited following treatment with Ge (0.2 Ge/Si) for 9 d (Fig. 2c). Thus, disruption of calcification by multiple methods has little impact on growth in E. huxleyi, but results in severe inhibition of growth in C. braarudii, suggesting that the requirement for calcification is very different between these species.
Figure 2.
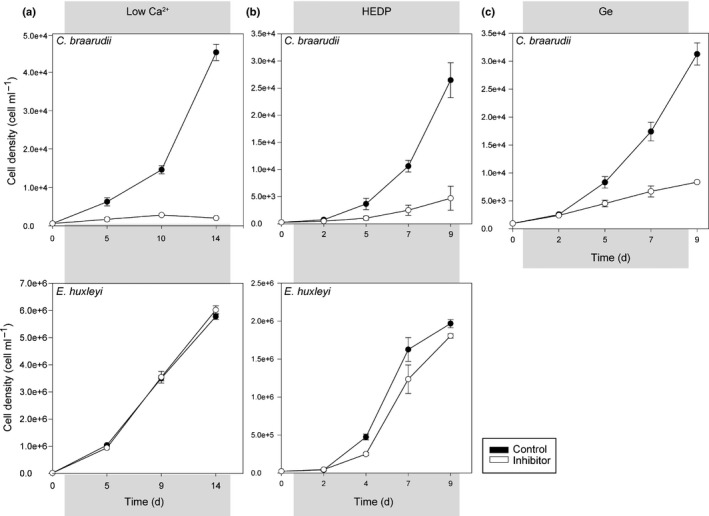
Disruption of calcification leads to a reduction in growth in Coccolithus braarudii. (a) Growth of C. braarudii and Emiliania huxleyi at 1 or 10 mM Ca2+ for 14 d. The specific growth rate (SGR ± SE) of E. huxleyi was not significantly different at 1 mM Ca2+ relative to the 10 mM Ca2+ control (0.55 ± 0.006 and 0.55 ± 0.002 d−1, respectively, P = 0.91, two‐tailed t‐test), whereas the growth of C. braarudii was severely inhibited at 1 mM Ca2+ (SGR ± SE = 0.16 ± 0.01 d−1) relative to the control (SGR ± SE = 0.32 ± 0.01 d−1, P < 0.05). (b) The growth of C. braarudii in 50 μM HEDP for 9 d was significantly reduced compared with the control (SGR ± SE = 0.30 ± 0.05 and 0.53 ± 0.01 d−1, respectively, P < 0.05), whereas the growth of E. huxleyi was not significantly different (SGR ± SE: 50 μM HEDP, 0.66 ± 0.03 d−1; control, 0.76 ± 0.08 d−1; P = 0.31). (c) The growth of C. braarudii in the presence of germanium (Ge; 0.2 Ge/silicon (Si)) for 9 d was significantly reduced relative to the control (SGR ± SE = 0.20 ± 0.04 d−1 compared with 0.38 ± 0.03 d−1 in the control, P < 0.05). Error bars denote ± SE and, in all cases, a two‐tailed t‐test was used. n = 3.
All three treatments (Ge, HEDP and low Ca2+) have distinct impacts on coccolith morphology, suggesting that each acts to disrupt calcification directly, rather than causing defects in coccolith morphology indirectly via reduced growth. In support of this hypothesis, the defects in coccolith morphology in response to Ge and HEDP treatment arise very rapidly (Table S1), before any defect in growth is observed (Fig. 2). The coccolith malformations are also distinct from those arising from nutrient limitation or temperature stress (Gerecht et al., 2014, 2015).
Low Si inhibits growth when coccosphere formation is disrupted
We have shown previously that C. braarudii exhibits subtle defects in coccolith morphology after 3 d in very low [dSi] (< 0.2 μM), although cells monitored for up to 8 d exhibited no decrease in growth rate (Durak et al., 2016). As the requirement for Si is likely to be low in C. braarudii (compared with silicified organisms), we grew the cells at very low [dSi] (< 0.2 μM) for longer periods (27 d, subculturing the cells every 9 d) to ensure that any intracellular pools of Si were depleted. Light microscopy observations at 9 d and 18 d did not reveal clear defects in the coccosphere at < 0.2 μM [dSi] (Fig. S2) compared with the control (20 μM [dSi]), and no effects on growth were observed (Fig. 3a). However, after transfer to the third subculture, cells at < 0.2 μM [dSi] were observed with incomplete or partial coccospheres after 21 d, whereas cells at 20 μM [dSi] were fully calcified (Fig. S2). Growth was also greatly reduced at < 0.2 μM [dSi] during the third subculture compared with the control (SGR ± SE of 0.11 ± 0.08 and 0.29 ± 0.03 d−1, respectively, P ≤ 0.05, n = 3, one‐tailed t‐test) (Fig. 3a). To test whether the inhibition of growth caused by Si limitation was reversible, we transferred poorly calcified cells grown at < 0.2 μM [dSi] for 21 d into media containing < 0.2 μM or 20 μM [dSi]. The cells transferred to < 0.2 μM [dSi] did not demonstrate any further growth after 21 d and still possessed incomplete or partial coccospheres. However, the cells transferred from < 0.2 μM [dSi] to 20 μM [dSi] exhibited fully formed coccospheres within 7 d of the resupply of Si, and growth was partially restored after this time point (Figs 3b, S2). The delayed growth response to Si addition suggests that the recovery of an Si‐dependent process, such as calcification, is responsible for the growth rescue rather than simply the resupply of Si.
Figure 3.
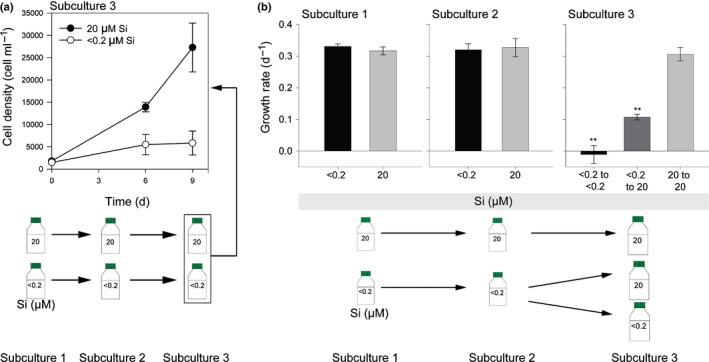
Disruption of calcification by limitation of silicon (Si) availability. (a) Growth of Coccolithus braarudii at < 0.2 μM [dSi] in semi‐continuous batch culture for 27 d. Cells were subcultured every 9 d. No effect of Si limitation was observed on growth in the first two subcultures (0–9 d, 9–18 d). In the third sub‐culture (18–27 d), growth at < 0.2 μM [dSi] was greatly reduced compared with cultures maintained at 20 μM [dSi] (n = 3). The experiment was repeated twice more with similar results. (b) Rescue of Si‐limited cultures. Cells grown in < 0.2 μM [dSi] for 21 d (subcultures 1 and 2) were transferred into media containing < 0.2 or 20 μM [dSi] (subculture 3). Growth in subculture 3 was absent at < 0.2 μM [dSi]. However, growth was partially restored in cells transferred from < 0.2 μM to 20 μM [dSi] (**, P < 0.01, SGR calculated 7–14 d after Si resupply, one‐way ANOVA with Holm–Sidak post hoc test, n = 3 biological replicates unnecessary as stated in methods). Error bars denote ± SE.
Disruption of calcification does not inhibit photosynthesis
We examined whether inhibition of growth following disruption of calcification was caused by an effect of calcification on photosynthesis, such as acting as a carbon‐concentrating mechanism or modulating light entry into the cell. Disruption of calcification with low Ca2+ (1 mM), 50 μM HEDP or 20 μM Ge (0.2 Ge/Si ratio) had no impact on the photosynthetic efficiency of photosystem II (quantum yield, F v/F m) in C. braarudii cells after 72 h of treatment, suggesting that the absence of calcification did not lead to broad disruption of the photosynthetic apparatus (Figs 4a, S3). Similarly, we observed no decrease in the rate of photosynthetic O2 evolution in cells transferred to 0 or 1 mM Ca2+ for 24 h relative to the control (10 mM Ca2+) (one‐way ANOVA, P = 0.90, n = 3) (Fig. 4b). We conclude that direct inhibition of photosynthetic function does not appear to be responsible for the reduction in growth in C. braarudii following disruption of calcification. Moreover, the absence of a significant effect on photosynthetic efficiency after 72 h indicated that the treatments used to disrupt calcification do not lead to the disruption of general cellular function.
Figure 4.
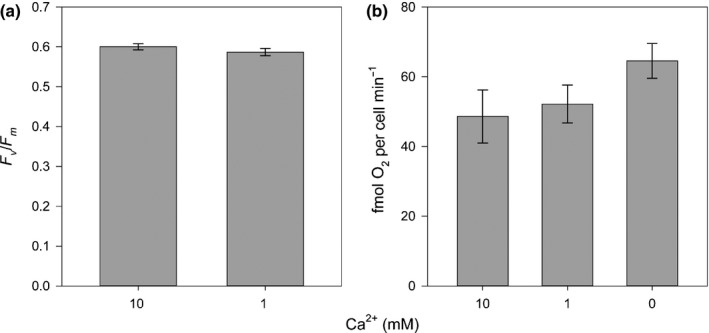
Disruption of calcification with low Ca2+ does not inhibit photosynthetic activity. (a) Photosynthetic efficiency (quantum yield, F v/F m) was measured in Coccolithus braarudii cultures incubated in artificial seawater (ASW) containing 1 or 10 mM Ca2+ for 72 h. No significant difference in F v/F m was observed relative to the control (P ≥ 0.05, n = 3, two‐tailed t‐test). (b) Photosynthetic O2 evolution in C. braarudii cultures after growth in ASW with 0, 1 or 10 mM Ca2+ for 24 h. Disruption of calcification with 0 or 1 mM Ca2+ did not result in a statistically significant change in the rate of O2 evolution (P ≥ 0.05, n = 3, one‐way ANOVA). Error bars denote ± SE. The experiment was repeated twice; a representative example is shown.
The role of the coccosphere during cell division
We next investigated whether the inhibition of growth resulted from the inability of C. braarudii to form a complete coccosphere. Removal of the coccosphere does not lead to an immediate loss of cell viability in C. braarudii as decalcified cells continue to calcify and eventually form a complete new coccosphere (Taylor et al., 2007, 2017). However, the mechanisms enabling the reorganization of the coccosphere during cell division are not known, and it is possible that disruption of calcification interferes with this process. Coccolithophore cells become larger during the day and, once they surpass a size threshold (Müller et al., 2008), divide into two smaller daughter cells during the dark period. Although there have been some previous observations of cell division using light microscopy (Parke & Adams, 1960), direct visualization of the process in live cells has not been reported. Using time‐lapse imaging, we found that dividing C. braarudii cells elongate immediately before cell division (Fig. 5; Video S1). The coccoliths move flexibly to span the fissure between the two daughter cells before closing in a hinge‐like motion to form two distinct, but attached, cells. The coccoliths undergo further rearrangement and, once both daughter cells have complete coccospheres, the cells separate. The remarkable flexibility in the coccosphere ensures that C. braarudii is able to rearrange its closely interlocking coccoliths to cover the dividing cell throughout the entire process. We observed that cells remained attached for a short period after division, but then separated between 4 and 7 h later (n = 4 cells undergoing both division and separation within a 12‐h time course; Fig. S4). Interestingly, secretion of a partially formed or complete coccolith was observed during the process of cell division (Fig. 5) (38.1% of all division events observed, n = 21). This suggests that the intracellular coccolith may interfere with the rearrangement of the cytoskeleton during cell division and is therefore exocytosed, even if it is only partially formed, which is consistent with previous light microscopy observations noting the absence of an internal coccolith in dividing cells (Parke & Adams, 1960).
Figure 5.
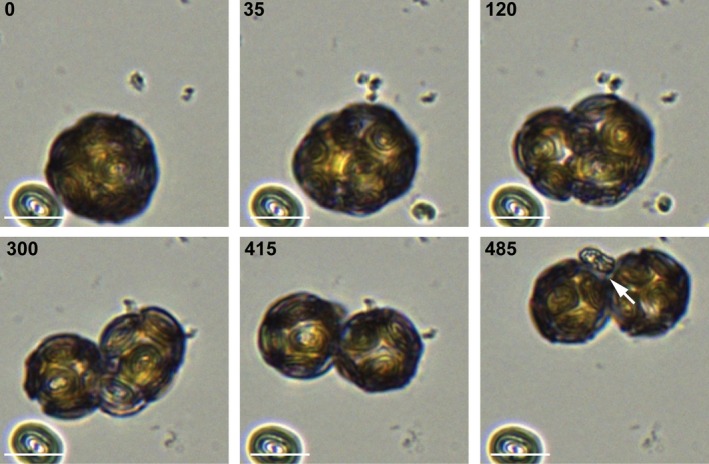
Rearrangement of the coccosphere during cell division. Time‐lapse light microscopy imaging of Coccolithus braarudii undergoing cell division recorded over 16 h in the dark (16°C). At the onset of cell division, the cell begins to elongate and the coccoliths move flexibly on the cell surface to maintain a complete coccosphere (35 min). As the cell divides (300 min), the coccosphere rearranges to ensure that both daughter cells are fully covered following division (415 min). In the example shown, a partially formed coccolith is secreted during division (arrowed), implying that cell division occurs regardless of whether coccolith production is completed. Bars, 10 μm.
To examine the interaction between calcification and cell division in more detail, we used immunofluorescence microscopy to image the microtubule network during cell division. In dividing cells, a very clear microtubule bundle can be observed which spans both cells, persisting even after full separation of the daughter nuclei (Fig. 6). Intracellular coccoliths are present in nearly all non‐dividing cells (85.3% of cells exhibit distinct coccoliths and a further 11.8% exhibit smaller accumulations of intracellular calcite, n = 68 cells), whereas coccoliths are absent from dividing cells (n = 14). These data illustrate the requirement for significant rearrangement of the cytoskeleton during cell division in coccolithophores. The absence of internal coccoliths from dividing cells supports our observation that coccoliths are secreted before cell division.
Figure 6.
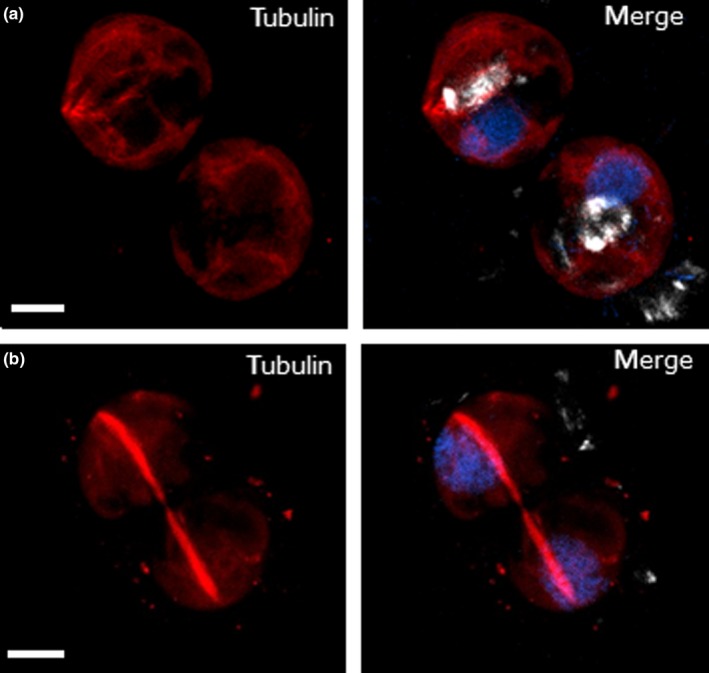
Immunofluorescence microscopy of tubulin in dividing Coccolithus braarudii cells. Cells were decalcified before imaging. (a) Three‐dimensional (3D) projection of a confocal microscopy Z‐stack showing the presence of internal coccoliths in non‐dividing cells (white). The nuclei are stained with Hoescht (blue) and tubulin is shown in red. Note that there is some non‐specific background fluorescence in the red channel caused by fixation with glutaraldehyde. (b) The microtubule network in dividing C. braarudii cells is characterized by a distinct microtubule bundle that spans both daughter cells. Two distinct nuclei can be observed, but intracellular calcite is absent. Image is representative of 14 cells examined. Bars, 5 μm.
Disruption of the coccosphere prevents separation following cell division
To test whether an intact coccosphere was required for entry into the cell cycle, decalcified C. braarudii cells were observed by time‐lapse microscopy for 12 h. We observed that fully decalcified cells undergo cytokinesis, indicating that the absence of a coccosphere does not prevent entry into and progression through the cell cycle (Fig. S5). However, closer inspection of HEDP‐ and Ge‐treated cells revealed that many cells are present in pairs, comprising two cells closely attached to each other (Fig. 7). The number of paired cells increased progressively following treatment, with up to 68% of cells present as pairs after treatment with Ge (0.2 Ge/Si) or 50 μM HEDP for 6 or 7 d, respectively (Fig. 7a,b). The paired‐cell phenotype was not apparent in cells grown at 1 mM Ca2+, suggesting that the mechanism of growth inhibition may differ in low Ca2+ (Fig. 7c).
Figure 7.
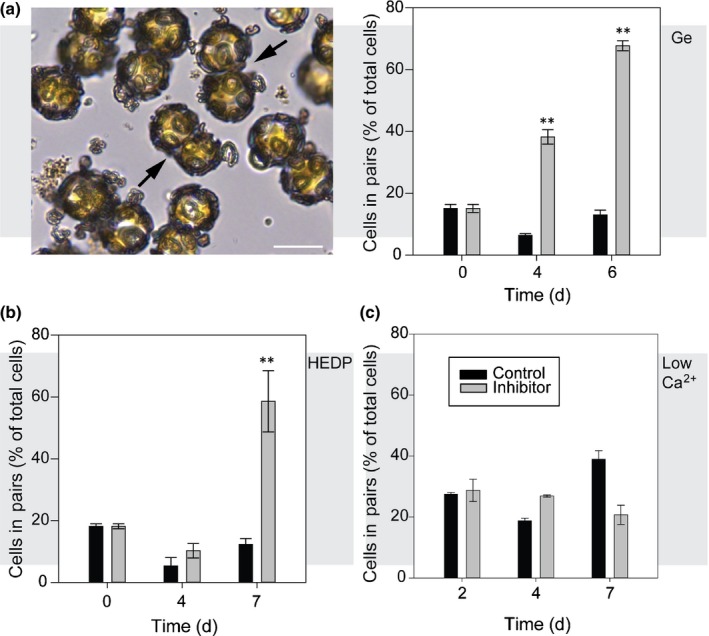
Paired cells accumulate in cells with disrupted calcification. (a) Paired cells (arrowed) accumulate in germanium (Ge)‐treated Coccolithus braarudii repetitive of word cells (2 μM Ge, 0.2 Ge/silicon (Si)). The graph shows the percentage of cells present as pairs (viewed by light microscopy). n > 100 cells for each measurement. Bar, 20 μm. (b) Percentage of cells present as pairs in C. braarudii cells treated with 50 μM HEDP. (c) Percentage of cells present as pairs in C. braarudii cells grown in artificial seawater (ASW) at 1 mM Ca2+, relative to control cells at 10 mM Ca2+. No increase in cells in pairs was observed in the low‐Ca2+ treatment. **, P < 0.01, one‐tailed t‐test. n = 3 replicates for treatments. Error bars denote ± SE.
Although flow cytometry is commonly used to measure cell cycle progression in unicellular organisms, we found that the fragile C. braarudii cells were not amenable to this approach. Furthermore, flow cytometry cannot adequately distinguish between two cells that remain attached to each other and a cell in G2/M phase. We therefore used time‐lapse microscopy to enable the direct observation of cell division, coccolith production and calcification status of individual Ge‐treated cells. Importantly, this also allowed us to obtain detailed information on the status of the coccosphere in individual cells before division. A culture of C. braarudii cells treated with Ge (0.2 Ge/Si) was sampled every 24 h over a period of 5 d to generate a series of individual 12‐h time‐lapse recordings. These images revealed that the initial secretion of malformed coccoliths occurs within 6 h of Ge treatment, suggesting that Ge has a rapid impact on coccolithogenesis (Figs 8a, S6). The continued production of malformed coccoliths could be observed on successive days, leading to a progressive decrease in the integrity of the coccosphere, with most cells possessing severely defective coccospheres after 5 d (Figs 8a, S7). Time‐lapse observation of individual cells indicated that paired cells form when cells divide, but fail to separate (Fig. 8b). Examination of each paired cell (n > 500 paired cells examined) indicated that, in every case, both daughter cells exhibited significant defects in coccosphere integrity. The number of cells exhibiting the paired‐cell phenotype increased dramatically over the course of the experiment, from 4% after 24 h, through to 89.5% after 96 h (Fig. 8c). The increasing proportion of cells present as pairs therefore correlates with both the decrease in the integrity of the coccosphere and the decrease in growth rate in Ge‐treated cells (Fig. 2).
Figure 8.
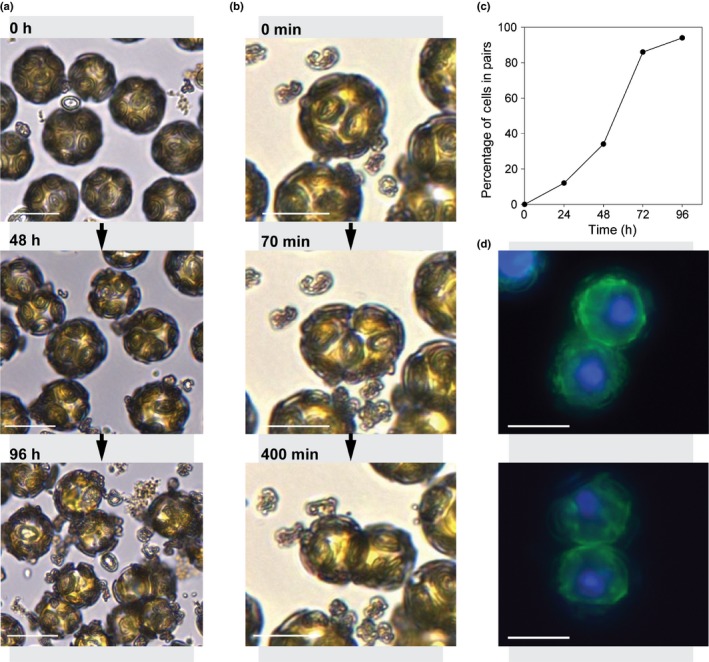
Progressive disruption of the coccosphere in Coccolithus braarudii cells treated with germanium (Ge). (a) Time‐lapse light microscopy showing the progressive degradation of the coccosphere and the accumulation of paired cells in C. braarudii cells treated with 2 μM Ge (0.2 Ge/silicon (Si)) over a 96‐h period. Cells exhibit intact coccospheres at 0 h, but start to produce malformed coccoliths soon after the addition of Ge. After 96 h, most cells exhibit incomplete coccospheres and many are present as paired cells. (b) Time‐lapse light microscopy showing the formation of a cell pair after 3 d of Ge treatment (0.2 Ge/Si). Parent cells with partial coccospheres divide, but the daughter cells fail to fully separate. Frame labels represent minutes passed. (c) The percentage of paired cells after treatment with 2 μM Ge (0.2 Ge/Si) over 5 d (n ≥ 500 cells counted). (d) Epifluorescence microscopy of paired C. braarudii cells. The nuclei were stained with Hoechst (blue) and the plasma membrane was stained with FM 1‐43 (green). Cells were not decalcified before imaging. Each paired cell examined showed completed cytokinesis with two defined nuclei and a distinct plasma membrane. Bars, 20 μm.
DNA staining showed that the paired cells represented two individual daughter cells, each with a single nucleus and a distinct plasma membrane (Fig. 8d). No clear difference in DNA content was observed between control and Ge‐treated cells. We did not observe any further rounds of cell division in paired cells in time‐lapse images (i.e. leading to the formation of tetrad cell arrangements). This indicates that there is a cell cycle arrest following the initial division, which is most likely the underlying cause of growth inhibition.
A polysaccharide‐rich organic layer contributes to cell adhesion in the absence of the coccosphere
Transmission electron microscopy indicates that C. braarudii possesses an organic layer around the cell, which probably aids in the organization of the coccosphere and its adhesion to the cell body (Taylor et al., 2007). We used confocal microscopy of the fluorescent lectin, FITC‐Concanavalin A, to visualize polysaccharides in this organic layer around decalcified C. braarudii cells. Three‐dimensional (3D) reconstruction of the polysaccharide layer from control cells (which have an intact coccosphere before decalcification) revealed that its structure was not uniform, with distinct oval‐shaped regions present at regular intervals that were not stained by FITC‐Concanavalin A (Fig. 9a). The mean maximal diameter ± SE of the non‐stained regions was 4.22 ± 0.16 μm (n = 15), which is similar to the inner diameter of the shield elements of the coccolith, suggesting that these regions may correspond to apertures in the polysaccharide layer that form around each coccolith. The distinct structural properties of the polysaccharide layer, which are retained even after decalcification, are likely to contribute to the dynamic reorganization of the coccosphere throughout the processes of cell expansion and division.
Figure 9.
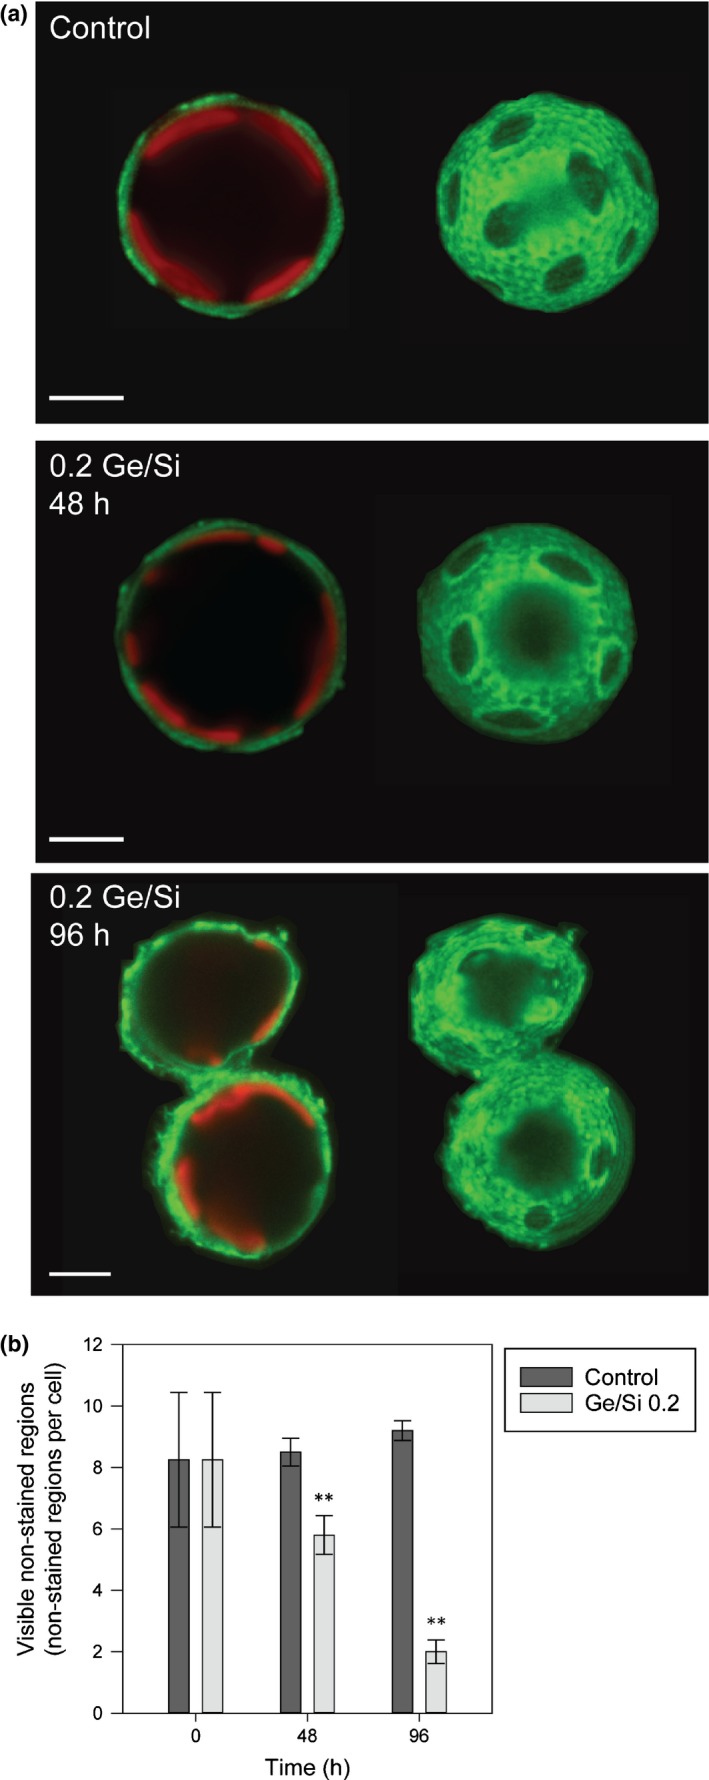
A structured polysaccharide layer is involved in organization of the coccosphere. (a) Confocal microscopy imaging of a decalcified Coccolithus braarudii cell stained with the lectin FITC‐Concanavalin A (green). Chlorophyll autofluorescence is also shown (red). An external polysaccharide layer can be observed that is distinct from the faint staining present at the plasma membrane (left). Three‐dimensional (3D) reconstruction from Z‐stacks reveals that the polysaccharide layer contains distinct non‐stained oval‐shaped regions, which are likely to correspond to the position of the coccoliths. 3D reconstructions of the cells in 0.2 germanium (Ge)/silicon (Si) (10 μM Si) at 48 and 96 h show a reduction in the number of non‐stained oval‐shaped regions per cell and increasing irregularity in their shape. Examination of paired cells present after 96 h revealed that each cell in a pair is surrounded by a continuous polysaccharide layer (FITC‐Concanavalin A, green) with staining clearly visible at the connection point between the two cells. Paired cells were first identified by light microscopy and then decalcified in situ to ensure that adhesion between cells was not a result of the decalcification process. Bars, 5 μm. (b) The number of visible non‐stained regions per cell was scored at 0, 48 and 96 h. There was a significant reduction (**) in visible non‐stained regions in Ge‐treated cells when compared with the control at 48 and 96 h (Mann–Whitney U‐test, P ≤ 0.01, n = 20). Error bars denote ± SE.
In situ decalcification of paired cells from a Ge‐treated culture (after 96 h) revealed that each cell was surrounded by a distinct polysaccharide layer, further confirming that the paired cells are two individual cells (Fig. 9a). Direct contact between the polysaccharide layers surrounding each cell suggests that the polysaccharide contributes to cell–cell adhesion. The polysaccharide layer was more irregular and the number of non‐stained regions associated with the coccoliths was significantly decreased in Ge‐treated cells when compared with the control over 48 and 96 h (Fig. 9b, Mann–Whitney U‐test, P ≤ 0.001, n = 20). As Ge‐treated cells have partially formed or incomplete coccospheres at 96 h because of the inability of malformed coccoliths to integrate into the coccosphere, the data support the hypothesis that the non‐stained regions of the polysaccharide layer are apertures that are formed by the insertion of the coccoliths. We conclude that the absence of an intact coccosphere in Ge‐treated cells interferes with normal separation of dividing cells and results in cell–cell adhesion via the polysaccharide layer.
Discussion
Our results show that disruption of calcification has dramatically different impacts on the physiology of C. braarudii and E. huxleyi. Growth of C. braarudii was severely inhibited following disruption of calcification by Ge, low Si, HEDP and low Ca2+, whereas E. huxleyi grew normally when calcification was disrupted by the last two treatments. Although it is possible that Ge or HEDP may have additional impacts on the metabolism of C. braarudii, these treatments are not generally toxic to haptophytes, as concentrations much higher than those required to disrupt calcification have little impact on the growth of E. huxleyi and C. carterae (Sekino & Shiraiwa, 1994; Asahina & Okazaki, 2004; Durak et al., 2016). Similarly, although Ca2+ is essential for many cellular processes, the lowering of seawater Ca2+ to 1 mM does not severely inhibit the growth of other marine phytoplankton (Herfort et al., 2004; Trimborn et al., 2007; Leonardos et al., 2009; Müller et al., 2015). Furthermore, the impact of low Si on growth of C. braarudii at < 0.1 μM Si was only observed following disruption of the coccosphere, suggesting that the effect on growth was specific to the defect in calcification. The combined evidence from these four independent methodologies suggests that there is an essential requirement for calcification in C. braarudii, but not E. huxleyi.
Our data highlight the dynamic nature of the coccosphere in C. braarudii and demonstrate the need for coordination between calcification and the cell cycle. Calcification and cell division in coccolithophores are, to some extent, temporally separated, with cell division occurring primarily in the dark, whereas calcification is largely limited to G1 phase in the light (Paasche, 2001). Our time‐lapse observations of dividing C. braarudii cells illustrate the rearrangement of the coccosphere during this process and the need for flexible organization of the coccosphere as the cells grow and expand between divisions. Coccolithus braarudii cells possess ≤ 8 coccoliths immediately after cell division, but this increases to ≥ 16 coccoliths in cells that are ready for division (Gibbs et al., 2013). The coccosphere of C. braarudii therefore represents a highly dynamic single layer of interlocking coccoliths that is maintained throughout changes in cell volume and the process of cell division. It appears that the polysaccharide layer surrounding the cell (Taylor et al., 2007) contributes to the organization of the coccosphere. This layer is not a simple gelatinous mass, but has sufficient structural rigidity (evidenced by the retention of coccolith‐related features in this layer following decalcification) to enable the specific arrangement of the coccoliths. However, the rapid rearrangement of the coccosphere during cell division also indicates that coccoliths are able to move within the polysaccharide layer relative to each other and that their position is not rigidly fixed.
Our experiments also provide insight into the cellular mechanisms through which disruption of calcification may act to inhibit growth in C. braarudii. In Ge‐ and HEDP‐treated cells, we found that the adhesive properties of the organic layer probably prevent cells with disrupted coccospheres from separating after cell division. Paired cells were also observed in Si‐limited cells with disrupted coccospheres. As paired cells fail to divide further, they may be prevented from reaching a critical size that is required for entry into S phase, leading to cell cycle arrest. Entry into S phase of the cell cycle in E. huxleyi is triggered by the increase in cell size above a certain threshold (Müller et al., 2008). Under conditions in which cells can calcify normally and maintain a complete coccosphere, the area of direct contact between dividing cells would be minimal, preventing adhesion between dividing cells. Thus, the defect in growth in cells treated with Ge, HEDP or low Si appears to result primarily from the inability to maintain a coccosphere following disruption of calcification. We did not find any evidence for a direct cell cycle arrest in Si‐limited cells analogous to that seen in diatoms (Vaulot et al., 1987; Brzezinski et al., 1990). Si limitation takes much longer than treatment with Ge to disrupt calcification. We presume that coccolithophores have a low requirement for Si, and it takes many generations for the intracellular pool of Si to become fully depleted. The rapid impact of Ge treatment (compared with Si limitation) suggests that Ge does not simply act as a competitive inhibitor of Si uptake, but also acts to disrupt the intracellular role of Si, as observed in diatoms and choanoflagellates (Azam & Volcani, 1981; Marron et al., 2016).
Coccolithus braarudii cells grown at 1 mM Ca2+ did not exhibit a paired‐cell phenotype, indicating that the growth arrest from this treatment did not arise from cell adhesion following disruption of the coccosphere. Although other marine phytoplankton are able to grow at 1 mM Ca2+ (Müller et al., 2015), it is possible that, in C. braarudii, the huge demand for Ca2+ in calcification leads to a broad disruption of cellular Ca2+ homeostasis that interferes with Ca2+‐dependent processes required for growth and cell division. Evidence in support of this hypothesis comes from studies in Chrysotila (formerly Pleurochrysis) haptonemofera, which have demonstrated that the growth of calcifying cells is inhibited at 0.5 mM Ca2+, whereas non‐calcifying cells grow normally at this concentration (Katagiri et al., 2010). Low Ca2+ does not disrupt growth in calcifying E. huxleyi cells, which may be a reflection of its ability to greatly vary rates of coccolith production (Paasche, 1998). The mechanisms of Ca2+ uptake and partitioning in E. huxleyi may also differ from those in other coccolithophores (Sviben et al., 2016; Gal et al., 2017). The absence of a paired‐cell phenotype in C. braarudii in low Ca2+ may also relate to the influence of low external Ca2+ on the physical properties of the extracellular polysaccharides, as many algal polysaccharides, such as pectins and alginates, are cross‐linked by Ca2+ and exhibit vastly different properties at lower Ca2+ concentrations (Corpe, 1964; Haug, 1976; Matoh & Kobayashi, 1998; Domozych et al., 2014).
The differing requirement to maintain a coccosphere between C. braarudii and E. huxleyi suggests that these species exhibit further mechanistic differences in the calcification process. This may relate to the different organization of the coccosphere in the two species, as the assembly of the coccosphere in E. huxleyi is less structured and can consist of multiple layers of coccoliths (Paasche, 2001). The coccosphere represents a uniform barrier that may help to protect the cell against external influences, such as excessive light levels, grazing by bacteria and zooplankton, or infection from pathogens. Monteiro et al. (2016) proposed that the requirement to protect the cell from grazing pressure may even have driven the evolution of calcification in coccolithophores c. 250 myr ago. In C. braarudii, selective pressure to maintain the coccosphere appears to have resulted in an inability to grow when calcification is disrupted. We found no evidence to suggest that the inhibition of growth in C. braarudii was related to impaired photosynthetic function, supporting conclusions from E. huxleyi that calcification does not act primarily to support photosynthesis in coccolithophores under standard laboratory conditions (Bach et al., 2013).
To examine whether the requirement to maintain the coccosphere may be widespread amongst other species, we performed a survey of the coccolithophore species held in major algal culture collections (Table S2). Only two lineages demonstrate the ability to routinely grow in a non‐calcified form in the diploid stage of the life cycle. The first of these groups contains solely E. huxleyi, whose ability to grow without coccoliths is well documented (Klaveness, 1972; Paasche, 2001). Interestingly, there are no reports that the closely related species Gephyrocapsa and Reticulofenestra are able to grow in a non‐calcified state, although all of these coccolithophores within the Noelaerhabdaceae are closely related to Isochrysis, which has completely lost the ability to calcify. The second group is composed of species from the Pleurochrysidaceae (Chrysotila) and Hymenomonadaceae (Ochrosphaera, Hymenomonas) in which the coccosphere is composed of many small coccoliths (Marsh & Dickinson, 1997; Marsh, 2004). All other coccolithophore species are fully calcified in healthy, actively growing diploid cultures. This finding suggests that the maintenance of the coccosphere in the diploid life cycle stage is a requirement for growth in many coccolithophore species, and that commonly used model organisms in laboratory studies, such as E. huxleyi and C. carterae, are not typical of coccolithophores as a whole. Many species of coccolithophore produce small holococcoliths in their haploid life cycle stage, which are distinct from the much larger heterococcoliths produced by the diploid. Intriguingly, the coccolithophore species that do not produce holococcoliths are also the species that can exist as non‐calcified diploids (e.g. Emiliania, Chrysotila, Hymenomonas) (De Vargas et al., 2007). Although it is not clear whether shared cellular mechanisms contribute to the formation of hetero‐ and holococcoliths, it is interesting that these species exhibit a lower requirement for calcification in both life cycle stages.
The essential requirement for an intact coccosphere in species such as C. braarudii could potentially influence their ecology and their response to future changes in ocean carbonate chemistry. The data presented here indicate that subtle impacts on calcification (such as those induced by low Si) may result in a progressive decline in the integrity of the coccosphere, eventually resulting in the inhibition of growth. A significant increase in seawater CO2 (pCO2 > 1000 μatm) results in a substantial decrease in both growth rate and calcification rate in C. braarudii, and also leads to the production of malformed coccoliths (Langer et al., 2006; Müller et al., 2010; Krug et al., 2011; Bach et al., 2015). It is interesting that prolonged growth of C. braarudii at elevated CO2 (> 45 d) resulted in a progressive decline in growth rate (Müller et al., 2010). Clearly, the responses of coccolithophores to changes in seawater carbonate chemistry are complex and involve many aspects of cellular physiology, but it is possible that accumulated defects in coccolith morphology and a resultant decline in coccosphere integrity could directly contribute to high CO2‐related growth defects in C. braarudii. This is an important consideration, as it reflects a potential direct impact of decreased calcification on physiology, which is not observed for E. huxleyi.
In summary, our results show that the ability of diploid E. huxleyi cells to persist in a non‐calcifying form is not typical of all coccolithophores. The requirement for calcification in C. braarudii is primarily a result of its need to maintain a full coccosphere, indicating that it is the coccosphere, rather than simply the ability to precipitate calcite, that is central to its ecology.
Author contributions
C.E.W. performed all the experimental analyses, except immunofluorescence imaging of cell division, which was provided by G.M.D. S.H. provided additional imaging of extracellular polysaccharides. G.L. and A.R.T. additionally contributed to SEM analysis. I.P. provided details of coccolithophore strains in the Roscoff Culture Collection. G.L.W., C.B. and C.E.W. designed the study. C.E.W., G.L., T.T., A.R.T., C.B. and G.L.W. wrote the manuscript.
Supporting information
Please note: Wiley Blackwell are not responsible for the content or functionality of any Supporting Information supplied by the authors. Any queries (other than missing material) should be directed to the New Phytologist Central Office.
Fig. S1 Images of internal malformed coccoliths.
Fig. S2 Images of silicon (Si)‐depleted cultures.
Fig. S3 Photosynthetic efficiency following disruption of calcification.
Fig. S4 Time‐lapse microscopy of cell division in Coccolithus braarudii.
Fig. S5 Cell division can occur in the absence of a coccosphere.
Fig. S6 Malformed coccolith production in germanium (Ge)‐treated cells.
Fig. S7 Germanium (Ge)‐treated cells exhibit a progressive disruption of the coccosphere as the cell volume increases.
Table S1 Disruption of calcification in Coccolithus braarudii by low Ca2+, HEDP or Ge, determined as the percentage of incomplete or malformed coccoliths in the coccosphere
Table S2 The calcification status of diploid coccolithophore strains in algal culture collections
Video S1 Cell division in Coccolithus braarudii.
Acknowledgements
C.E.W. is supported by a Natural Environment Research Council Doctoral Training Partnership (NERC DTP) studentship (NE/L002531/1]) from the SPITFIRE DTP. C.E.W. was additionally supported by the Gillings Graduate Exchange Programme (University of Southampton/University of North Carolina Wilmington). G.L.W., A.R.T. and C.B. acknowledge support from NERC (NE/N011708/1), National Science Foundation (NSF) (NSFGEO‐NERC 1638838) and the European Research Council (ERC‐ADG 670390). The authors declare no competing financial interests.
See also the Commentary on this article by https://doi.org/10.1111/nph.15409.
References
- Abràmoff MD, Magalhães PJ, Ram SJ. 2004. Image processing with ImageJ. Biophotonics International 11: 36–42. [Google Scholar]
- Asahina M, Okazaki M. 2004. Inhibition of crystal growth in coccolith formation of Pleurochrysis carterae by a potent scale inhibitor, (1‐hydroxyethylidene) bisphosphonic acid (HEBP). Thalassas 20: 51–58. [Google Scholar]
- Azam F, Volcani B. 1981. Germanium–silicon interactions in biological systems In: Simpson TL, Volcani BE, eds. Silicon and siliceous structures in biological systems. New York, NY, USA: Springer, 43–67. [Google Scholar]
- Bach LT, Mackinder LC, Schulz KG, Wheeler G, Schroeder DC, Brownlee C, Riebesell U. 2013. Dissecting the impact of CO2 and pH on the mechanisms of photosynthesis and calcification in the coccolithophore. Emiliania huxleyi . New Phytologist 199: 121–134. [DOI] [PubMed] [Google Scholar]
- Bach LT, Riebesell U, Gutowska MA, Federwisch L, Schulz KG. 2015. A unifying concept of coccolithophore sensitivity to changing carbonate chemistry embedded in an ecological framework. Progress in Oceanography 135: 125–138. [Google Scholar]
- Brownlee C, Taylor AR. 2003. Calcification in coccolithophores: a cellular perspective In: Thierstein H, Young JN, eds. Coccolithophores: from molecular processes to global impact. Berlin, Germany: Springer, 31–50. [Google Scholar]
- Brzezinski M, Olson R, Chisholm S. 1990. Silicon availability and cell‐cycle progression in marine diatoms. Marine Ecology Progress Series 67: 83–96. [Google Scholar]
- Corpe WA. 1964. Factors influencing growth and polysaccharide formation by strains of Chromobacterium violaceum . Journal of Bacteriology 88: 1433–1441. [DOI] [PMC free article] [PubMed] [Google Scholar]
- Danbara A, Shiraiwa Y. 1999. The requirement of selenium for the growth of marine coccolithophorids, Emiliania huxleyi, Gephyrocapsa oceanica and Helladosphaera sp. (Prymnesiophyceae). Plant and Cell Physiology 40: 762–766. [Google Scholar]
- Daniels CJ, Poulton AJ, Young JR, Esposito M, Humphreys MP, Ribas‐Ribas M, Tynan E, Tyrrell T. 2016. Species‐specific calcite production reveals Coccolithus pelagicus as the key calcifier in the Arctic Ocean. Marine Ecology Progress Series 555: 29–47. [Google Scholar]
- Daniels CJ, Sheward RM, Poulton AJ. 2014. Biogeochemical implications of comparative growth rates of Emiliania huxleyi and Coccolithus species. Biogeosciences 11: 6915–6925. [Google Scholar]
- De Vargas C, Aubry MP, Probert I, Young JN. 2007. Origin and evolution of coccolithophores: from coastal hunters to oceanic farmers In: Falkowski P, Knoll AH, eds. Evolution of primary producers in the sea. London, UK: Academic Press, 251–285. [Google Scholar]
- Domozych DS, Sørensen I, Popper ZA, Ochs J, Andreas A, Fangel JU, Pielach A, Sacks C, Brechka H, Ruisi‐Besares P. 2014. Pectin metabolism and assembly in the cell wall of the charophyte green alga Penium margaritaceum . Plant Physiology 165: 105–118. [DOI] [PMC free article] [PubMed] [Google Scholar]
- Durak GM, Brownlee C, Wheeler GL. 2017. The role of the cytoskeleton in biomineralisation in haptophyte algae. Scientific Reports 7: 15409. [DOI] [PMC free article] [PubMed] [Google Scholar]
- Durak GM, Taylor AR, Walker CE, Probert I, De Vargas C, Audic S, Schroeder D, Brownlee C, Wheeler GL. 2016. A role for diatom‐like silicon transporters in calcifying coccolithophores. Nature Communications 7: 10543. [DOI] [PMC free article] [PubMed] [Google Scholar]
- Gal A, Sviben S, Wirth R, Schreiber A, Lassalle‐Kaiser B, Faivre D, Scheffel A. 2017. Trace‐element incorporation into intracellular pools uncovers calcium‐pathways in a coccolithophore. Advanced Science (Weinh) 4: 1700088. [DOI] [PMC free article] [PubMed] [Google Scholar]
- Gerecht AC, Supraha L, Edvardsen B, Langer G, Henderiks J. 2015. Phosphorus availability modifies carbon production in Coccolithus pelagicus (Haptophyta). Journal of Experimental Marine Biology and Ecology 472: 24–31. [Google Scholar]
- Gerecht AC, Supraha L, Edvardsen B, Probert I, Henderiks J. 2014. High temperature decreases the PIC/POC ratio and increases phosphorus requirements in Coccolithus pelagicus (Haptophyta). Biogeosciences 11: 3531–3545. [Google Scholar]
- Gibbs SJ, Poulton AJ, Brown PR, Daniels CJ, Hopkins J, Young JR, Jones HL, Thiemann GJ, O'Dea SA, Newsam C. 2013. Species‐specific growth response of coccolithophores to Palaeocene–Eocene environmental change. Nature Geoscience 6: 5. [Google Scholar]
- Guillard RRL, Ryther JH. 1962. Studies of marine planktonic diatoms. Canadian Journal of Microbiology 8: 229–239. [DOI] [PubMed] [Google Scholar]
- Harris RP. 1994. Zooplankton grazing on the coccolithophore Emiliania huxleyi and its role in inorganic carbon flux. Marine Biology 119: 431–439. [Google Scholar]
- Harrison PJ, Waters RE, Taylor F. 1980. A broad spectrum artificial sea water medium for coastal and open ocean phytoplankton. Journal of Phycology 16: 28–35. [Google Scholar]
- Haug A. 1976. The influence of borate and calcium on the gel formation of a sulfated polysaccharide from Ulva lactuca . Acta Chemica Scandinavica. Series B: Organic Chemistry and Biochemistry 30: 562–566. [DOI] [PubMed] [Google Scholar]
- Heath CR, Leadbeater BCS, Callow ME. 1995. Effect of inhibitors on calcium carbonate deposition mediated by freshwater algae. Journal of Applied Phycology 7: 367–380. [Google Scholar]
- Herfort L, Loste E, Meldrum F, Thake B. 2004. Structural and physiological effects of calcium and magnesium in Emiliania huxleyi (Lohmann) Hay and Mohler. Journal of Structural Biology 148: 307–314. [DOI] [PubMed] [Google Scholar]
- Herfort L, Thake B, Roberts J. 2002. Acquisition and use of bicarbonate by Emiliania huxleyi . New Phytologist 156: 10. [DOI] [PubMed] [Google Scholar]
- Katagiri F, Takatsuka Y, Fujiwara S, Tsuzuki M. 2010. Effects of Ca and Mg on growth and calcification of the coccolithophorid Pleurochrysis haptonemofera: Ca requirement for cell division in coccolith‐bearing cells and for normal coccolith formation with acidic polysaccharides. Marine Biotechnology 12: 42–51. [DOI] [PubMed] [Google Scholar]
- Kegel JU, John U, Valentin K, Frickenhaus S. 2013. Genome variations associated with viral susceptibility and calcification in Emiliania huxleyi . PLoS ONE 8: e80684. [DOI] [PMC free article] [PubMed] [Google Scholar]
- Kirkwood, DS . 1989. Simultaneous determination of selected nutrients in sea water. International Council for the Exploration of the Sea (ICES), Copenhagen, CM 1989/C:29.
- Klaveness D. 1972. Coccolithus huxleyi (Lohmann) Kamptner: morphological investigations on the vegetative cell and the process of coccolith formation. Protistologica 8: 335–346. [Google Scholar]
- Krug SA, Schulz KG, Riebesell U. 2011. Effects of changes in carbonate chemistry speciation on Coccolithus braarudii: a discussion of coccolithophorid sensitivities. Biogeosciences 8: 771–777. [Google Scholar]
- Langer G, Geisen M, Baumann K‐H, Kläs J, Riebesell U, Thoms S, Young JR. 2006. Species‐specific responses of calcifying algae to changing seawater carbonate chemistry. Geochemistry, Geophysics, Geosystems 7: Q09006. [Google Scholar]
- Leonardos N, Read B, Thake B, Young JR. 2009. No mechanistic dependence of photosynthesis on calcification in the coccolithophorid Emiliania huxleyi (Haptophyta). Journal of Phycology 45: 1046–1051. [DOI] [PubMed] [Google Scholar]
- Mackinder L, Wheeler G, Schroeder D, von Dassow P, Riebesell U, Brownlee C. 2011. Expression of biomineralization‐related ion transport genes in Emiliania huxleyi . Environmental Microbiology 13: 3250–3265. [DOI] [PubMed] [Google Scholar]
- Marron AO, Chappell H, Ratcliffe S, Goldstein RE. 2016. A model for the effects of germanium on silica biomineralization in choanoflagellates. Journal of the Royal Society Interface 13: 20160485. [DOI] [PMC free article] [PubMed] [Google Scholar]
- Marsh ME. 2003. Regulation of CaCO3 formation in coccolithophores. Comparative Biochemistry and Physiology Part B: Biochemistry and Molecular Biology 136: 743–754. [DOI] [PubMed] [Google Scholar]
- Marsh ME. 2004. Biomineralization in coccolithophores In: Bäuerlein E, ed. Biomineralization: from biology to biotechnology and medical application. Weinheim, Germany: Wiley‐VCH, 197–216. [Google Scholar]
- Marsh ME, Dickinson DP. 1997. Polyanion‐mediated mineralization — mineralization in coccolithophore (Pleurochrysis carterae) variants which do not express PS2, the most abundant and acidic mineral‐associated polyanion in wild‐type cells. Protoplasma 199: 9–17. [Google Scholar]
- Matoh T, Kobayashi M. 1998. Boron and calcium, essential inorganic constituents of pectic polysaccharides in higher plant cell walls. Journal of Plant Research 111: 179–190. [Google Scholar]
- Meyer J, Riebesell U. 2015. Reviews and syntheses: responses of coccolithophores to ocean acidification: a meta‐analysis. Biogeosciences 12: 1671–1682. [Google Scholar]
- Milliman JD. 1993. Production and accumulation of calcium carbonate in the ocean: budget of a nonsteady state. Global Biogeochemical Cycles 7: 927–957. [Google Scholar]
- Monteiro FM, Bach LT, Brownlee C, Bown P, Rickaby REM, Poulton AJ, Tyrrell T, Beaufort L, Dutkiewicz S, Gibbs S et al 2016. Why marine phytoplankton calcify. Science Advances 2: e1501822. [DOI] [PMC free article] [PubMed] [Google Scholar]
- Müller M, Schulz K, Riebesell U. 2010. Effects of long‐term high CO2 exposure on two species of coccolithophores. Biogeosciences 7: 1109–1116. [Google Scholar]
- Müller MN, Antia AN, LaRoche J. 2008. Influence of cell cycle phase on calcification in the coccolithophore Emiliania huxleyi . Limnology and Oceanography 53: 506–512. [Google Scholar]
- Müller MN, Barcelos e Ramos J, Schulz KG, Riebesell U, Kaźmierczak J, Gallo F, Mackinder L, Li Y, Nesterenko PN, Trull TW et al 2015. Phytoplankton calcification as an effective mechanism to alleviate cellular calcium poisoning. Biogeosciences 12: 6493–6501. [Google Scholar]
- Nanninga HJ, Tyrrell T. 1996. Importance of light for the formation of algal blooms by Emiliania huxleyi . Marine Ecology Progress Series 136: 195–203. [Google Scholar]
- Paasche E. 1998. Roles of nitrogen and phosphorus in coccolith formation in Emiliania huxleyi (Prymnesiophyceae). European Journal of Phycology 33: 33–42. [Google Scholar]
- Paasche E. 2001. A review of the coccolithophorid Emiliania huxleyi (Prymnesiophyceae), with particular reference to growth, coccolith formation, and calcification–photosynthesis interactions. Phycologia 40: 503–529. [Google Scholar]
- Parke M, Adams I. 1960. The motile (Crystallolithus hyalinus Gaarder & Markali) and non‐motile phases in the life history of Coccolithus pelagicus (Wallich) Schiller. Journal of the Marine Biological Association of the United Kingdom 39: 263–274. [Google Scholar]
- Poulton AJ, Adey TR, Balch WM, Holligan PM. 2007. Relating coccolithophore calcification rates to phytoplankton community dynamics: regional differences and implications for carbon export. Deep Sea Research Part II: Topical Studies in Oceanography 54: 538–557. [Google Scholar]
- Read BA, Kegel J, Klute MJ, Kuo A, Lefebvre SC, Maumus F, Mayer C, Miller J, Monier A, Salamov A et al 2013. Pan genome of the phytoplankton Emiliania underpins its global distribution. Nature 499: 209–213. [DOI] [PubMed] [Google Scholar]
- Ridgwell A, Schmidt DN, Turley C, Brownlee C, Maldonado MT, Tortell P, Young JR. 2009. From laboratory manipulations to Earth system models: scaling calcification impacts of ocean acidification. Biogeosciences 6: 2611–2623. [Google Scholar]
- Riebesell U, Zondervan I, Rost B, Tortell PD, Zeebe RE, Morel FM. 2000. Reduced calcification of marine plankton in response to increased atmospheric CO2 . Nature 407: 4. [DOI] [PubMed] [Google Scholar]
- Rost B, Riebesell U. 2004. Coccolithophores and the biological pump: responses to environmental changes In: Thierstein H, Young JN, eds. Coccolithophores: from molecular processes to global impact. Berlin, Germany: Springer, 99–125. [Google Scholar]
- Sekino K, Shiraiwa Y. 1994. Accumulation and utilization of dissolved inorganic carbon by a marine unicellular coccolithophorid, Emiliania huxleyi . Plant and Cell Physiology 35: 353–361. [Google Scholar]
- Shiraiwa Y. 2003. Physiological regulation of carbon fixation in the photosynthesis and calcification of coccolithophorids. Comparative Biochemistry and Physiology Part B: Biochemistry and Molecular Biology 136: 775–783. [DOI] [PubMed] [Google Scholar]
- Sviben S, Gal A, Hood MA, Bertinetti L, Politi Y, Bennet M, Krishnamoorthy P, Schertel A, Wirth R, Sorrentino A et al 2016. A vacuole‐like compartment concentrates a disordered calcium phase in a key coccolithophorid alga. Nature Communications 7: 11228. [DOI] [PMC free article] [PubMed] [Google Scholar]
- Taylor AR, Brownlee C, Wheeler G. 2017. Coccolithophore cell biology: chalking up progress. Annual Review of Marine Science 9: 283–310. [DOI] [PubMed] [Google Scholar]
- Taylor AR, Russell MA, Harper GM, Collins, TfT , Brownlee, C . 2007. Dynamics of formation and secretion of heterococcoliths by Coccolithus pelagicus ssp. braarudii . European Journal of Phycology 42: 125–136. [Google Scholar]
- Thierstein HR, Geitzenauer KR, Molfino B, Shackleton NJ. 1977. Global synchroneity of late Quaternary coccolith datum levels. Validation by oxygen isotopes. Geology 5: 400. [Google Scholar]
- Timmermans KR, Veldhuis MJ, Brussaard CP. 2007. Cell death in three marine diatom species in response to different irradiance levels, silicate, or iron concentrations. Aquatic Microbial Ecology 46: 253–261. [Google Scholar]
- Trimborn S, Langer G, Rost B. 2007. Effect of varying calcium concentrations and light intensities on calcification and photosynthesis in Emiliania huxleyi . Limnology and Oceanography 52: 2285–2293. [Google Scholar]
- Tsutsui H, Takahashi K, Asahi H, Jordan RW, Nishida S, Nishiwaki N, Yamamoto S. 2016. Nineteen‐year time‐series sediment trap study of Coccolithus pelagicus and Emiliania huxleyi (calcareous nanoplankton) fluxes in the Bering Sea and subarctic Pacific Ocean. Deep Sea Research Part II: Topical Studies in Oceanography 125–126: 227–239. [Google Scholar]
- Tyrrell T, Merico A. 2004. Emiliania huxleyi: bloom observations and the conditions that induce them In: Thierstein H, Young J, eds. Coccolithophores. Berlin, Heidelberg, Germany: Springer, 75–97. [Google Scholar]
- Vaulot D, Olson RJ, Merkel S, Chisholm SW. 1987. Cell‐cycle response to nutrient starvation in 2 phytoplankton species, Thalassiosira weissflogii and Hymenomonas carterae . Marine Biology 95: 625–630. [Google Scholar]
- Westbroek P, Brown CW, Bleijswijk JV, Brownlee C, Brummer GJ, Conte M, Egge J, Fernández E, Jordan R, Knappertsbusch M et al 1993. A model system approach to biological climate forcing. The example of Emiliania huxleyi . Global and Planetary Change 8: 27–46. [Google Scholar]
- Wilson WH, Tarran GA, Schroeder D, Cox M, Oke J, Malin G. 2002. Isolation of viruses responsible for the demise of an Emiliania huxleyi bloom in the English Channel. Journal of the Marine Biological Association of the United Kingdom 82: 369–377. [Google Scholar]
- Xu J, Bach LT, Schulz KG, Zhao W, Gao K, Riebesell U. 2016. The role of coccoliths in protecting Emiliania huxleyi against stressful light and UV radiation. Biogeosciences 13: 4637–4643. [Google Scholar]
- Yamashiro H. 1995. The effects of HEBP, an inhibitor of mineral deposition, upon photosynthesis and calcification in the scleractinian coral, Stylophora pistillata . Journal of Experimental Marine Biology and Ecology 191: 57–63. [Google Scholar]
- Ziveri P, Baumann K‐H, Böckel B, Bollmann J, Young JR. 2004. Biogeography of selected Holocene coccoliths in the Atlantic Ocean In: Thierstein H, Young JN, eds. Coccolithophores: from molecular processes to global impact. Berlin, Germany: Springer, 403–428. [Google Scholar]
- Ziveri P, de Bernardi B, Baumann K‐H, Stoll HM, Mortyn PG. 2007. Sinking of coccolith carbonate and potential contribution to organic carbon ballasting in the deep ocean. Deep Sea Research Part II: Topical Studies in Oceanography 54: 659–675. [Google Scholar]
Associated Data
This section collects any data citations, data availability statements, or supplementary materials included in this article.
Supplementary Materials
Please note: Wiley Blackwell are not responsible for the content or functionality of any Supporting Information supplied by the authors. Any queries (other than missing material) should be directed to the New Phytologist Central Office.
Fig. S1 Images of internal malformed coccoliths.
Fig. S2 Images of silicon (Si)‐depleted cultures.
Fig. S3 Photosynthetic efficiency following disruption of calcification.
Fig. S4 Time‐lapse microscopy of cell division in Coccolithus braarudii.
Fig. S5 Cell division can occur in the absence of a coccosphere.
Fig. S6 Malformed coccolith production in germanium (Ge)‐treated cells.
Fig. S7 Germanium (Ge)‐treated cells exhibit a progressive disruption of the coccosphere as the cell volume increases.
Table S1 Disruption of calcification in Coccolithus braarudii by low Ca2+, HEDP or Ge, determined as the percentage of incomplete or malformed coccoliths in the coccosphere
Table S2 The calcification status of diploid coccolithophore strains in algal culture collections
Video S1 Cell division in Coccolithus braarudii.