

Abstract
Aim
To assess and compare the effect of small doses of fructose and allulose on postprandial blood glucose regulation in type 2 diabetes.
Methods
A double‐blind, multiple‐crossover, randomized, controlled, acute feeding, equivalence trial in 24 participants with type 2 diabetes was conducted. Each participant was randomly assigned six treatments separated by >1‐week washouts. Treatments consisted of fructose or allulose at 0 g (control), 5 g or 10 g added to a 75‐g glucose solution. A standard 75‐g oral glucose tolerance test protocol was followed with blood samples at −30, 0, 30, 60, 90 and 120 minutes. The primary outcome measure was plasma glucose incremental area under the curve (iAUC).
Results
Allulose significantly reduced plasma glucose iAUC by 8% at 10 g compared with 0 g (717.4 ± 38.3 vs. 777.5 ± 39.9 mmol × min/L, P = 0.015) with a linear dose response gradient between the reduction in plasma glucose iAUC and dose (P = 0.016). Allulose also significantly reduced several related secondary and exploratory outcome measures at 5 g (plasma glucose absolute mean and total AUC) and 10 g (plasma glucose absolute mean, absolute and incremental maximum concentration [Cmax], and total AUC) (P < .0125). There was no effect of fructose at any dose. Although allulose showed statistically significant reductions in plasma glucose iAUC compared with fructose at 5 g, 10 g and pooled doses, these reductions were within the pre‐specified equivalence margins of ±20%.
Conclusion
Allulose, but not fructose, led to modest reductions in the postprandial blood glucose response to oral glucose in individuals with type 2 diabetes. There is a need for long‐term randomized trials to confirm the sustainability of these improvements.
Keywords: clinical trial, dietary intervention, dose–response relationship, glucose, metabolism, type 2 diabetes, randomized trial
1. INTRODUCTION
Sugars have emerged as the dominant nutrient of concern in the epidemics of obesity and diabetes. The fructose moiety in particular has been implicated as a potent driver of type 2 diabetes due to its unique set of biochemical, metabolic and endocrine responses.1, 2
A less appreciated body of research suggests that small doses (≤ 10 g/meal) of fructose, at a level obtainable from fruit, may elicit a catalytic effect on hepatic glucose metabolism by increasing glycogen synthesis, as shown by 13C nuclear magnetic resonance (NMR) under euglycaemic conditions in people without diabetes3 and decreasing hepatic glucose output under hyperglycaemic clamp conditions in people with type 2 diabetes.4 Clinical translation of these findings has shown that small doses of fructose decrease the postprandial blood glucose response to oral glucose in people with5 and without type 2 diabetes.6 Under chronic feeding conditions, fructose, in exchange for other carbohydrates, has further been shown to decrease HbA1c in systematic reviews and meta‐analyses of controlled feeding trials.7, 8 This apparent benefit, however, is tempered by evidence that fructose providing excess calories has an adverse effect on body weight,9 fasting blood glucose levels and insulin sensitivity,8 fasting10, 11 and postprandial12 triglycerides, uric acid,13 and markers of non‐alcoholic fatty liver disease (NAFLD).14
Identifying low‐calorie alternatives to fructose that share its advantages without its adverse effects is of interest. Allulose is a low‐calorie (<0.2 kcal/g) C‐3 epimer of fructose found naturally in small amounts in dried fruits, brown sugar and maple syrup that shares many of its functional and sensory properties and is generally regarded as safe (GRAS) as a sugar substitute by the Food and Drug Administration (FDA).15, 16, 17, 18 It has shown similar catalytic effects on hepatic glucose metabolism in cultured hepatocytes19, 20 and animal models.21, 22 Small doses of allulose have also been shown to reduce the postprandial blood glucose response to high glycaemic index carbohydrate meals in people who are otherwise healthy23 or have prediabetes.24 Whether these effects of allulose are reproducible and are equivalent to those of fructose in people with type 2 diabetes is untested. The minimum dose at which improvements in glucose metabolism are observed also remains to be determined for both fructose and allulose in people with type 2 diabetes. The aim of this double‐blind, randomized, controlled, acute feeding equivalence trial was to assess and compare the effects of small catalytic doses (5, 10 g) of fructose and allulose on postprandial glucose regulation in response to a 75‐g oral glucose tolerance test (75‐g OGTT) in individuals with type 2 diabetes.
2. METHODS
2.1. Participants
Recruitment took place from November 2015 to July 2016. Participants were included in the study if they met the following eligibility criteria: aged 18 to 75 years, non‐pregnant, non‐smoker, BMI 18.5 to 35 kg/m2, well‐controlled type 2 diabetes (HbA1c ≤ 58 mmol/mol [7.5%]), on diet and/or antihyperglycaemic agents, not taking insulin, and free of other major illnesses. Eligible participants provided informed consent and received a financial reward for their participation. The study protocol was approved by the St. Michael's Hospital Ethics Review Board and registered on http://clinicaltrials.gov (NCT02459834).
2.2. Trial design
The trial followed a double‐blind, randomized, controlled, acute feeding, equivalence design with a ≥ 1‐week washout period. Sequence randomization of the six treatments was performed using a random sequence generator.25 The study statistician who performed this randomization was blinded to the identity of participants and did not have contact with the participants or the data. There were two levels of allocation concealment. First, the manufacturer of the treatments (Tate & Lyle Ingredients Americas LLC, Hoffman Estates, Illinois) provided unique codes for each of the six treatments. Second, the statistician who was blinded to the identity of these codes used the codes to label the packaging of the six treatments so that the treatments were only distinguishable by the participant number and the visit number to which they corresponded based on the randomization. The participants, study staff, investigators and outcome assessors were blinded to the identity of these treatment sequences. The two sets of blinding codes for each participant were not broken until all participants had completed the study and all analyses were completed.
2.3. Treatments
Participants received a total of six treatment drinks (provided and manufactured by Tate & Lyle Ingredients Americas LLC, Hoffman Estates, Illinois) in random order: two control drinks and four test drinks. Treatments consisted of fructose or allulose at 0 g (control), 5 g or 10 g added to a 75‐g glucose solution dissolved in 500 mL of water. The drinks were matched for appearance, sweetness, texture and packaging. Flavour and colour enhancements were used to mask any differences.
2.4. Protocol
The protocol followed the World Health Organization guidelines for the administration of an OGTT.26 This study was conducted in an outpatient setting at the Clinical Nutrition and Risk Factor Modification Centre in St. Michael's Hospital, Toronto, Canada. Participants arrived at the study centre on six separate mornings following a 10 to 12 hours overnight fast. They were instructed to consume a minimum of 150 g of carbohydrates each day over the 3 days prior to the study visit, and maintain their regular dietary, exercise, and medication patterns the evening before each study visit. Antihyperglycaemic medication use was discontinued on the morning of each study visit. To ensure that fasting blood glucose was similar on each day, participants provided a finger prick blood sample for the measurement of fasting blood glucose using a point of care glucometer (Contour®Next EZ blood glucose monitor, Bayer, New Jersey). If the fasting glucose value fell outside ±2 mmol/L of their initial screening value, or the average value of all previous study visits for those who had attended two or more visits, then participants were asked to return for another visit the following week.27 If fasting blood glucose was acceptable, a registered nurse inserted a catheter into a forearm vein; the catheter was secured by tape and kept patent by saline. Two samples were collected in the fasting state: one at −30 minutes and the other at 0 minutes. One of the six treatment drinks was then administered in random order with instructions to consume it at a constant rate over 5 minutes. Additional blood samples were drawn at 30, 60, 90 and 120 minutes after the start of the treatment.
2.5. Outcome measures
The pre‐specified primary outcome measure was the incremental area under the curve (iAUC) for plasma glucose. Pre‐specified secondary outcome measures included plasma insulin iAUC, plasma glucose and insulin absolute maximum concentrations (Cmax), time of maximum concentrations (Tmax), and mean incremental concentrations; the Matsuda whole body insulin sensitivity index (Matsuda ISIOGTT); and the early insulin secretion index (∆PI30–0/∆PG30–0). Exploratory outcome measures which were not pre‐specified included plasma glucose and insulin total AUC, incremental Cmax, and mean absolute concentrations; and the insulin secretion‐sensitivity index‐2 (ISSI‐2).
2.6. Plasma glucose and insulin analyses
Blood samples for glucose and insulin were collected in fluoride oxalate and EDTA tubes, respectively, with plasma separated by centrifuge and immediately frozen at –72°C. Mount Sinai Services Inc. performed analyses of plasma glucose using the hexokinase method28, 29 and plasma insulin using the electrochemiluminescence immunoassay.30
2.7. Calculations
Plasma glucose and insulin concentrations at −30 and 0 minutes were averaged to provide a single measurement of fasting glucose and fasting insulin. Total AUC and iAUC (which ignored values below the fasting value) were calculated geometrically using the trapezoidal rule for plasma glucose and insulin for each participant.31 The early insulin secretion index (∆PI30–0/∆PG30–0) is a measure of insulin secretion derived from the early period of the OGTT. It was calculated as the change in plasma insulin (PI) from 0 to 30 minutes divided by the change in plasma glucose (PG) over the same period.32 The Matsuda ISIOGTT is an OGTT‐derived measure of whole‐body insulin sensitivity that has been validated against the euglycaemic insulin clamp technique.33 It was calculated using the 75‐g OGTT PG and PI concentrations as follows: √ (fasting PG × fasting PI × mean PG × mean PI), where PG was expressed in mg/dL (1/18 mmol/L) and PI in μU/mL (6 pmol/L). ISSI‐2 is an OGTT‐derived measure of β‐cell function that has been validated against the disposition index from the frequently sampled intravenous glucose tolerance.34 It was calculated by taking the product of (1) insulin secretion as measured by the ratio of the total area‐under‐the‐insulin‐curve (AUCins) to the total area‐under‐the‐glucose curve (AUCglu), and (2) insulin sensitivity as measured by the Matsuda ISIOGTT. ISSI‐2 was calculated using SI units for AUCins, AUCglu and Matsuda ISIOGTT, such that ISSI‐2 = total AUCins/glu x Matsuda ISIOGTT.
2.8. Statistical analysis
Statistical analyses were performed using STATA 13.1 (StataCorp LP, College Station, Texas). Based on a 20% attrition rate, 25 participants were needed to achieve a final sample size of n = 20 to detect a difference in iAUC plasma glucose of 160 mmol × min/L (based on a 20% reduction from 800 mmol × min/L) assuming a standard deviation of 130 mmol × min/L with 90% power (1‐β = 90%).35 The sample size also provided 80% power (1‐β = 80%) to detect equivalence in the iAUC plasma glucose differences between fructose and allulose using margins of ±20% assuming a standard deviation of 16.25% (130/800 mmol × min/L*100%).36 The 20% difference and equivalence margins were based on the minimally important difference proposed by Health Canada to support postprandial blood glucose response reduction claims.36 Participants were excluded from analysis if fasting plasma glucose values at one or more study visits fell outside of the pre‐specified tolerance limit of ±2 mmol/L of the baseline fasting plasma glucose value (defined as the mean of all six study visits).
Separate analyses were conducted for fructose and allulose with the data averaged for the two controls (0 g) for comparisons with the two other doses (5, 10 g). Linear mixed‐effects models were used to assess differences in all outcome measures with unstructured covariance for repeated measures within subjects. Although it had been pre‐specified to use repeated measures of ANOVA with the Dunnett's test to adjust for the pairwise comparisons between each dose (5, 10 g) and the mean of the two controls (0 g) for fructose and allulose, linear mixed‐effects models were selected because they allowed for the handling of missing data, fitting of the correlation between repeated measures in the same subject, and modelling of time, sequence, and carryover effects.37, 38 The interactive effects of treatment and time (0, 30, 60, 90 and 120 minutes) on mean incremental changes in plasma glucose and insulin were assessed. Significant interactions were explored at individual time points. Linear dose–response relationships were assessed using a continuous exposure variable in the mixed‐effects model, while departures from linearity were assessed by comparing the linear dose model with the categorical dose model using a likelihood ratio test. Equivalence testing was conducted using the two one‐sided test (TOST) procedure by determining whether the upper and lower bounds of the 90% CI for the effect of allulose on iAUC for plasma glucose fell within the equivalence margins (± δ) set at ±20%.36 An equivalence test was chosen instead of a traditional comparative test to allow assessment of whether any differences between allulose and fructose were not just statistically significant but clinically significant based on the minimally important difference set by Health Canada to support postprandial blood glucose response reduction claims.36 Subgroup analyses were conducted using linear mixed‐effects models with interaction terms. Significance for the primary outcome measure was established at P < .05. To reduce the false discovery rate, secondary and exploratory outcome measures were evaluated at P < .0125. This alpha level was chosen by dividing α = 0.05/4 to adjust for the multiplicity of testing across the four broad domains of secondary and exploratory outcomes (glucose response, insulin response, insulin resistance and insulin secretion) within which results would be expected to be correlated. All data are presented as mean ± standard error of the mean (SEM), unless specified otherwise.
3. RESULTS
3.1. Flow of study participants
Figure S1 (see the supporting information for this article) shows the flow of study participants. Two hundred and thirty‐eight participants were assessed for eligibility, of whom 27 were randomized. Of these, 24 participants were included in the final analysis as two participants were unable to complete the trial due to work conflicts, and one participant was excluded from analysis due to fasting plasma glucose values at one or more study visits exceeding ±2 mmol/L of their average value from all six study visits.
3.2. Participants' characteristics
Table 1 details the participants' characteristics. Twenty‐four participants with type 2 diabetes (aged 66 ± 1.2 years; BMI 27.0 ± 0.9 kg/m2; diabetes duration 11.3 ± 1.7 years; HbA1c 50.0 ± 1.3 mmol/mol [6.7 ± 0.1%]) were analysed. Diabetes was managed with diet alone (n = 5), metformin (n = 8), or metformin plus a second‐line therapy (n = 11). Second‐line therapies included DPP‐4 inhibitors (n = 6), sulfonylureas (n = 3), thiazolidinediones (n = 1) and SGLT‐2 inhibitors (n = 1).
Table 1.
Participants' characteristics
| Characteristics | Type 2 diabetes |
|---|---|
| Sex, M/F | 12/12 |
| Age, years | 66 ± 1.2 |
| Weight, kg | 76.2 ± 3.7 |
| BMI, kg/m2 | 27.0 ± 0.9 |
| Diabetes duration, years | 11.3 ± 1.7 |
| HbA1c, % | 6.7 ± 0.1 |
| HbA1c, mmol/mol | 50.0 ± 1.3 |
| Fasting blood glucose, mmol/L | 6.9 ± 0.2 |
| Diabetes therapy | |
| Diet alone | 5 |
| Metformin only | 8 |
| Metformin + DPP‐4 inhibitor | 6 |
| Metformin + sulfonylurea | 3 |
| Metformin + thiazolidinedione | 1 |
| Metformin + SGLT‐2 inhibitor | 1 |
Data reported as mean ± SEM.
3.3. Primary outcome measure
Figures 1A and S4A show the effect of fructose at 0 g (control), 5 g and 10 g on the postprandial plasma glucose iAUC response to a 75‐g OGTT. Pairwise comparisons showed that fructose at 5 g and 10 g did not have a significant effect on the plasma glucose iAUC response (P > .05) compared with 0 g (control). No significant linear or non‐linear dose responses were identified (P > .05).
Figure 1.
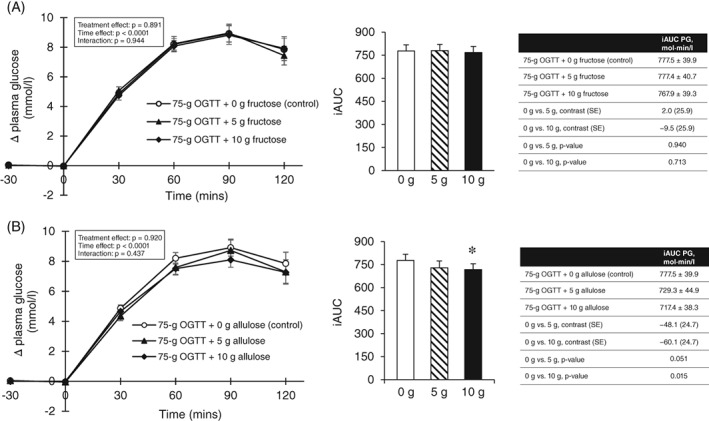
A, Effect of small doses of fructose on incremental change and incremental area under the curve (iAUC) for plasma glucose (PG) following consumption of 75‐g OGTT + 0 g fructose (control), 75‐g OGTT + 5 g fructose and 75‐g OGTT + 10 g fructose in 24 participants with type 2 diabetes. Mean fasting glucose concentrations were similar prior to consumption of 75‐g OGTT (control), 75‐g OGTT + 5 g fructose and 75‐g OGTT + 10 g fructose at 7.64 ± 0.25, 7.61 ± 0.27 and 7.49 ± 0.26 mmol/L, respectively (P > .05, linear mixed‐effects models); B, effect of small doses of allulose on incremental change and incremental area under the curve (iAUC) for PG following consumption of 75‐g OGTT + 0 g allulose (control), 75‐g OGTT + 5 g allulose and 75‐g OGTT + 10 g allulose in 24 participants with type 2 diabetes. Mean fasting glucose concentrations were similar prior to consumption of 75‐g OGTT (control), 75‐g OGTT + 5 g allulose and 75‐g OGTT + 10 g allulose at 7.64 ± 0.25, 7.39 ± 0.27 and 7.42 ± 0.29 mmol/L, respectively (P > .05, linear mixed‐effects models). *Represents a statistically significant difference (P < .05, linear mixed‐effects models) compared with control (0 g). Data reported as mean ± SEM
Figures 1B and S4B show the effect of allulose at 0 g (control), 5 g and 10 g on the postprandial plasma glucose iAUC response to a 75‐g OGTT. Pairwise comparisons showed that allulose at 10 g significantly reduced the plasma glucose iAUC response to the 75‐g OGTT by 8% compared with 0 g (control) (717.4 ± 38.3 vs. 777.5 ± 39.9 mmol × min/L, P = 0.015), while the 5‐g dose was of borderline significance (P = 0.051). A significant linear dose response gradient was shown between the reduction in plasma glucose iAUC and dose (P = 0.016). No significant non‐linear dose threshold was identified (P > .05).
3.4. Secondary and exploratory outcome measures
Figures 2A and S5–7 and Table S1 show the effect of fructose at 0 g (control), 5 g and 10 g on the 75‐g OGTT derived secondary and exploratory outcome measures. Pairwise comparisons did not show a significant effect of fructose and no significant linear or non‐linear dose responses were identified for any of the secondary or exploratory outcome measures (P > .0125).
Figure 2.
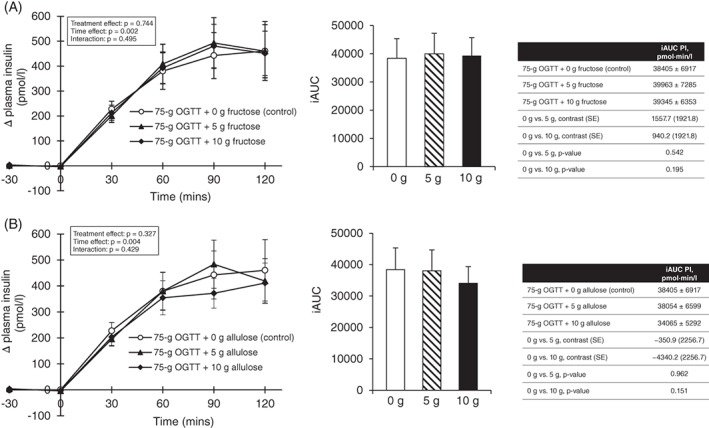
A, Effect of small doses of fructose on incremental change and incremental area under the curve (iAUC) for plasma insulin (PI) following consumption of 75‐g OGTT + 0 g fructose (control), 75‐g OGTT + 5 g fructose and 75‐g OGTT + 10 g fructose in 24 participants with type 2 diabetes. Mean fasting insulin concentrations were similar prior to consumption of 75‐g OGTT + 0 g fructose (control), 75‐g OGTT + 5 g fructose and 75‐g OGTT + 10 g fructose at 79.4 ± 12.1, 82.7 ± 12.9 and 81.4 ± 10.0 pmol/L, respectively (P > .05, linear mixed‐effects models); B, effect of small doses of allulose on incremental change and incremental area under the curve (iAUC) for PI following consumption of 75‐g OGTT + 0 g allulose (control), 75‐g OGTT + 5 g allulose and 75‐g OGTT + 10 g allulose in 24 participants with type 2 diabetes. Mean fasting insulin concentrations were similar prior to consumption of 75‐g OGTT + 0 g allulose (control), 75‐g OGTT + 5 g allulose and 75‐g OGTT + 10 g allulose at 79.4 ± 12.1, 80.6 ± 11.9 and 74.1 ± 8.7, respectively (P > .05, linear mixed‐effects models). *Represents a statistically significant difference (P < .0125, linear mixed‐effects models) compared with control (0 g). p‐values correspond to log‐transformed data due to non‐normal distribution of residuals. Data reported as mean ± SEM
Figures 2B and S8–10 and Table S2 show the effect of allulose at 0 g (control), 5 g and 10 g on the 75‐g OGTT derived secondary and exploratory outcome measures. Pairwise comparisons showed that allulose significantly reduced plasma glucose absolute mean (13.0 ± 0.6 vs. 13.6 ± 0.5 mmol/L, P = 0.002) and total AUC (1615.7 ± 67.6 vs. 1694.1 ± 57.8 mmol × min/L, P = 0.003) at 5 g, and plasma glucose absolute mean (12.9 ± 0.5 vs. 13.6 ± 0.5 mmol/L, P = 0.001), absolute (16.1 ± 0.7 vs. 17.5 ± 0.6 mmol/L, P < .001) and incremental (8.7 ± 0.5 vs. 9.8 ± 0.5 mmol/L, P < .001) Cmax and total AUC (1607.7 ± 59.3 vs. 1694.1 ± 57.8 mmol × min/L) at 10 g compared with 0 g (control) (P < .0125). A significant linear dose response gradient was shown for plasma glucose absolute (P < .0001) and incremental (P < .0001) Cmax, total AUC (P = 0.002) and absolute mean (P = 0.001). No significant non‐linear dose thresholds were identified (P > .0125).
3.5. Equivalence assessment
Figure 3 shows results of the equivalence test comparing the effect of allulose with fructose on iAUC for plasma glucose. Although allulose showed statistically significant reductions compared with fructose at 5 g (MD = −7.47% [90% CI: −13.02% to −1.93%]), 10 g (MD = −7.36% [90% CI: −14.32% to −0.40%] and pooled doses (MD = −7.42% [90% CI: −11.91% to −2.92%]), these reductions were within the pre‐specified equivalence margins of ±20%.
Figure 3.
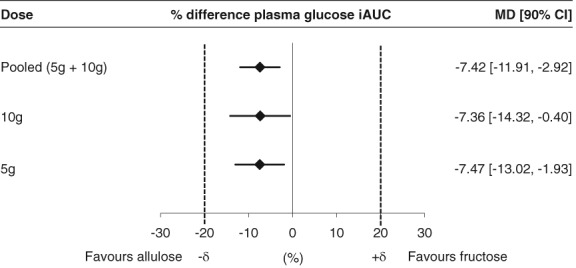
Equivalence assessment comparing the effect of allulose with fructose on plasma glucose incremental area under the curve (iAUC); % difference plasma glucose iAUC = [(alluloseiAUCglucose/controliAUCglucose) – (fructoseiAUCglucose/controliAUCglucose)] × 100%. Equivalence margins (+δ, −δ) were set at −20%, +20%. If the 90% CIs completely fell within the equivalence margins, then allulose was considered equivalent to fructose. If either the upper or lower bound of the 90% CI fell outside the equivalence margins, then the assessment was considered inconclusive. If the 90% CIs fell either completely above or completely below the equivalence margins, then allulose was considered inferior or superior to fructose, respectively
3.6. Subgroup analyses
Figures S11 and S12 show the subgroup analyses of the pooled effect of fructose and allulose, respectively, on plasma glucose iAUC compared to control (0 g). Self‐reported ethnicity was a significant effect modifier of the effect of fructose (P = 0.02), and baseline 2 h‐plasma glucose (2hPG) during the 75‐g OGTT (P = 0.02) and type of background diabetes therapy (P = 0.03) were significant effect modifiers of the effect of allulose.
3.7. Side effects
Most participants tolerated the treatments well. There was one report of nausea and one report of a slight headache following consumption of the 75‐g OGTT + 10 g fructose, which subsided by the end of the study visit.
4. DISCUSSION
4.1. Summary of findings
A double‐blind, randomized, controlled, acute feeding, equivalence trial of the effect of small catalytic doses (5 g and 10 g) of fructose and allulose on postprandial blood glucose regulation in response to oral glucose based on a 75‐g OGTT in individuals with well‐controlled type 2 diabetes was conducted. The 10‐g dose of allulose resulted in a modest lowering in the postprandial blood glucose response to oral glucose with a linear dose–response gradient over 0–10 g. There was no effect on measures of insulin resistance or secretion. The 5‐g and 10‐g doses of fructose did not have a significant effect on any outcome measures of postprandial blood glucose regulation. Although allulose significantly reduced the postprandial blood glucose response at 5 g, 10 g and pooled doses when compared with fructose, these reductions were within the pre‐specified equivalence margins of ±20%.
4.2. Findings in the context of previous literature
The presence of a catalytic effect with fructose in decreasing the postprandial blood glucose response to a glucose load was not shown. It was previously shown that 7.5 g fructose significantly reduced the 3‐h plasma glucose iAUC response to a 75‐g oral glucose load by 14% in individuals with type 2 diabetes.5 This study was unable to reproduce those findings with 5 g and 10 g fructose. Potential sources of discrepancy between the previous trial and the current trial include: follow‐up duration (3 vs. 2 hours), sample size (n = 5 vs. n = 24), handling of medications (discontinued 5 days prior to treatment vs. on the morning of the treatment), participant age (42 ± 5 years vs. 66 ± 1.2 years), participant BMI (42 ± 4 kg/m2 vs. 27 ± 0.9 kg/m2) and HbA1c (8.5 ± 0.5% vs. 6.7 ± 0.1%). In a study conducted in 11 healthy participants, 7.5 g fructose reduced the iAUC plasma glucose response by 19% to a 75‐g oral glucose challenge.6 However, a follow‐up study which assessed the timing of fructose administration in 31 healthy participants failed to show postprandial blood glucose reduction when 10 g fructose was consumed with an instant mashed potato meal (50 g available carbohydrate). Instead, postprandial blood glucose reductions of 25% and 27% were observed only when fructose was consumed 60 or 30 minutes prior to the meal load, respectively.39 It could be possible that although a catalytic effect from fructose was not observed in the current trial, fructose administration prior to (instead of with) the 75‐g oral glucose challenge may reduce the postprandial blood glucose response in individuals with type 2 diabetes.
A catalytic effect of allulose was confirmed in decreasing the postprandial blood glucose response to oral glucose, particularly in individuals with poorer glucose tolerance (75‐g OGTT 2‐h PG ≥ 11.1 mmol/L). A study in 20 healthy subjects found that 5 g and 7.5 g allulose reduced the postprandial blood glucose response by ~22% and ~32%, and insulinaemic response by ~28% and ~31%, respectively, to a 75‐g maltodextrin challenge.23 In a separate study, when 11 healthy participants consumed 5 g allulose‐sweetened tea with a standard meal load, no significant differences were found in postprandial glucose and insulin responses when compared to consumption of the same meal load with 10 mg aspartame‐sweetened tea.24 However, in the same study, when 15 participants with prediabetes were analysed, 5 g allulose‐sweetened tea resulted in ~14% reduction in postprandial blood glucose response to the standard meal load compared with aspartame‐sweetened tea.
4.3. Potential mechanism of action
The mechanism by which allulose reduces the postprandial blood glucose response to an oral glucose load is unclear. One possibility is enhanced glucose‐stimulated insulin secretion by allulose. This mechanism was not supported by the trial's data as allulose failed to show a significant effect on plasma insulin iAUC responses, the insulin secretion index (∆PI30–0/∆PG30–0), or the ISSI‐2.
Another possibility is reduced intestinal absorption of glucose in the presence of allulose. Glucose and allulose pass through different transporters (SGLT1 and GLUT2, respectively) as they move from the intestinal lumen to the apical membrane of the enterocyte. However, they utilize the same transporter (GLUT2) as they pass from the basolateral membrane of the enterocyte to the portal circulation.40 It has been suggested that allulose may competitively inhibit the transport of glucose at the basolateral GLUT2 transporter. Support for this hypothesis is provided from experiments conducted in Caco‐2 monolayer cell lines where the addition of 30 mM allulose to 30 mM glucose reduced glucose permeability by 60%.41 No studies have been conducted in humans to confirm this mechanism.
There has also been some suggestion that allulose may reduce the postprandial blood glucose response by enhancing hepatic glucose uptake. Hepatic glucokinase activity is decreased in some individuals with type 2 diabetes.42, 43 Phosphorylation of glucose by glucokinase is a rate‐determining step in hepatic glucose metabolism. Glucokinase is inhibited by glucokinase regulatory protein (GKRP), and this action is enhanced in the presence of fructose‐6‐phosphate. Under fasting conditions, hepatic glucokinase is localized primarily in the nucleus, where it is bound to the glucokinase regulatory protein (GKRP) and fructose‐6‐phosphate. In the postprandial state (presence of allulose and glucose), allulose is phosphorylated to allulose‐1‐phosphate by an enzyme called ketohexokinase. Allulose‐1‐phosphate competes with fructose‐6‐phosphate from GKRP. This enables the liberated and activated glucokinase to translocate from the nucleus to the cytosol, where it can drive hepatic glucose uptake, promote glycogen synthesis, suppress hepatic glucose output and reduce plasma glucose levels.40 In support of this hypothesis, immunohistochemical analyses in allulose‐fed rats have shown induction of glucokinase translocation from the nucleus to the cytoplasm and an increased amount of hepatic glycogen content after glucose loading.22, 44 No studies have been conducted in humans to confirm this mechanism.
4.4. Implications
The implications of these findings are that allulose may be a useful substitute for sugars, especially when consumed as part of high glycaemic index carbohydrate foods. Allulose tastes ~70% as sweet as sucrose and contains 90% fewer calories. When consumed alone, allulose does not raise blood glucose and insulin levels in healthy individuals.23 The current study, along with a previous study in participants with prediabetes, has shown that the addition of small doses of allulose also helps to lower the postprandial blood glucose response to high glycaemic index carbohydrate meals (i.e. 75‐g OGTT or standard Japanese meal) by ~8% to 14%.24 This decrease is modest when compared to an oral antihyperglycaemic agent such as acarbose, which has shown reductions of ~31% to 58% on postprandial glycaemia when administered with a meal load.45, 46
4.5. Strengths and limitations
This acute trial had several strengths. These included the randomized double‐blind controlled design, which provides the best protection against bias; a crossover design, which allows each participant to act as their own control thus reducing between‐subject variation; a reliable estimate of fasting glucose and insulin based on the mean of two fasting samples at −30 and 0 minutes; and a reliable estimate of the comparator based on the mean of two separate controls (0 g).
This acute trial also had several limitations. First, the 2 hours duration of the OGTTs may not have been long enough to detect meaningful differences in postprandial glucose and insulin responses, as individuals with type 2 diabetes typically return to baseline after 3 hours or longer.47, 48, 49 Second, the trial was not designed to examine the mechanism(s) by which allulose reduced the postprandial blood glucose response to an oral glucose load. Third, although a significant linear dose response for allulose was found, the doses examined may have been too few or insufficient to detect dose–response gradients or thresholds. Finally, the acute design of the trial creates uncertainty as to whether the reductions in the postprandial blood glucose response seen with allulose will manifest as sustainable improvements in glycaemic control (i.e. HbA1c) over the long term.
In conclusion, it was shown that allulose, but not fructose, modestly reduced the postprandial blood glucose response to an oral glucose load, showing a linear dose response gradient over 0 to 10 g in individuals with type 2 diabetes. There is a need for long‐term randomized trials to confirm whether these acute reductions in postprandial blood glucose will lead to sustainable improvements in glycaemic control.
Supporting information
Table S1. Effect of small doses (5 g, 10 g) of fructose on secondary and exploratory outcome measures
Table S2. Effect of small doses (5 g, 10 g) of Allulose on secondary and exploratory outcome measures
Figure S1. CONSORT flow of participants diagram
Figure S2. A, Effect of small doses of fructose on absolute plasma glucose following consumption of 75 g‐OGTT +0 g fructose (control), 75 g‐OGTT +5 g fructose and 75 g‐OGTT +10 g fructose in 24 participants with type 2 diabetes. Mean fasting glucose concentrations were similar prior to consumption of 75 g‐OGTT (control), 75 g‐OGTT +5 g fructose and 75 g‐OGTT +10 g fructose at 7.64 ± 0.25, 7.61 ± 0.27 and 7.49 ± 0.26 mmol/L, respectively (P > .05, linear mixed‐effects models). B, Effect of small doses of allulose on absolute plasma glucose following consumption of 75 g‐OGTT +0 g allulose (control), 75 g‐OGTT +5 g allulose and 75 g‐OGTT +10 g allulose in 24 participants with type 2 diabetes. Mean fasting glucose concentrations were similar prior to consumption of 75 g‐OGTT (control), 75 g‐OGTT +5 g allulose and 75 g‐OGTT +10 g allulose at 7.64 ± 0.25, 7.39 ± 0.27 and 7.42 ± 0.29 mmol/L, respectively (P > .05, linear mixed‐effects models). *represents a statistically significant difference (P < .05, linear mixed‐effects models) compared with control (0 g). Data reported as mean ± SEM.
Figure S3. A, Effect of small doses of fructose on absolute plasma insulin following consumption of 75 g‐OGTT+ 0 g fructose (control), 75 g‐OGTT +5 g fructose and 75 g‐OGTT +10 g fructose in 24 participants with type 2 diabetes. Mean fasting insulin concentrations were similar prior to consumption of 75 g‐OGTT +0 g fructose (control), 75 g‐OGTT +5 g fructose and 75 g‐OGTT +10 g fructose at 79.4 ± 12.1, 82.7 ± 12.9 and 81.4 ± 10.0 pmol/L, respectively (P > .05, linear mixed‐effects models). B, Effect of small doses of allulose on absolute plasma insulin following consumption of 75 g‐OGTT +0 g allulose (control), 75 g‐OGTT +5 g allulose and 75 g‐OGTT +10 g allulose in 24 participants with type 2 diabetes. Mean fasting insulin concentrations were similar prior to consumption of 75 g‐OGTT +0 g allulose (control), 75 g‐OGTT +5 g allulose and 75 g‐OGTT +10 g allulose at 79.4 ± 12.1, 80.6 ± 11.9 and 74.1 ± 8.7, respectively (P > .05, linear mixed‐effects models). *represents a statistically significant difference (P < .0125, linear mixed‐effects models) compared with control (0 g). P‐values correspond to log‐transformed data due to non‐normal distribution of residuals. Data reported as mean ± SEM.
Figure S4. A, Linear (left) and non‐linear dose–response (right) analysis of the effect of small doses of fructose on plasma glucose iAUC. B, Linear (left) and non‐linear (right) dose–response analysis of the effect of small doses of allulose on plasma glucose iAUC. In the linear dose–response graphs, the middle black line represents the predicted linear trend, while the two grey lines represent the 95% CIs. In the non‐linear dose–response graphs, the middle black line represents the mean, while the two grey lines represent the 95% CIs. *P < .05 indicates a significant dose–response relationship.
Figure S5. Linear (left) and non‐linear (right) dose–response analysis of the effect of small doses of fructose on absolute Cmax glucose (A), Tmax glucose (B), mean incremental glucose (C), insulin iAUC (D), absolute Cmax insulin (E) and Tmax insulin (F). In the linear dose–response graphs, the middle black line represents the predicted linear trend, while the two grey lines represent the 95% CIs. In the non‐linear dose–response graphs, the middle black line represents the mean, while the two grey lines represent the 95% CIs. *P < .0125 indicates a significant dose–response relationship. †p‐values correspond to log‐transformed data due to non‐normal distribution of residuals.
Figure S6. Linear (left) and non‐linear (right) dose–response analysis of the effect of small doses of fructose on mean incremental insulin (A), Early Insulin Secretion Index (∆PI30–0/∆PG30–0) (B), Matsuda Insulin Sensitivity IndexOGTT (C), total AUC glucose (D), incremental Cmax glucose (E) and absolute mean glucose (F). For ∆PI30–0/∆PG30–0, figures were generated using data from 23 participants due to one participant visit value being negative which generated a missing value when log‐transformed. in the linear dose–response graphs, the middle black line represents the predicted linear trend, while the two grey lines represent the 95% CIs. In the non‐linear dose–response graphs, the middle black line represents the mean, while the two grey lines represent the 95% CIs. *P < .0125 indicates a significant dose–response relationship. †p‐values correspond to log‐transformed data due to non‐normal distribution of residuals.
Figure S7. Linear (left) and non‐linear (right) dose–response analysis of the effect of small doses of fructose on total AUC insulin (A), incremental Cmax insulin (B), absolute mean insulin (C) and Insulin Secretion‐Sensitivity Index‐2 (ISSI‐2) (D). In the linear dose–response graphs, the middle black line represents the predicted linear trend, while the two grey lines represent the 95% CIs. In the non‐linear dose–response graphs, the middle black line represents the mean, while the two grey lines represent the 95% CIs. *P < .0125 indicates a significant dose–response relationship. †p‐values correspond to log‐transformed data due to non‐normal distribution of residuals.
Figure S8. Linear (left) and non‐linear (right) dose–response analysis of the effect of small doses of allulose on absolute Cmax glucose (A), Tmax glucose (B), mean incremental glucose (C), insulin iAUC (D), absolute Cmax insulin (E) and Tmax insulin (F). In the linear dose–response graphs, the middle black line represents the predicted linear trend, while the two grey lines represent the 95% CIs. In the non‐linear dose–response graphs, the middle black line represents the mean, while the two grey lines represent the 95% CIs. *P < .0125 indicates a significant dose–response relationship. †p‐values correspond to log‐transformed data due to non‐normal distribution of residuals.
Figure S9. Linear (left) and non‐linear (right) dose–response analysis of the effect of small doses of allulose on mean incremental insulin (A), Early Insulin Secretion Index (∆PI30–0/∆PG30–0) (B), Matsuda Insulin Sensitivity IndexOGTT (C), total AUC glucose (D), incremental Cmax glucose (E) and absolute mean glucose (F). In the linear dose–response graphs, the middle black line represents the predicted linear trend, while the two grey lines represent the 95% CIs. In the non‐linear dose–response graphs, the middle black line represents the mean, while the two grey lines represent the 95% CIs. *P < .0125 indicates a significant dose–response relationship. †p‐values correspond to log‐transformed data due to non‐normal distribution of residuals.
Figure S10. Linear (left) and non‐linear (right) dose–response analysis of the effect of small doses of allulose on total AUC insulin (A), incremental Cmax insulin (B), absolute mean insulin (C) and Insulin Secretion‐Sensitivity Index‐2 (ISSI‐2) (D). In the linear dose–response graphs, the middle black line represents the predicted linear trend, while the two grey lines represent the 95% CIs. In the non‐linear dose–response graphs, the middle black line represents the mean, while the two grey lines represent the 95% CIs. *P < .0125 indicates a significant dose–response relationship. †p‐values correspond to log‐transformed data due to non‐normal distribution of residuals.
Figure S11. Subgroup analysis of the effect of pooled doses of fructose on plasma glucose incremental area under the curve (iAUC) compared with control. For each subgroup, the diamonds represent the effect size and the solid lines represent the 95% CI. The dashed line represents the overall effect size. Linear mixed‐effects models with interactions terms were used to identify significant effect modifiers. *P < .05 was considered significant (red). **BMI categories were assessed using ethnic specific cut‐offs for normal weight, overweight, and obesity: 18.5–22.9 kg/m2, 23–27.5 kg/m2 and > 27.5 kg/m2 respectively for Asian individuals, and 18.5–24.9 kg/m2, 25–29.9 kg/m2, and ≥ 30 kg/m2 respectively for other individuals (reference: Hsu et al, Diabetes Care; 38 (1): pgs. 150–158). FPG, fasting plasma glucose; FPI, fasting plasma insulin; HOMA‐IR, homeostatic model assessment‐insulin resistance; 2 h‐OGTT PG, 2‐hour oral glucose tolerance test plasma glucose
Figure S12. Subgroup analysis of the effect of pooled doses of allulose on plasma glucose incremental area under the curve (iAUC) compared with control. For each subgroup, the diamonds represent the effect size and the solid lines represent the 95% CI. The dashed line represents the overall effect size. Linear mixed‐effects models with interactions terms were used to identify significant effect modifiers. *P < .05 was considered significant (red). **BMI categories were assessed using ethnic specific cut‐offs for normal weight, overweight, and obesity: 18.5–22.9 kg/m2, 23–27.5 kg/m2 and > 27.5 kg/m2 respectively for Asian individuals, and 18.5–24.9 kg/m2, 25–29.9 kg/m2, and ≥ 30 kg/m2 respectively for other individuals (reference: Hsu et al, Diabetes Care; 38 (1): pgs. 150–158). FPG, fasting plasma glucose; FPI, fasting plasma insulin; HOMA‐IR, homeostatic model assessment‐insulin resistance; 2 h‐OGTT PG, 2‐hour oral glucose tolerance test plasma glucose
ACKNOWLEDGMENTS
The authors thank the study participants, Bonnie Kennedy (Registered Nurse) for her help in obtaining the blood samples, Jack St. Clair for his help in processing the blood samples, and Mount Sinai Services Inc. for analysing the plasma samples for glucose and insulin.
Conflict of interest
C. W. C. K. has received research support from the Advanced Foods and Material Network, Agrifoods and Agriculture Canada, the Almond Board of California, the American Pistachio Growers, Barilla, the California Strawberry Commission, the Calorie Control Council, CIHR, the Canola Council of Canada, the Coca‐Cola Company (investigator initiated, unrestricted grant), Hain Celestial, the International Tree Nut Council Nutrition Research and Education Foundation, Kellogg, Kraft, Loblaw Companies Ltd., Orafti, Pulse Canada, Saskatchewan Pulse Growers, Solae and Unilever. He has received travel funding, consultant fees and/or honoraria from Abbott Laboratories, the Almond Board of California, the American Peanut Council, the American Pistachio Growers, Barilla, Bayer, the Canola Council of Canada, the Coca‐Cola Company, Danone, General Mills, the International Tree Nut Council Nutrition Research and Education Foundation, Kellogg, Loblaw Companies Ltd., the Nutrition Foundation of Italy, Oldways Preservation Trust, Orafti, Paramount Farms, the Peanut Institute, PepsiCo, Pulse Canada, Sabra Dipping Co., Saskatchewan Pulse Growers, Solae, Sun‐Maid, Tate and Lyle, and Unilever. He is on the Dietary Guidelines Committee for the Diabetes Nutrition Study Group of the European Association for the Study of Diabetes and has served on the scientific advisory board for the Almond Board of California, the International Tree Nut Council, Oldways Preservation Trust, Paramount Farms and Pulse Canada. T. M. S. W. is a part owner and the President of Glycemic Index Laboratories, Inc., Toronto, Canada, and has authored several popular diet books on the glycaemic index for which he has received royalties from Phillipa Sandall Publishing Services and CABI Publishers. He has received consultant fees, honoraria, travel funding, or research support from or served on the scientific advisory board for CIHR, Diabetes Canada, Dairy Farmers of Canada, McCain Foods, Temasek Polytechnic, Northwestern University, Royal Society of London, Glycemic Index Symbol program, CreaNutrition AG, McMaster University, Canadian Society for Nutritional Sciences, National Sports and Conditioning Association, Faculty of Public Health and Nutrition—Autonomous University of Nuevo Leon, Diabetes and Nutrition Study Group (DNSG) of the European Association for the Study of Diabetes (EASD). J. L. S. has received research support from the Canadian Institutes of health Research (CIHR), Diabetes Canada, PSI Foundation, Banting and Best Diabetes Centre (BBDC), Canadian Nutrition Society (CNS), American Society for Nutrition (ASN), INC International Nut and Dried Fruit Council Foundation, National Dried Fruit Trade Association, The Tate and Lyle Nutritional Research Fund at the University of Toronto, The Glycemic Control and Cardiovascular Disease in Type 2 Diabetes Fund at the University of Toronto (a fund established by the Alberta Pulse Growers), and the Nutrition Trialists Fund at the University of Toronto (a fund established by the Calorie Control Council). He has received in‐kind research support from the Almond Board of California, California Walnut Commission, American Peanut Council, Barilla, Unilever, Unico, Primo, Loblaw Companies, Quaker (Pepsico), Kellogg Canada, and WhiteWave Foods. He has received travel support, speaker fees and/or honoraria from Diabetes Canada, Canadian Nutrition Society (CNS), Mott's LLP, Dairy Farmers of Canada, Sprim Brasil, WhiteWave Foods, Rippe Lifestyle, mdBriefcase, Alberta Milk, FoodMinds LLC, Memac Ogilvy & Mather LLC, PepsiCo, The Ginger Network LLC, International Sweeteners Association, Nestlé Nutrition Institute, Pulse Canada, Canadian Society for Endocrinology and Metabolism (CSEM), Barilla Centre for Food and Nutrition (BCFN) Foundation, and GI Foundation. He has ad hoc consulting arrangements with Winston & Strawn LLP, Perkins Coie LLP, and Tate & Lyle. He is a member of the European Fruit Juice Association Scientific Expert Panel. He is on the Clinical Practice Guidelines Expert Committees of Diabetes Canada, European Association for the study of Diabetes (EASD), Canadian Cardiovascular Society (CCS), and Canadian Obesity Network. He serves as an unpaid scientific advisor for the Food, Nutrition, and Safety Program (FNSP) and the Technical Committee on Carbohydrates of the International Life Science Institute (ILSI) North America. He is a member of the International Carbohydrate Quality Consortium (ICQC), Executive Board Member of the Diabetes and Nutrition Study Group (DNSG) of the EASD, and Director of the Toronto 3D Knowledge Synthesis and Clinical Trials foundation. His wife is an employee of Unilever Canada. No competing interests were declared by J. C. N., C. R. B., A. K. G., T. A. K., E. V., R. N., S. B. M. and L. A. L.
Author contributions
Each author had full access to all the data in the study and takes responsibility for the integrity of the data and the accuracy of the data analysis. Study concept and design: J. L. S. Acquisition, analysis and interpretation of the data: J. C. N., C. R. B., A. K. G., T. A. K., E. V., S. B. M., R. N., C. W. C. K., T. M. S. W., L. A. L. and J. L. S. Writing of the manuscript: J. C. N. and J. L. S. Critical revision of the manuscript for important intellectual content: all authors. Statistical analysis: J. C. N. and T. A. K. Study guarantor: J. L. S.
Noronha JC, Braunstein CR, Glenn AJ, et al. The effect of small doses of fructose and allulose on postprandial glucose metabolism in type 2 diabetes: A double‐blind, randomized, controlled, acute feeding, equivalence trial. Diabetes Obes Metab. 2018;20:2361–2370. 10.1111/dom.13374
Funding information This work was funded by the Tate and Lyle Nutritional Research Fund at the University of Toronto (a fund established by Tate & Lyle Ingredients Americas LLC, Hoffman Estates, IL, USA). J. C. N. was supported by a Fredrick Banting and Charles Best Canada Graduate Scholarship (Canadian Institutes of Health Research), Novo Nordisk Studentship (Banting & Best Diabetes Centre) and Toronto 3D Internship Award. C. R. B. was supported by a Fredrick Banting and Charles Best Canada Graduate Scholarship (Canadian Institutes of Health Research) and Toronto 3D Internship Award. E. V. was supported by a Toronto 3D Internship Award. J. L. S. was supported by a PSI Graham Farquharson Knowledge Translation Fellowship, Diabetes Canada Clinician Scientist award, CIHR INMD/CNS New Investigator Partnership Prize, and Banting & Best Diabetes Centre Sun Life Financial New Investigator Award. Tate & Lyle Ingredients Americas LLC contributed to the design of the study but did not participate in the conduct of the study; collection, management, analysis, and interpretation of the data; and preparation, review, approval of the manuscript or decision to publish. None of the other sponsors had a role in any aspect of the present study, including design and conduct of the study; collection, management, analysis, and interpretation of the data; and preparation, review, approval of the manuscript or decision to publish.
REFERENCES
- 1. Lustig RH, Schmidt LA, Brindis CD. Public health: the toxic truth about sugar. Nature. 2012;482:27‐29. [DOI] [PubMed] [Google Scholar]
- 2. DiNicolantonio JJ, O'Keefe JH, Lucan SC. Added fructose: a principal driver of type 2 diabetes mellitus and its consequences. Mayo Clin Proc. 2015;90:372‐381. [DOI] [PubMed] [Google Scholar]
- 3. Petersen KF, Laurent D, Yu C, Cline GW, Shulman GI. Stimulating effects of low‐dose fructose on insulin‐stimulated hepatic glycogen synthesis in humans. Diabetes. 2001;50:1263‐1268. [DOI] [PubMed] [Google Scholar]
- 4. Hawkins M, Gabriely I, Wozniak R, Vilcu C, Shamoon H, Rossetti L. Fructose improves the ability of hyperglycemia per se to regulate glucose production in type 2 diabetes. Diabetes. 2002;51:606, 614. [DOI] [PubMed] [Google Scholar]
- 5. Moore MC, Davis SN, Mann SL, Cherrington AD. Acute fructose administration improves oral glucose tolerance in adults with type 2 diabetes. Diabetes Care. 2001;24:1882‐1887. [DOI] [PubMed] [Google Scholar]
- 6. Moore MC, Cherrington AD, Mann SL, Davis SN. Acute fructose administration decreases the glycemic response to an oral glucose tolerance test in normal adults. J Clin Endocrinol Metab. 2000;85:4515‐4519. [DOI] [PubMed] [Google Scholar]
- 7. Sievenpiper JL, Chiavaroli L, de Souza RJ, et al. 'Catalytic' doses of fructose may benefit glycaemic control without harming cardiometabolic risk factors: a small meta‐analysis of randomised controlled feeding trials. Br J Nutr. 2012;108:418‐423. [DOI] [PMC free article] [PubMed] [Google Scholar]
- 8. Cozma AI, Sievenpiper JL, de Souza RJ, et al. Effect of fructose on glycemic control in diabetes: a systematic review and meta‐analysis of controlled feeding trials. Diabetes Care. 2012;35:1611‐1620. [DOI] [PMC free article] [PubMed] [Google Scholar]
- 9. Sievenpiper JL, de Souza RJ, Mirrahimi A, et al. Effect of fructose on body weight in controlled feeding trials: a systematic review and meta‐analysis. Ann Intern Med. 2012;156:291‐304. [DOI] [PubMed] [Google Scholar]
- 10. Chiavaroli L, de Souza RJ, Ha V, et al. Effect of fructose on established lipid targets: a systematic review and meta‐analysis of controlled feeding trials. J Am Heart Assoc. 2015;4:e001700. [DOI] [PMC free article] [PubMed] [Google Scholar]
- 11. Sievenpiper JL, Carleton AJ, Chatha S, et al. Heterogeneous effects of fructose on blood lipids in individuals with type 2 diabetes: systematic review and meta‐analysis of experimental trials in humans. Diabetes Care. 2009;32:1930‐1937. [DOI] [PMC free article] [PubMed] [Google Scholar]
- 12. David Wang D, Sievenpiper JL, de Souza RJ, et al. Effect of fructose on postprandial triglycerides: a systematic review and meta‐analysis of controlled feeding trials. Atherosclerosis. 2014;232:125‐133. [DOI] [PubMed] [Google Scholar]
- 13. Wang DD, Sievenpiper JL, de Souza RJ, et al. The effects of fructose intake on serum uric acid vary among controlled dietary trials. J Nutr. 2012;142:916‐923. [DOI] [PMC free article] [PubMed] [Google Scholar]
- 14. Chiu S, Sievenpiper JL, de Souza RJ, et al. Effect of fructose on markers of non‐alcoholic fatty liver disease (NAFLD): a systematic review and meta‐analysis of controlled feeding trials. Eur J Clin Nutr. 2014;68:416‐423. [DOI] [PMC free article] [PubMed] [Google Scholar]
- 15. Oshima H, Kimura I, Izumori K. Psicose contents in various food products and its origin. Food Sci Technol Res. 2006;12:137‐143. [Google Scholar]
- 16. U.S. Food and Drug Administration . GRAS Notice (GRN) for D‐Psicose No. 693. https://www.accessdata.fda.gov/scripts/fdcc/index.cfm?set=GRASNotices&id=693&sort=GRN_No&order=DESC&startrow=1&type=basic&search=psicose. 2017. Accessed December 16, 2017.
- 17. U.S. Food and Drug Administration . GRAS Notice (GRN) for D‐Psicose No. 498. https://www.accessdata.fda.gov/scripts/fdcc/index.cfm?set=GRASNotices&id=498&sort=GRN_No&order=DESC&startrow=1&type=basic&search=psicose. 2014. Accessed July 14, 2016.
- 18. U.S. Food and Drug Administration . GRAS Notice (GRN) for D‐Psicose No. 400. URL: https://www.accessdata.fda.gov/scripts/fdcc/index.cfm?set=GRASNotices&id=400&sort=GRN_No&order=DESC&startrow=1&type=basic&search=psicose. 2012. Accessed July 14, 2016.
- 19. Detheux M, Vandercammen A, Van Schaftingen E. Effectors of the regulatory protein acting on liver glucokinase: a kinetic investigation. Eur J Biochem. 1991;200:553‐561. [DOI] [PubMed] [Google Scholar]
- 20. Vandercammen A, Detheux M, Van Schaftingen E. Binding of sorbitol 6‐phosphate and of fructose 1‐phosphate to the regulatory protein of liver glucokinase. Biochem J. 1992;286(Pt 1):253‐256. [DOI] [PMC free article] [PubMed] [Google Scholar]
- 21. Toyoda Y, Mori S, Umemura N, et al. Suppression of blood glucose levels by D‐psicose in glucose tolerance test in diabetic rats. Jpn Pharmacol Ther. 2010;38:261‐269. [Google Scholar]
- 22. Hossain MA, Kitagaki S, Nakano D, et al. Rare sugar D‐psicose improves insulin sensitivity and glucose tolerance in type 2 diabetes Otsuka Long‐Evans Tokushima Fatty (OLETF) rats. Biochem Biophys Res Commun. 2011;405:7‐12. [DOI] [PubMed] [Google Scholar]
- 23. Iida T, Kishimoto Y, Yoshikawa Y, et al. Acute D‐psicose administration decreases the glycemic responses to an oral maltodextrin tolerance test in normal adults. J Nutr Sci Vitaminol (Tokyo). 2008;54:511‐514. [DOI] [PubMed] [Google Scholar]
- 24. Hayashi N, Iida T, Yamada T, et al. Study on the postprandial blood glucose suppression effect of D‐psicose in borderline diabetes and the safety of long‐term ingestion by normal human subjects. Biosci Biotechnol Biochem. 2010;74:510‐519. [DOI] [PubMed] [Google Scholar]
- 25. Urbaniak GC, Plous S. Research Randomizer (Version 4.0) [Computer software]; 2013. http://www.randomizer.org/. Accessed August 3, 2015.
- 26. World Health Organization Study Group . Diabetes Mellitus: Report of a WHO Study Group. Geneva: World Health Organization; 1985:99. [PubMed] [Google Scholar]
- 27. Wolever TMS. Determining the GI of Foods ‐ Methodological Considerations. Glycaemic Index: A Physiological Classification of Dietary Carbohydrate. Wallingford, UK: CABI; 2006:32. [Google Scholar]
- 28. Peterson JI, Young DS. Evaluation of the hexokinase‐glucose‐6‐phosphate dehydrogenase method of determination of glucose in urine. Anal Biochem. 1968;23:301‐316. [DOI] [PubMed] [Google Scholar]
- 29. Schmidt FH. Enzymatic determination of glucose and fructose simultaneously. Klin Wochenschr. 1961;39:1244‐1247. [DOI] [PubMed] [Google Scholar]
- 30. Livesey JH, Hodgkinson SC, Roud HR, Donald RA. Effect of time, temperature and freezing on the stability of immunoreactive LH, FSH, TSH, growth hormone, prolactin and insulin in plasma. Clin Biochem. 1980;13:151‐155. [DOI] [PubMed] [Google Scholar]
- 31. Wolever TM, Jenkins DJ, Jenkins AL, Josse RG. The glycemic index: methodology and clinical implications. Am J Clin Nutr. 1991;54:846‐854. [DOI] [PubMed] [Google Scholar]
- 32. Phillips DI, Clark PM, Hales CN, Osmond C. Understanding oral glucose tolerance: comparison of glucose or insulin measurements during the oral glucose tolerance test with specific measurements of insulin resistance and insulin secretion. Diabet Med. 1994;11:286‐292. [DOI] [PubMed] [Google Scholar]
- 33. Matsuda M, DeFronzo RA. Insulin sensitivity indices obtained from oral glucose tolerance testing: comparison with the euglycemic insulin clamp. Diabetes Care. 1999;22:1462‐1470. [DOI] [PubMed] [Google Scholar]
- 34. Kramer CK, Choi H, Zinman B, Retnakaran R. Glycemic variability in patients with early type 2 diabetes: the impact of improvement in beta‐cell function. Diabetes Care. 2014;37:1116‐1123. [DOI] [PubMed] [Google Scholar]
- 35. Sievenpiper JL, Jenkins DJ, Josse RG, Vuksan V. Dilution of the 75‐g oral glucose tolerance test increases postprandial glycemia: implications for diagnostic criteria. CMAJ. 2000;162:993‐996. [PMC free article] [PubMed] [Google Scholar]
- 36. Bureau of Nutritional Sciences , Food Directorate, Health Products and Food Branch, Health Canada. 2013. Draft Guidance Document on Food Health Claims Related to the Reduction in Post‐Prandial Glycaemic Response. https://chfa.ca/images/uploads/2012/08/Post-Prandial-Glycaemic-Response-Draft-Guidance.pdf. Accessed March 17, 2015.
- 37. Williams JD. A multiple regression approach to multiple comparisons for comparing several treatments with a control. J Exp Educ. 1971;39:93‐96. [Google Scholar]
- 38. Detry MA, Ma Y. Analyzing repeated measurements using mixed models. JAMA. 2016;315:407‐408. [DOI] [PubMed] [Google Scholar]
- 39. Heacock PM, Hertzler SR, Wolf BW. Fructose prefeeding reduces the glycemic response to a high‐glycemic index, starchy food in humans. J Nutr. 2002;132:2601‐2604. [DOI] [PubMed] [Google Scholar]
- 40. Hossain A, Yamaguchi F, Matsuo T, et al. Rare sugar D‐allulose: potential role and therapeutic monitoring in maintaining obesity and type 2 diabetes mellitus. Pharmacol Ther. 2015;155:49‐59. [DOI] [PubMed] [Google Scholar]
- 41. Hishiike T, Ogawa M, Hayakawa S, et al. Transepithelial transports of rare sugar D‐psicose in human intestine. J Agric Food Chem. 2013;61:7381‐7386. [DOI] [PubMed] [Google Scholar]
- 42. Caro JF, Triester S, Patel VK, Tapscott EB, Frazier NL, Dohm GL. Liver glucokinase: decreased activity in patients with type II diabetes. Horm Metab Res. 1995;27:19‐22. [DOI] [PubMed] [Google Scholar]
- 43. Rizza RA. Pathogenesis of fasting and postprandial hyperglycemia in type 2 diabetes: implications for therapy. Diabetes. 2010;59:2697‐2707. [DOI] [PMC free article] [PubMed] [Google Scholar]
- 44. Shintani T, Yamada T, Hayashi N, et al. Rare sugar syrup containing d‐Allulose but not high‐fructose corn syrup maintains glucose tolerance and insulin sensitivity partly via hepatic glucokinase translocation in Wistar rats. J Agric Food Chem. 2017;65:2888‐2894. [DOI] [PubMed] [Google Scholar]
- 45. Shimabukuro M, Higa N, Chinen I, Yamakawa K, Takasu N. Effects of a single administration of acarbose on postprandial glucose excursion and endothelial dysfunction in type 2 diabetic patients: a randomized crossover study. J Clin Endocrinol Metab. 2006;91:837‐842. [DOI] [PubMed] [Google Scholar]
- 46. Wachters‐Hagedoorn RE, Priebe MG, Heimweg JA, et al. Low‐dose acarbose does not delay digestion of starch but reduces its bioavailability. Diabet Med. 2007;24:600‐606. [DOI] [PubMed] [Google Scholar]
- 47. Butler PC, Rizza RA. Contribution to postprandial hyperglycemia and effect on initial splanchnic glucose clearance of hepatic glucose cycling in glucose‐intolerant or NIDDM patients. Diabetes. 1991;40:73‐81. [PubMed] [Google Scholar]
- 48. Reaven GM, Chen Y‐DI, Coulston AM, et al. Insulin secretion and action in noninsulin‐dependent diabetes mellitus: is insulin resistance secondary to hypoinsulinemia? Am J Med. 1983;75:85‐93. [DOI] [PubMed] [Google Scholar]
- 49. Perley M, Kipnis DM. Plasma insulin responses to glucose and tolbutamide of normal weight and obese diabetic and nondiabetic subjects. Diabetes. 1966;15:867‐874. [DOI] [PubMed] [Google Scholar]
Associated Data
This section collects any data citations, data availability statements, or supplementary materials included in this article.
Supplementary Materials
Table S1. Effect of small doses (5 g, 10 g) of fructose on secondary and exploratory outcome measures
Table S2. Effect of small doses (5 g, 10 g) of Allulose on secondary and exploratory outcome measures
Figure S1. CONSORT flow of participants diagram
Figure S2. A, Effect of small doses of fructose on absolute plasma glucose following consumption of 75 g‐OGTT +0 g fructose (control), 75 g‐OGTT +5 g fructose and 75 g‐OGTT +10 g fructose in 24 participants with type 2 diabetes. Mean fasting glucose concentrations were similar prior to consumption of 75 g‐OGTT (control), 75 g‐OGTT +5 g fructose and 75 g‐OGTT +10 g fructose at 7.64 ± 0.25, 7.61 ± 0.27 and 7.49 ± 0.26 mmol/L, respectively (P > .05, linear mixed‐effects models). B, Effect of small doses of allulose on absolute plasma glucose following consumption of 75 g‐OGTT +0 g allulose (control), 75 g‐OGTT +5 g allulose and 75 g‐OGTT +10 g allulose in 24 participants with type 2 diabetes. Mean fasting glucose concentrations were similar prior to consumption of 75 g‐OGTT (control), 75 g‐OGTT +5 g allulose and 75 g‐OGTT +10 g allulose at 7.64 ± 0.25, 7.39 ± 0.27 and 7.42 ± 0.29 mmol/L, respectively (P > .05, linear mixed‐effects models). *represents a statistically significant difference (P < .05, linear mixed‐effects models) compared with control (0 g). Data reported as mean ± SEM.
Figure S3. A, Effect of small doses of fructose on absolute plasma insulin following consumption of 75 g‐OGTT+ 0 g fructose (control), 75 g‐OGTT +5 g fructose and 75 g‐OGTT +10 g fructose in 24 participants with type 2 diabetes. Mean fasting insulin concentrations were similar prior to consumption of 75 g‐OGTT +0 g fructose (control), 75 g‐OGTT +5 g fructose and 75 g‐OGTT +10 g fructose at 79.4 ± 12.1, 82.7 ± 12.9 and 81.4 ± 10.0 pmol/L, respectively (P > .05, linear mixed‐effects models). B, Effect of small doses of allulose on absolute plasma insulin following consumption of 75 g‐OGTT +0 g allulose (control), 75 g‐OGTT +5 g allulose and 75 g‐OGTT +10 g allulose in 24 participants with type 2 diabetes. Mean fasting insulin concentrations were similar prior to consumption of 75 g‐OGTT +0 g allulose (control), 75 g‐OGTT +5 g allulose and 75 g‐OGTT +10 g allulose at 79.4 ± 12.1, 80.6 ± 11.9 and 74.1 ± 8.7, respectively (P > .05, linear mixed‐effects models). *represents a statistically significant difference (P < .0125, linear mixed‐effects models) compared with control (0 g). P‐values correspond to log‐transformed data due to non‐normal distribution of residuals. Data reported as mean ± SEM.
Figure S4. A, Linear (left) and non‐linear dose–response (right) analysis of the effect of small doses of fructose on plasma glucose iAUC. B, Linear (left) and non‐linear (right) dose–response analysis of the effect of small doses of allulose on plasma glucose iAUC. In the linear dose–response graphs, the middle black line represents the predicted linear trend, while the two grey lines represent the 95% CIs. In the non‐linear dose–response graphs, the middle black line represents the mean, while the two grey lines represent the 95% CIs. *P < .05 indicates a significant dose–response relationship.
Figure S5. Linear (left) and non‐linear (right) dose–response analysis of the effect of small doses of fructose on absolute Cmax glucose (A), Tmax glucose (B), mean incremental glucose (C), insulin iAUC (D), absolute Cmax insulin (E) and Tmax insulin (F). In the linear dose–response graphs, the middle black line represents the predicted linear trend, while the two grey lines represent the 95% CIs. In the non‐linear dose–response graphs, the middle black line represents the mean, while the two grey lines represent the 95% CIs. *P < .0125 indicates a significant dose–response relationship. †p‐values correspond to log‐transformed data due to non‐normal distribution of residuals.
Figure S6. Linear (left) and non‐linear (right) dose–response analysis of the effect of small doses of fructose on mean incremental insulin (A), Early Insulin Secretion Index (∆PI30–0/∆PG30–0) (B), Matsuda Insulin Sensitivity IndexOGTT (C), total AUC glucose (D), incremental Cmax glucose (E) and absolute mean glucose (F). For ∆PI30–0/∆PG30–0, figures were generated using data from 23 participants due to one participant visit value being negative which generated a missing value when log‐transformed. in the linear dose–response graphs, the middle black line represents the predicted linear trend, while the two grey lines represent the 95% CIs. In the non‐linear dose–response graphs, the middle black line represents the mean, while the two grey lines represent the 95% CIs. *P < .0125 indicates a significant dose–response relationship. †p‐values correspond to log‐transformed data due to non‐normal distribution of residuals.
Figure S7. Linear (left) and non‐linear (right) dose–response analysis of the effect of small doses of fructose on total AUC insulin (A), incremental Cmax insulin (B), absolute mean insulin (C) and Insulin Secretion‐Sensitivity Index‐2 (ISSI‐2) (D). In the linear dose–response graphs, the middle black line represents the predicted linear trend, while the two grey lines represent the 95% CIs. In the non‐linear dose–response graphs, the middle black line represents the mean, while the two grey lines represent the 95% CIs. *P < .0125 indicates a significant dose–response relationship. †p‐values correspond to log‐transformed data due to non‐normal distribution of residuals.
Figure S8. Linear (left) and non‐linear (right) dose–response analysis of the effect of small doses of allulose on absolute Cmax glucose (A), Tmax glucose (B), mean incremental glucose (C), insulin iAUC (D), absolute Cmax insulin (E) and Tmax insulin (F). In the linear dose–response graphs, the middle black line represents the predicted linear trend, while the two grey lines represent the 95% CIs. In the non‐linear dose–response graphs, the middle black line represents the mean, while the two grey lines represent the 95% CIs. *P < .0125 indicates a significant dose–response relationship. †p‐values correspond to log‐transformed data due to non‐normal distribution of residuals.
Figure S9. Linear (left) and non‐linear (right) dose–response analysis of the effect of small doses of allulose on mean incremental insulin (A), Early Insulin Secretion Index (∆PI30–0/∆PG30–0) (B), Matsuda Insulin Sensitivity IndexOGTT (C), total AUC glucose (D), incremental Cmax glucose (E) and absolute mean glucose (F). In the linear dose–response graphs, the middle black line represents the predicted linear trend, while the two grey lines represent the 95% CIs. In the non‐linear dose–response graphs, the middle black line represents the mean, while the two grey lines represent the 95% CIs. *P < .0125 indicates a significant dose–response relationship. †p‐values correspond to log‐transformed data due to non‐normal distribution of residuals.
Figure S10. Linear (left) and non‐linear (right) dose–response analysis of the effect of small doses of allulose on total AUC insulin (A), incremental Cmax insulin (B), absolute mean insulin (C) and Insulin Secretion‐Sensitivity Index‐2 (ISSI‐2) (D). In the linear dose–response graphs, the middle black line represents the predicted linear trend, while the two grey lines represent the 95% CIs. In the non‐linear dose–response graphs, the middle black line represents the mean, while the two grey lines represent the 95% CIs. *P < .0125 indicates a significant dose–response relationship. †p‐values correspond to log‐transformed data due to non‐normal distribution of residuals.
Figure S11. Subgroup analysis of the effect of pooled doses of fructose on plasma glucose incremental area under the curve (iAUC) compared with control. For each subgroup, the diamonds represent the effect size and the solid lines represent the 95% CI. The dashed line represents the overall effect size. Linear mixed‐effects models with interactions terms were used to identify significant effect modifiers. *P < .05 was considered significant (red). **BMI categories were assessed using ethnic specific cut‐offs for normal weight, overweight, and obesity: 18.5–22.9 kg/m2, 23–27.5 kg/m2 and > 27.5 kg/m2 respectively for Asian individuals, and 18.5–24.9 kg/m2, 25–29.9 kg/m2, and ≥ 30 kg/m2 respectively for other individuals (reference: Hsu et al, Diabetes Care; 38 (1): pgs. 150–158). FPG, fasting plasma glucose; FPI, fasting plasma insulin; HOMA‐IR, homeostatic model assessment‐insulin resistance; 2 h‐OGTT PG, 2‐hour oral glucose tolerance test plasma glucose
Figure S12. Subgroup analysis of the effect of pooled doses of allulose on plasma glucose incremental area under the curve (iAUC) compared with control. For each subgroup, the diamonds represent the effect size and the solid lines represent the 95% CI. The dashed line represents the overall effect size. Linear mixed‐effects models with interactions terms were used to identify significant effect modifiers. *P < .05 was considered significant (red). **BMI categories were assessed using ethnic specific cut‐offs for normal weight, overweight, and obesity: 18.5–22.9 kg/m2, 23–27.5 kg/m2 and > 27.5 kg/m2 respectively for Asian individuals, and 18.5–24.9 kg/m2, 25–29.9 kg/m2, and ≥ 30 kg/m2 respectively for other individuals (reference: Hsu et al, Diabetes Care; 38 (1): pgs. 150–158). FPG, fasting plasma glucose; FPI, fasting plasma insulin; HOMA‐IR, homeostatic model assessment‐insulin resistance; 2 h‐OGTT PG, 2‐hour oral glucose tolerance test plasma glucose