

Abstract
Soft‐shelled turtles (Pelodiscus sinensis) are widely distributed in some Asian countries, and we previously reported that soft‐shelled turtle tissue could be a useful material for collagen. In the present study, we performed shotgun liquid chromatography (LC)/mass spectrometry (MS)‐based global proteomic analysis of collagen‐administered human keratinocytes to examine the functional effects of collagen from soft‐shelled turtle on human skin. Using a semiquantitative method based on spectral counting, we were able to successfully identify 187 proteins with expression levels that were changed more than twofold by the administration of collagen from soft‐shelled turtle. Based on Gene Ontology analysis, the functions of these proteins closely correlated with cell–cell adhesion. In addition, epithelial–mesenchymal transition was induced by the administration of collagen from soft‐shelled turtle through the down‐regulation of E‐cadherin expression. Moreover, collagen‐administered keratinocytes significantly facilitated wound healing compared with nontreated cells in an in vitro scratch wound healing assay. These findings suggest that collagen from soft‐shelled turtle provides significant benefits for skin wound healing and may be a useful material for pharmaceuticals and medical care products. © 2017 The Authors Journal of Biomedical Materials Research Part B: Applied Biomaterials Published by Wiley Periodicals, Inc. J Biomed Mater Res Part B: Appl Biomater, 106B: 2403–2413, 2018.
Keywords: collagen, soft‐shelled turtle, E‐cadherin, epithelial–mesenchymal transition, wound healing
INTRODUCTION
Collagen is a ubiquitous structural protein in both invertebrates and vertebrates, comprising >20 different types based on the function in each tissue.1, 2 These proteins are involved in the formation of fibrillar and microfibrillar networks of extracellular matrix and basement membranes to maintain the extracellular matrix environment.3, 4, 5, 6, 7 Recent reports have demonstrated that collagen is able to interact with several cell surface receptors and regulate cell proliferation or apoptosis.8, 9 In addition, collagen is used for skin substitutes and drug delivery.10, 11, 12, 13, 14, 15 Therefore, collagen is an important material for cosmetics, pharmaceuticals, and medical care products.
Most of the collagen presently in use is derived from bovine and porcine skin. However, allergic reactions and connective tissue disorders, such as arthritis and lupus, have been reported with the use of collagen from these animals.16 Moreover, these materials can potentially carry animal diseases, such as bovine spongiform encephalopathy and foot and mouth disease. Thus, these animals have been reconsidered as the main source for collagen products. In addition, many Muslims and Jews do not consume pig‐derived food products, and many Hindus do not consume cow‐derived products.17 Therefore, collagen of marine origin, such as fish, sponges, and mollusks, was recently considered as a useful alternative to mammalian sources because of its high availability.18, 19, 20, 21, 22, 23, 24, 25 In addition, we previously reported that soft‐shelled turtle (Pelodiscus sinensis) tissue could be a useful alternative for collagen.26 Recently, several reports demonstrated its usefulness,27, 28 making collagen from soft‐shelled turtle a useful material for cosmetics, pharmaceuticals, and medical care products.
However, collagen from soft‐shelled turtle may differ greatly from that of mammalian resources in regards to physicochemical properties, amino acid compositions, and physiological functions due to the difference in the habitat environment. Therefore, further research is needed before using collagen from soft‐shelled turtle as a source for collagen products. In the present study, we performed shotgun liquid chromatography (LC)/mass spectrometry (MS)‐based global proteomic analysis of collagen‐administered human keratinocytes to examine the functional effects of collagen from soft‐shelled turtle on human skin. We found that 187 proteins were differentially expressed in the collagen‐administered keratinocytes compared with nontreated cells, and these proteins may be involved in wound healing in human skin.
MATERIALS AND METHODS
Chemicals
The chemicals used in this study were of the highest grade available and purchased from Wako Pure Chemical Industries (Osaka, Japan).
Turtles
Emperor tissue, a soft tissue in the region around the shell of soft‐shelled turtles (P. sinensis), was provided by Shin‐uoei (Osaka, Japan).
Collagen extraction
Collagen extraction was performed in accordance with the our previous study.26 Briefly, emperor tissue was treated with 0.1M formic acid at a ratio of 1:10 (w/v) for 24 h for demineralization. The sample was then treated with 0.1M sodium hydroxide (NaOH) at a ratio of 1:10 (w/v) for 3 days to remove noncollagenous proteins, including endogenous proteases. The NaOH solution was changed every day. Finally, the sample was incubated with 0.03M citric acid for 24 h. After incubation, the solution was centrifuged at 6500g for 20 min at 4°C and the supernatant collected as the collagen solution.
Cell culture
HaCaT immortalized human keratinocytes were purchased from CLS Cell Lines Service GmbH (Eppelheim, Germany). The cells were cultured in RPMI1640 medium supplemented with 10% fetal bovine serum (FBS) (Gibco, Carlsbad, CA, USA) in an atmosphere containing 5% CO2.
Cell growth assay
Cells were plated at a density of 5 × 10³ cells per well in a 96‐well plate and grown in culture medium. The next day, the medium was changed and cells grown in collagen‐containing culture medium. After 72 h, the cells were incubated with WST‐8 cell counting reagent (Wako) and the optical density of the culture solution in the plate measured using an ELISA plate reader.
Protein preparation
HaCaT cells were plated in a 60‐mm dish at a density of 2 × 10⁵ cells per dish and grown in culture medium. The next day, the medium was changed and the cells grown in collagen‐containing culture medium. After 72 h, the cells were solubilized in urea lysis buffer (7M urea, 2M thiourea, 5% CHAPS, 1% Triton X‐100). The protein concentration was measured using the Bradford method.
In‐solution trypsin digestion
A gel‐free digestion approach was performed in accordance a previously described protocol.29 Briefly, 10 μg of protein extract from each sample was reduced by the addition of 45 mM dithiothreitol and 20 mM tris(2‐carboxyethyl)phosphine, and then alkylated using 100 mM iodoacetic acid. After alkylation, the samples were digested with trypsin gold, mass spectrometry grade (Promega Corp., Madison, WI, USA) at 37°C for 24 h. Next, the digests were purified using PepClean C‐18 Spin Columns (Thermo, Rockford, IL, USA) according to the manufacturer's protocol.
LC–MS/MS analysis for protein identification
Peptide samples (∼2 μg) were injected into a peptide L‐trap column (Chemicals Evaluation and Research Institute, Tokyo, Japan) using an HTC PAL autosampler (CTC Analytics, Zwingen, Switzerland) and further separated through a Paradigm MS4 (AMR, Tokyo, Japan) using a reverse‐phase C18‐column (L‐column, 3 μm diameter gel particles and 120 Å pore size, 0.2 × 150 mm, Chemicals Evaluation and Research Institute). The mobile phase consisted of 0.1% formic acid in water as solution A and acetonitrile as solution B. The column flow rate was 1 μL/min with a concentration gradient of 5% B to 40% B over 120 min. Gradient‐eluted peptides were analyzed using an LTQ ion‐trap mass spectrometer (Thermo). The results were acquired in a data‐dependent manner in which MS/MS fragmentation was performed on the two most intense peaks of every full MS scan.
All MS/MS spectral data were searched against the SwissProt Homo Sapiens database using Mascot (version 2.4.01, Matrix Science, London, UK). The search criteria were set as follows: enzyme, trypsin; allowance of up to two missed cleavage peptides; mass tolerance ±2.0 Da and MS/MS tolerance ±0.8 Da; and modifications of cysteine carbamidomethylation and methionine oxidation.
Semiquantitative analysis of identified proteins
The fold changes in expressed proteins on a base 2 logarithmic scale were calculated using the Rsc based on spectral counting.30 Relative amounts of identified proteins were calculated using the normalized spectral abundance factor (NSAF).31 Differentially expressed proteins were chosen so that their Rsc was >1 or ≤1, which correspond to fold changes of >2 or <0.5.
Bioinformatics
Functional annotations for proteins identified to be regulated by collagen administration were processed using the Database for Annotation, Visualization, and Integrated Discovery (DAVID) version 6.8 (http://david.abcc.ncifcrf.gov/home.jsp).32, 33, 34
Western blot analysis
A total of 5 µg of cell extract was added to each well and subjected to SDS‐PAGE under reducing conditions. The separated proteins were transferred to polyvinylidene fluoride transfer membranes. Following blocking in TBS–Tween‐20 (0.1%) buffer with 5% skim milk for 2 h at room temperature, the membranes were incubated at 4°C overnight with an anti‐E‐cadherin antibody (1:5,000; Cell Signaling Technology, Beverly, MA), antivimentin antibody (1:1000; Cell Signaling Technology), or antisnail antibody (1:1000; Cell Signaling Technology). Next, the membranes were washed and incubated with HRP‐conjugated antirabbit IgG antibody (American Qualex, San Clemente, CA). Following washing, the blots were visualized using SuperSignal West Dura Extended Duration substrate (Thermo Fisher Scientific) and bands detected using the myECL Imager system (version 2.0; Thermo Fisher Scientific). Next, the same membranes were reprobed with an anti‐β‐actin antibody (Santa Cruz Biotechnology, Dallas, TX) to confirm equal loading of the proteins. All Western blot analyses were performed in triplicate.
Scratch assay
Cells were plated in 35 mm dishes (5 × 10⁵ cells/dish) and incubated for 24 h at 37°C in a humidified 5% CO2 atmosphere to assure confluency. The center of the monolayer was scratched by scraping the cells with a sterile 200‐μL pipette tip.35 After scratching, the dish was gently washed with PBS to remove the detached cells and the medium changed in collagen‐containing culture medium. A microscope system was used to take photographs from the scratch area 0 and 8 h after scratching (Olympus, Tokyo, Japan).
Statistical analysis
All data are presented as the mean ± standard error of the mean. The data were analyzed using one‐way analysis of variance followed by Dunnett's test or the unpaired t test. P < 0.01 was considered significant in all analyses. Computations were performed in GraphPad Prism version 5.1 (GraphPad Software, La Jolla, CA, USA).
RESULTS
Cytotoxicity of collagen against HaCaT cells
To examine the cytotoxic effect of collagen on HaCaT cells, we assessed the cell growth rate when cells were grown in culture medium containing the collagen solution at a concentration of 0.1–100 μg/mL. The growth rate of HaCaT cells cultured in the medium containing collagen was not inhibited at 72 h compared with nontreated cells (Fig. 1). Therefore, we used 100 μg/mL collagen in the following experiments.
Figure 1.
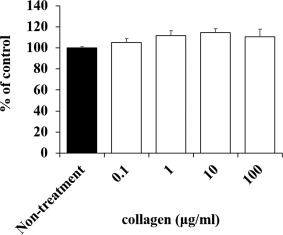
Cytotoxic effect of collagen administration in HaCaT cells. Suitable concentrations of collagen that are not cytotoxic to HaCaT cells were determined. No effect was observed on cell proliferation of HaCaT cells with collagen administration.
Protein identification and semiquantitative comparison of identified proteins in collagen‐administered HaCaT cells
To investigate the effect of collagen on the cells in the basal layer of the skin, we determined the molecular profile of proteins in HaCaT cells whose expression levels were regulated by collagen using shotgun proteomics. We performed a label‐free semiquantitative method based on spectral counting to determine the proteins whose expression levels were regulated by collagen. In Figure 2, each R sc value is plotted against the corresponding protein (X‐axis) in increasing order from left to right for proteins identified in collagen‐administered HaCaT cells (collagen) and nontreated cells (nontreatment). A positive value indicates increased expression in the collagen‐treated cells and a negative value decreased expression in the collagen‐treated cells. The NSAF value (Fig. 2, bar) was also plotted on the X‐axis for each corresponding protein with collagen treatment above the X‐axis and control below. Proteins with a high positive or negative R sc value would be candidates for proteins regulated by collagen.
Figure 2.
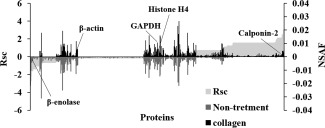
Semiquantitative comparison of identified proteins in collagen‐administered and nontreated HaCaT cells. R sc and normalized spectral abundance factor (NSAF) values calculated for identified proteins are on the X‐axis. Protein expression is compared for collagen versus control. Proteins highly expressed in either collagen‐administered cells or nontreated cells are near the right or left side of the X‐axis. Housekeeping proteins are located around the center of the X‐axis.
As a result of semiquantification, a total of 187 differentially expressed proteins were identified (Table 1). The expression levels of housekeeping proteins β‐actin, GAPDH, and histone H4 were not changed by collagen administration.
Table 1.
Differentially Expressed Proteins (>2‐fold) Upon Administration of Collagen
| No. | ID | Accession Number and Description | Number of Amino Acids |
Fold Change (R sc) |
|
|---|---|---|---|---|---|
| 1 | H2B1K_HUMAN | O60814 | Histone H2B type 1‐K | 126 | −3.690 |
| 2 | EF1A3_HUMAN | Q5VTE0 | Putative elongation factor 1‐alpha‐like 3 | 462 | −3.080 |
| 3 | H2B1M_HUMAN | Q99879 | Histone H2B type 1‐M | 126 | −2.698 |
| 4 | K2C3_HUMAN | P12035 | Keratin, type II cytoskeletal 3 | 628 | −2.178 |
| 5 | H2A1H_HUMAN | Q96KK5 | Histone H2A type 1‐H | 128 | −1.611 |
| 6 | RL10_HUMAN | P27635 | 60S ribosomal protein L10 | 214 | −1.611 |
| 7 | ARF3_HUMAN | P61204 | ADP‐ribosylation factor 3 | 181 | −1.611 |
| 8 | DYHC1_HUMAN | Q14204 | Cytoplasmic dynein 1 heavy chain 1 | 4646 | −1.477 |
| 9 | TBAL3_HUMAN | A6NHL2 | Tubulin alpha chain‐like 3 | 446 | −1.359 |
| 10 | ENOB_HUMAN | P13929 | Beta‐enolase | 434 | −1.359 |
| 11 | FLNB_HUMAN | O75369 | Filamin‐B | 2602 | −1.359 |
| 12 | PDLI1_HUMAN | O00151 | PDZ and LIM domain protein 1 | 329 | −1.359 |
| 13 | FLNA_HUMAN | P21333 | Filamin‐A | 2647 | −1.359 |
| 14 | MYH14_HUMAN | Q7Z406 | Myosin‐14 | 1995 | −1.359 |
| 15 | K2C80_HUMAN | Q6KB66 | Keratin, type II cytoskeletal 80 | 452 | −1.359 |
| 16 | K2C72_HUMAN | Q14CN4 | Keratin, type II cytoskeletal 72 | 511 | −1.053 |
| 17 | POTEF_HUMAN | A5A3E0 | POTE ankyrin domain family member F | 1075 | −1.053 |
| 18 | GDIA_HUMAN | P31150 | Rab GDP dissociation inhibitor alpha | 447 | −1.053 |
| 19 | RS27A_HUMAN | P62979 | Ubiquitin‐40S ribosomal protein S27a | 156 | −1.053 |
| 20 | CAH2_HUMAN | P00918 | Carbonic anhydrase 2 | 260 | −1.053 |
| 21 | SEPT9_HUMAN | Q9UHD8 | Septin‐9 | 586 | −1.053 |
| 22 | PRP8_HUMAN | Q6P2Q9 | Pre‐mRNA‐processing‐splicing factor 8 | 2335 | −1.053 |
| 23 | IMB1_HUMAN | Q14974 | Importin subunit beta‐1 | 876 | −1.053 |
| 24 | HS105_HUMAN | Q92598 | Heat shock protein 105 kDa | 858 | −1.053 |
| 25 | PLST_HUMAN | P13797 | Plastin‐3 | 630 | −1.053 |
| 26 | H2A1D_HUMAN | P20671 | Histone H2A type 1‐D | 130 | −1.036 |
| 27 | AL1A3_HUMAN | P47895 | Aldehyde dehydrogenase family 1 member A3 | 512 | 1.020 |
| 28 | HNRH1_HUMAN | P31943 | Heterogeneous nuclear ribonucleoprotein H | 449 | 1.102 |
| 29 | PEPL_HUMAN | O60437 | Periplakin | 1756 | 1.102 |
| 30 | LDHB_HUMAN | P07195 | l‐lactate dehydrogenase B chain | 334 | 1.102 |
| 31 | TPM4_HUMAN | P67936 | Tropomyosin alpha‐4 chain | 248 | 1.102 |
| 32 | 2AAA_HUMAN | P30153 | Serine/threonine‐protein phosphatase 2A 65 kDa regulatory subunit A alpha isoform | 589 | 1.102 |
| 33 | EZRI_HUMAN | P15311 | Ezrin | 586 | 1.102 |
| 34 | COR1C_HUMAN | Q9ULV4 | Coronin‐1C | 474 | 1.102 |
| 35 | SPTN1_HUMAN | Q13813 | Spectrin alpha chain, nonerythrocytic 1 | 2472 | 1.182 |
| 36 | H2AV_HUMAN | Q71UI9 | Histone H2A.V | 128 | 1.245 |
| 37 | ARP3_HUMAN | P61158 | Actin‐related protein 3 | 418 | 1.245 |
| 38 | TCPB_HUMAN | P78371 | T‐complex protein 1 subunit beta | 535 | 1.245 |
| 39 | AHSA1_HUMAN | O95433 | Activator of 90 kDa heat shock protein ATPase homolog 1 | 338 | 1.245 |
| 40 | KMT2A_HUMAN | Q03164 | Histone‐lysine N‐methyltransferase 2A | 3969 | 1.245 |
| 41 | SYLC_HUMAN | Q9P2J5 | Leucine‐tRNA ligase, cytoplasmic | 1176 | 1.245 |
| 42 | PGAM1_HUMAN | P18669 | Phosphoglycerate mutase 1 | 254 | 1.245 |
| 43 | ICAL_HUMAN | P20810 | Calpastatin | 708 | 1.245 |
| 44 | CISY_HUMAN | O75390 | Citrate synthase, mitochondrial | 466 | 1.245 |
| 45 | LIMA1_HUMAN | Q9UHB6 | LIM domain and actin‐binding protein 1 | 759 | 1.245 |
| 46 | CAPR1_HUMAN | Q14444 | Caprin‐1 | 709 | 1.245 |
| 47 | MYADM_HUMAN | Q96S97 | Myeloid‐associated differentiation marker | 322 | 1.245 |
| 48 | PDCD4_HUMAN | Q53EL6 | Programmed cell death protein 4 | 469 | 1.245 |
| 49 | APEX1_HUMAN | P27695 | DNA‐(apurinic or apyrimidinic site) lyase | 318 | 1.245 |
| 50 | MARE1_HUMAN | Q15691 | Microtubule‐associated protein RP/EB family member 1 | 268 | 1.408 |
| 51 | NACAM_HUMAN | E9PAV3 | Nascent polypeptide‐associated complex subunit alpha, muscle‐specific form | 2078 | 1.562 |
| 52 | SHLB2_HUMAN | Q9NR46 | Endophilin‐B2 | 395 | 1.562 |
| 53 | LIMS1_HUMAN | P48059 | LIM and senescent cell antigen‐like‐containing domain protein 1 | 325 | 1.562 |
| 54 | EHD1_HUMAN | Q9H4M9 | EH domain‐containing protein 1 | 534 | 1.562 |
| 55 | TNPO1_HUMAN | Q92973 | Transportin‐1 | 898 | 1.562 |
| 56 | PYGB_HUMAN | P11216 | Glycogen phosphorylase, brain form | 843 | 1.562 |
| 57 | BZW1_HUMAN | Q7L1Q6 | Basic leucine zipper and W2 domain‐containing protein 1 | 419 | 1.562 |
| 58 | AP2B1_HUMAN | P63010 | AP‐2 complex subunit beta | 937 | 1.562 |
| 59 | CMC1_HUMAN | O75746 | Calcium‐binding mitochondrial carrier protein Aralar1 | 678 | 1.562 |
| 60 | SKAP_HUMAN | Q9Y448 | Small kinetochore‐associated protein | 316 | 1.562 |
| 61 | CD9_HUMAN | P21926 | CD9 antigen | 228 | 1.562 |
| 62 | P4HA1_HUMAN | P13674 | Prolyl 4‐hydroxylase subunit alpha‐1 | 534 | 1.562 |
| 63 | PPAC_HUMAN | P24666 | Low molecular weight phosphotyrosine protein phosphatase | 158 | 1.562 |
| 64 | FUBP2_HUMAN | Q92945 | Far upstream element‐binding protein 2 | 711 | 1.562 |
| 65 | RGPD2_HUMAN | P0DJD1 | RANBP2‐like and GRIP domain‐containing protein 2 | 1756 | 1.562 |
| 66 | RAB1C_HUMAN | Q92928 | Putative Ras‐related protein Rab‐1C | 201 | 1.562 |
| 67 | HUWE1_HUMAN | Q7Z6Z7 | E3 ubiquitin‐protein ligase HUWE1 | 4374 | 1.562 |
| 68 | IPYR2_HUMAN | Q9H2U2 | Inorganic pyrophosphatase 2, mitochondrial | 334 | 1.562 |
| 69 | CERS2_HUMAN | Q96G23 | Ceramide synthase 2 | 380 | 1.562 |
| 70 | IRS4_HUMAN | O14654 | Insulin receptor substrate 4 | 1257 | 1.562 |
| 71 | DDX3X_HUMAN | O00571 | ATP‐dependent RNA helicase DDX3X | 662 | 1.562 |
| 72 | PARP1_HUMAN | P09874 | Poly[ADP‐ribose] polymerase 1 | 1014 | 1.562 |
| 73 | MAP4_HUMAN | P27816 | Microtubule‐associated protein 4 | 1152 | 1.562 |
| 74 | LAT1_HUMAN | Q01650 | Large neutral amino acids transporter small subunit 1 | 507 | 1.562 |
| 75 | CARD6_HUMAN | Q9BX69 | Caspase recruitment domain‐containing protein 6 | 1037 | 1.562 |
| 76 | PCD16_HUMAN | Q96JQ0 | Protocadherin‐16 | 3298 | 1.562 |
| 77 | CP250_HUMAN | Q9BV73 | Centrosome‐associated protein CEP250 | 2442 | 1.562 |
| 78 | MCM3_HUMAN | P25205 | DNA replication licensing factor MCM3 | 808 | 1.562 |
| 79 | SYSC_HUMAN | P49591 | Serine‐tRNA ligase, cytoplasmic | 514 | 1.562 |
| 80 | EPHA4_HUMAN | P54764 | Ephrin type‐A receptor 4 | 986 | 1.562 |
| 81 | NT5D1_HUMAN | Q5TFE4 | 5‐nucleotidase domain‐containing protein 1 | 455 | 1.562 |
| 82 | GIPC3_HUMAN | Q8TF64 | PDZ domain‐containing protein GIPC3 | 312 | 1.562 |
| 83 | MXRA5_HUMAN | Q9NR99 | Matrix‐remodeling‐associated protein 5 | 2828 | 1.562 |
| 84 | CO4A4_HUMAN | P53420 | Collagen alpha‐4 (IV) chain | 1690 | 1.562 |
| 85 | POTEB_HUMAN | Q6S5H4 | POTE ankyrin domain family member B | 581 | 1.562 |
| 86 | MYH1_HUMAN | P12882 | Myosin‐1 | 1939 | 1.562 |
| 87 | NFRKB_HUMAN | Q6P4R8 | Nuclear factor related to kappa‐B‐binding protein | 1299 | 1.562 |
| 88 | NAC2_HUMAN | Q9UPR5 | Sodium/calcium exchanger 2 | 921 | 1.562 |
| 89 | NRK2_HUMAN | Q9NPI5 | Nicotinamide riboside kinase 2 | 230 | 1.562 |
| 90 | BRM1L_HUMAN | Q5PSV4 | Breast cancer metastasis‐suppressor 1‐like protein | 323 | 1.562 |
| 91 | SAP3_HUMAN | P17900 | Ganglioside GM2 activator | 193 | 1.562 |
| 92 | APBA1_HUMAN | Q02410 | Amyloid beta A4 precursor protein‐binding family A member 1 | 837 | 1.562 |
| 93 | RS14_HUMAN | P62263 | 40S ribosomal protein S14 | 151 | 1.562 |
| 94 | ENDOV_HUMAN | Q8N8Q3 | Endonuclease V | 282 | 1.562 |
| 95 | UBE4B_HUMAN | O95155 | Ubiquitin conjugation factor E4 B | 1302 | 1.562 |
| 96 | F134C_HUMAN | Q86VR2 | Protein FAM134C | 466 | 1.562 |
| 97 | ACSM5_HUMAN | Q6NUN0 | Acyl‐coenzyme A synthetase ACSM5, mitochondrial | 579 | 1.562 |
| 98 | DPOE1_HUMAN | Q07864 | DNA polymerase epsilon catalytic subunit A | 2286 | 1.562 |
| 99 | SRRT_HUMAN | Q9BXP5 | Serrate RNA effector molecule homolog | 876 | 1.562 |
| 100 | EXOC1_HUMAN | Q9NV70 | Exocyst complex component 1 | 894 | 1.562 |
| 101 | GDE1_HUMAN | Q9NZC3 | Glycerophosphodiester phosphodiesterase 1 | 331 | 1.562 |
| 102 | CAMP3_HUMAN | Q9P1Y5 | Calmodulin‐regulated spectrin‐associated protein 3 | 1249 | 1.562 |
| 103 | BCAS3_HUMAN | Q9H6U6 | Breast carcinoma‐amplified sequence 3 | 928 | 1.562 |
| 104 | NXF2_HUMAN | Q9GZY0 | Nuclear RNA export factor 2 | 626 | 1.562 |
| 105 | HIC1_HUMAN | Q14526 | Hypermethylated in cancer 1 protein | 733 | 1.562 |
| 106 | VP13C_HUMAN | Q709C8 | Vacuolar protein sorting‐associated protein 13C | 3753 | 1.562 |
| 107 | DCE1_HUMAN | Q99259 | Glutamate decarboxylase 1 | 594 | 1.562 |
| 108 | RUVB2_HUMAN | Q9Y230 | RuvB‐like 2 | 463 | 1.562 |
| 109 | UBA1_HUMAN | P22314 | Ubiquitin‐like modifier‐activating enzyme 1 | 1058 | 1.562 |
| 110 | ANX11_HUMAN | P50995 | Annexin A11 | 505 | 1.562 |
| 111 | 2AAB_HUMAN | P30154 | Serine/threonine‐protein phosphatase 2A 65 kDa regulatory subunit A beta isoform | 601 | 1.562 |
| 112 | TFG_HUMAN | Q92734 | Protein TFG | 400 | 1.562 |
| 113 | 1433Z_HUMAN | P63104 | 14‐3‐3 protein zeta/delta | 245 | 1.562 |
| 114 | C1TC_HUMAN | P11586 | C‐1‐tetrahydrofolate synthase, cytoplasmic | 935 | 1.562 |
| 115 | PRDX4_HUMAN | Q13162 | Peroxiredoxin‐4 | 271 | 1.562 |
| 116 | TENA_HUMAN | P24821 | Tenascin | 2201 | 1.562 |
| 117 | MIF_HUMAN | P14174 | Macrophage migration inhibitory factor | 115 | 1.562 |
| 118 | NIPS2_HUMAN | O75323 | Protein NipSnap homolog 2 | 286 | 1.562 |
| 119 | CTNB1_HUMAN | P35222 | Catenin beta‐1 | 781 | 1.562 |
| 120 | ADIRF_HUMAN | Q15847 | Adipogenesis regulatory factor | 76 | 1.562 |
| 121 | COASY_HUMAN | Q13057 | Bifunctional coenzyme A synthase | 564 | 1.562 |
| 122 | TF_HUMAN | P13726 | Tissue factor | 295 | 1.562 |
| 123 | MATR3_HUMAN | P43243 | Matrin‐3 | 847 | 1.562 |
| 124 | RAB4A_HUMAN | P20338 | Ras‐related protein Rab‐4A | 218 | 1.562 |
| 125 | IF4H_HUMAN | Q15056 | Eukaryotic translation initiation factor 4H | 248 | 1.562 |
| 126 | ERP29_HUMAN | P30040 | Endoplasmic reticulum resident protein 29 | 261 | 1.562 |
| 127 | RL30_HUMAN | P62888 | 60S ribosomal protein L30 | 115 | 1.562 |
| 128 | PPCE_HUMAN | P48147 | Prolyl endopeptidase | 710 | 1.562 |
| 129 | UBFL1_HUMAN | P0CB47 | Putative upstream‐binding factor 1‐like protein 1 | 393 | 1.562 |
| 130 | HGB1A_HUMAN | B2RPK0 | Putative high mobility group protein B1‐like 1 | 211 | 1.562 |
| 131 | TM163_HUMAN | Q8TC26 | Transmembrane protein 163 | 289 | 1.562 |
| 132 | DCK_HUMAN | P27707 | Deoxycytidine kinase | 260 | 1.562 |
| 133 | PSB6_HUMAN | P28072 | Proteasome subunit beta type‐6 | 239 | 1.562 |
| 134 | GLYC_HUMAN | P34896 | Serine hydroxymethyltransferase, cytosolic | 483 | 1.562 |
| 135 | ETFB_HUMAN | P38117 | Electron transfer flavoprotein subunit beta | 255 | 1.562 |
| 136 | SEPT2_HUMAN | Q15019 | Septin‐2 | 361 | 1.562 |
| 137 | IG2AS_HUMAN | Q6U949 | Putative insulin‐like growth factor 2 antisense gene protein | 168 | 1.562 |
| 138 | SYEP_HUMAN | P07814 | Bifunctional glutamate/proline‐tRNA ligase | 1512 | 1.562 |
| 139 | GGH_HUMAN | Q92820 | Gamma‐glutamyl hydrolase | 318 | 1.562 |
| 140 | SMC5_HUMAN | Q8IY18 | Structural maintenance of chromosomes protein 5 | 1101 | 1.562 |
| 141 | 3BHS2_HUMAN | P26439 | 3 beta‐hydroxysteroid dehydrogenase/Delta 5–>4‐isomerase type 2 | 372 | 1.562 |
| 142 | SIAS_HUMAN | Q9NR45 | Sialic acid synthase | 359 | 1.562 |
| 143 | DYH7_HUMAN | Q8WXX0 | Dynein heavy chain 7, axonemal | 4024 | 1.562 |
| 144 | GRM2_HUMAN | Q14416 | Metabotropic glutamate receptor 2 | 872 | 1.562 |
| 145 | PLCB_HUMAN | O15120 | 1‐acyl‐sn‐glycerol‐3‐phosphate acyltransferase beta | 278 | 1.562 |
| 146 | PNPO_HUMAN | Q9NVS9 | Pyridoxine‐5‐phosphate oxidase | 261 | 1.562 |
| 147 | GFPT1_HUMAN | Q06210 | Glutamine‐fructose‐6‐phosphate aminotransferase [isomerizing] 1 | 699 | 1.562 |
| 148 | INADL_HUMAN | Q8NI35 | InaD‐like protein | 1801 | 1.562 |
| 149 | CPMD8_HUMAN | Q8IZJ3 | C3 and PZP‐like alpha‐2‐macroglobulin domain‐containing protein 8 | 1885 | 1.562 |
| 150 | CO9A1_HUMAN | P20849 | Collagen alpha‐1(IX) chain | 921 | 1.562 |
| 151 | DNJA2_HUMAN | O60884 | DnaJ homolog subfamily A member 2 | 412 | 1.562 |
| 152 | GASP1_HUMAN | Q5JY77 | G‐protein coupled receptor‐associated sorting protein 1 | 1395 | 1.562 |
| 153 | BIRC3_HUMAN | Q13489 | Baculoviral IAP repeat‐containing protein 3 | 604 | 1.562 |
| 154 | IL2RG_HUMAN | P31785 | Cytokine receptor common subunit gamma | 369 | 1.562 |
| 155 | FUCM_HUMAN | A2VDF0 | Fucose mutarotase | 154 | 1.562 |
| 156 | KAD3_HUMAN | Q9UIJ7 | GTP:AMP phosphotransferase AK3, mitochondrial | 227 | 1.562 |
| 157 | GSX2_HUMAN | Q9BZM3 | GS homeobox 2 | 304 | 1.562 |
| 158 | MIMIT_HUMAN | Q8N183 | Mimitin, mitochondrial | 169 | 1.562 |
| 159 | CYC_HUMAN | P99999 | Cytochrome c | 105 | 1.562 |
| 160 | CC141_HUMAN | Q6ZP82 | Coiled‐coil domain‐containing protein 141 | 1450 | 1.562 |
| 161 | ZN503_HUMAN | Q96F45 | Zinc finger protein 503 | 646 | 1.562 |
| 162 | CHD7_HUMAN | Q9P2D1 | Chromodomain helicase DNA binding protein 7 | 2997 | 1.562 |
| 163 | RADI_HUMAN | P35241 | Radixin | 583 | 1.633 |
| 164 | CAN1_HUMAN | P07384 | Calpain‐1 catalytic subunit | 714 | 1.633 |
| 165 | CATB_HUMAN | P07858 | Cathepsin B | 339 | 1.660 |
| 166 | EF1G_HUMAN | P26641 | Elongation factor 1‐gamma | 437 | 1.875 |
| 167 | CNN2_HUMAN | Q99439 | Calponin‐2 | 309 | 1.938 |
| 168 | GELS_HUMAN | P06396 | Gelsolin | 782 | 1.938 |
| 169 | KRT81_HUMAN | Q14533 | Keratin, type II cuticular Hb1 | 505 | 2.094 |
| 170 | EIF3E_HUMAN | P60228 | Eukaryotic translation initiation factor 3 subunit E | 445 | 2.094 |
| 171 | DAZP1_HUMAN | Q96EP5 | DAZ‐associated protein 1 | 407 | 2.094 |
| 172 | SURF4_HUMAN | O15260 | Surfeit locus protein 4 | 269 | 2.094 |
| 173 | GGCT_HUMAN | O75223 | Gamma‐glutamylcyclotransferase | 188 | 2.094 |
| 174 | HNRH2_HUMAN | P55795 | Heterogeneous nuclear ribonucleoprotein H2 | 449 | 2.094 |
| 175 | AT1A1_HUMAN | P05023 | Sodium/potassium‐transporting ATPase subunit alpha‐1 | 1023 | 2.094 |
| 176 | OLA1_HUMAN | Q9NTK5 | Obg‐like ATPase 1 | 396 | 2.094 |
| 177 | RL1D1_HUMAN | O76021 | Ribosomal L1 domain‐containing protein 1 | 490 | 2.094 |
| 178 | IF4A3_HUMAN | P38919 | Eukaryotic initiation factor 4A‐III | 411 | 2.094 |
| 179 | MESD_HUMAN | Q14696 | LDLR chaperone MESD | 234 | 2.094 |
| 180 | K1C27_HUMAN | Q7Z3Y8 | Keratin, type I cytoskeletal 27 | 459 | 2.094 |
| 181 | CNDP2_HUMAN | Q96KP4 | Cytosolic nonspecific dipeptidase | 475 | 2.191 |
| 182 | H2A2A_HUMAN | Q6FI13 | Histone H2A type 2‐A | 130 | 2.481 |
| 183 | PYGL_HUMAN | P06737 | Glycogen phosphorylase, liver form | 847 | 2.481 |
| 184 | H2A1C_HUMAN | Q93077 | Histone H2A type 1‐C | 130 | 2.481 |
| 185 | ADT1_HUMAN | P12235 | ADP/ATP translocase 1 | 298 | 3.039 |
| 186 | VPP4_HUMAN | Q9HBG4 | V‐type proton ATPase 116 kDa subunit a isoform 4 | 840 | 3.049 |
| 187 | H2B1H_HUMAN | Q93079 | Histone H2B type 1‐H | 126 | 4.672 |
Functional annotation of proteins regulated by collagen
Gene ontology (GO) analysis was performed with the candidate proteins for each biological process [Fig. 3(A)], cellular component [Fig. 3(B)], and molecular function [Fig. 3(C)] using DAVID. Some of the differentially expressed proteins were related to cell adhesion, and we focused on the function of proteins classified as cadherin binding involved in cell–cell adhesion (Table 2).
Figure 3.
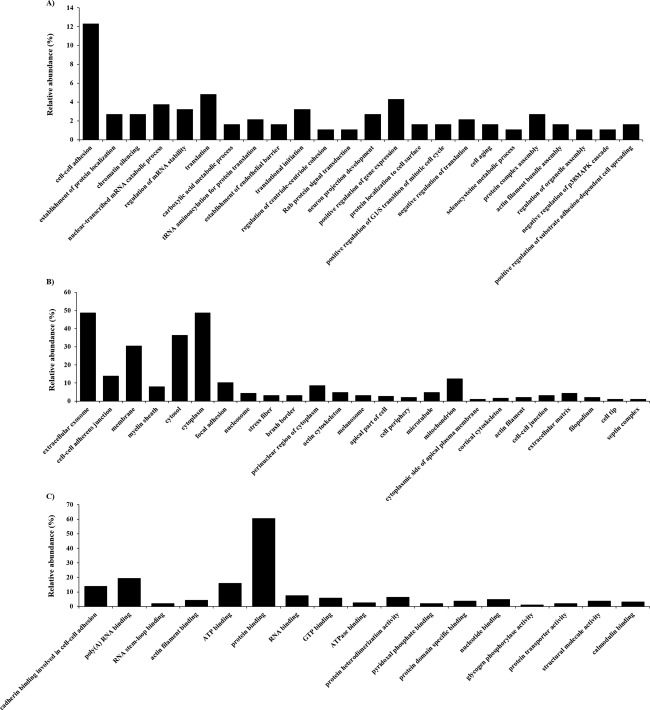
Gene ontology (GO) analysis for identified proteins. (A) Proteins assigned to biological process, (B) cellular component, and (C) molecular function GO term categories. Only significant categories (p < 0.05) are shown.
Table 2.
Differentially Expressed Proteins Categorized as Cadherin Binding Involved in Cell–Cell Adhesion Proteins in Gene Ontology
| No. | Accession Number and Description |
Fold Change (R sc) |
|
|---|---|---|---|
| 1 | O00151 | PDZ and LIM domain protein 1 | −1.359 |
| 2 | P21333 | Filamin‐A | −1.359 |
| 3 | O75369 | Filamin‐B | −1.359 |
| 4 | Q9UHD8 | Septin‐9 | −1.053 |
| 5 | P15311 | Ezrin | 1.102 |
| 6 | O60437 | Periplakin | 1.102 |
| 7 | Q13813 | Spectrin alpha chain, nonerythrocytic 1 | 1.182 |
| 8 | Q9UHB6 | LIM domain and actin‐binding protein 1 | 1.245 |
| 9 | O95433 | Activator of 90 kDa heat shock protein ATPase homolog 1 | 1.245 |
| 10 | P20810 | Calpastatin | 1.245 |
| 11 | Q15691 | Microtubule‐associated protein RP/EB family member 1 | 1.408 |
| 12 | Q7L1Q6 | Basic leucine zipper and W2 domain‐containing protein 1 | 1.562 |
| 13 | Q9NR46 | Endophilin‐B2 | 1.562 |
| 14 | O00571 | ATP‐dependent RNA helicase DDX3X | 1.562 |
| 15 | P35222 | Catenin beta‐1 | 1.562 |
| 16 | Q9H4M9 | EH domain‐containing protein 1 | 1.562 |
| 17 | Q15056 | Eukaryotic translation initiation factor 4H | 1.562 |
| 18 | P63104 | 14‐3‐3 protein zeta/delta | 1.562 |
| 19 | Q15019 | Septin‐2 | 1.562 |
| 20 | P28072 | Proteasome subunit beta type‐6 | 1.562 |
| 21 | P35241 | Radixin | 1.633 |
| 22 | P26641 | Elongation factor 1‐gamma | 1.875 |
| 23 | Q99439 | Calponin‐2 | 1.938 |
| 24 | P60228 | Eukaryotic translation initiation factor 3 subunit E | 2.094 |
| 25 | Q9NTK5 | Obg‐like ATPase 1 | 2.094 |
| 26 | O76021 | Ribosomal L1 domain‐containing protein 1 | 2.094 |
Effect of collagen administration on the expression level of E‐cadherin and EMT marker proteins in HaCaT cells
To investigate whether collagen administration affected the level of cadherin expression, we examined the expression of E‐cadherin in collagen‐administered HaCaT cells. The expression of E‐cadherin clearly decreased with collagen administration compared with nontreated cells (Fig. 4). Next, we examined the expression levels of vimentin and snail to investigate whether epithelial–mesenchymal transition (EMT) was induced in correlation with the downregulation of E‐cadherin. The expression of vimentin and snail clearly increased with collagen administration compared with nontreated cells (Fig. 4).
Figure 4.
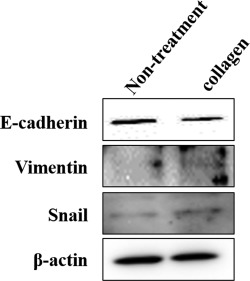
Expression levels of E‐cadherin and EMT markers in HaCaT cells. E‐cadherin expression was decreased with the administration of collagen, whereas the expression levels of vimentin and snail were increased by the administration of collagen compared with nontreated cells.
Effect of collagen administration on keratinocyte migration in a scratch‐wound healing process
To investigate whether EMT affected the migration capability of HaCaT cells, we performed an in vitro wound healing study using the HaCaT scratch model. Photographs were taken before treatment and after 8 h of incubation at 37°C in 5% CO2 [Fig. 5(A)]. Collagen‐administered cells significantly facilitated wound healing compared with nontreated cells [Fig. 5(B)].
Figure 5.
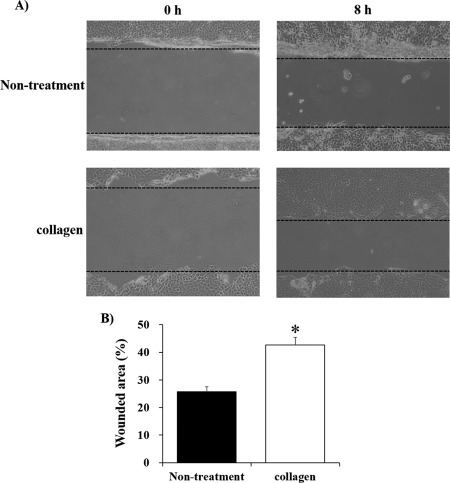
Wound healing assay. (A) Microscopic images of wound healing over 8 h. (B) The percentage of wounded area in collagen‐administered HaCaT cells was significantly larger than in nontreated cells. *p < 0.01.
DISCUSSION
In this study, we used a gel‐free LC–MS‐based proteomics approach to examine the functional effects of collagen from soft‐shelled turtle on human skin. Although spectral counting may not accurately reflect the quantity information,36 it is useful and has been used in many studies, including those searching for novel diagnostic biomarkers.37, 38, 39, 40, 41, 42 We were able to successfully identify several proteins whose expression levels were changed >2‐fold in HaCaT cells by the administration of collagen using a semiquantitative method based on spectral counting.
To examine the role of these identified proteins, we performed GO analysis. The functional category that directly relates to cell–cell adhesion was obtained from among the GO terms on molecular function, biological process, and cellular component. We focused on the functions of proteins classified as cadherin binding involved in cell–cell adhesion because they play important roles in cadherin‐mediated cell adhesion; thus, changes in the expression levels of these proteins with the administration of collagen from soft‐shelled turtle may affect the expression of cadherin. To evaluate this hypothesis, we examined the expression of a major cadherin protein in epithelial cells, E‐cadherin; its expression level was decreased with the administration of collagen from soft‐shelled turtle. As down‐regulation of E‐cadherin is an important factor in EMT induction, we examined the expression of EMT markers in HaCaT cells to investigate whether EMT was induced in keratinocytes by the administration of collagen. The increase in expression of vimentin, a mesenchymal marker,43 and snail, a major inducer of EMT via suppression of E‐cadherin expression,43, 44 in collagen‐administered HaCaT cells compared with nontreated cells suggests that the administration of collagen from soft‐shelled turtle induces EMT in human keratinocytes. Recent studies reported that human collagen type I can induce EMT in some cell types,45, 46, 47, 48 and collagen from soft‐shelled turtle as used in this study may have a similar effect.
EMT was originally described as a phenomenon observed during gastrulation in the early embryo.49 Recently, EMT was considered to be associates with tissue repair responses to injuries in parenchymal organs, including skin.43, 50 Therefore, we performed an in vitro wound healing assay using a cell scratch model to clarify the effect of EMT of HaCaT cells induced by the administration of collagen from soft‐shelled turtle on the wound healing process. The significant promotion of wound healing in HaCaT cells administered collagen suggests that administration of collagen from soft‐shelled turtle enhances the wound healing ability of keratinocytes through the induction of EMT. However, the mechanism of the induction of EMT of keratinocytes upon administration of collagen from soft‐shelled turtle is unclear. In this study, we focused on the function of proteins listed in Table 2, in which the expression level of β‐catenin was increased with collagen administration. A previous report demonstrated that overexpression of β‐catenin induced cell migration and invasion through the induction of EMT via up‐regulation of mesenchymal markers, including vimentin, and down‐regulation of epithelial markers, including E‐cadherin.51 Therefore, increased expression of β‐catenin may be one of the mechanisms underlying the induction of EMT after the administration of collagen from soft‐shelled turtle. Further studies are necessary to clarify the mechanism of increased β‐catenin expression and the other mechanisms for EMT induction.
In conclusion, we measured the changes in protein expression in HaCaT cells administered collagen from soft‐shelled turtle using a shotgun LC/MS‐based global proteomic analysis and found that the administration of collagen induced the EMT of keratinocytes and facilitated wound healing. Therefore, collagen from soft‐shelled turtle may provide significant benefits for skin wound healing and be a useful material for pharmaceuticals and medical care products.
ACKNOWLEDGMENTS
We are grateful to Mr. T. Aboshi for providing the soft‐shelled turtles used in the study (Shin‐uoei, Inc.).
How to cite this article: Yamamoto T, Nakanishi S, Mitamura K, Taga A 2018. Shotgun label‐free proteomic analysis for identification of proteins in HaCaT human skin keratinocytes regulated by the administration of collagen from soft‐shelled turtle. J Biomed Mater Res Part B 2018:106B:2403–2413.
REFERENCES
- 1. Gelse K, Poschl E, Aigner T. Collagens–structure, function, and biosynthesis. Adv Drug Deliv Rev 2003;55(12):1531–1546. [DOI] [PubMed] [Google Scholar]
- 2. Myllyharju J, Kivirikko KI. Collagens, modifying enzymes and their mutations in humans, flies and worms. Trends Genet 2004;20(1):33–43. [DOI] [PubMed] [Google Scholar]
- 3. Birk DE, Trelstad RL. Extracellular compartments in tendon morphogenesis: Collagen fibril, bundle, and macroaggregate formation. J Cell Biol 1986;103(1):231–240. [DOI] [PMC free article] [PubMed] [Google Scholar]
- 4. Adachi E, Hayashi T. Anchoring of epithelia to underlying connective tissue: Evidence of frayed ends of collagen fibrils directly merging with meshwork of lamina densa. J Electron Microsc (Tokyo) 1994;43(5):264–271. [PubMed] [Google Scholar]
- 5. Park KH, Bae YH. Phenotype of hepatocyte spheroids in Arg‐GLY‐Asp (RGD) containing a thermo‐reversible extracellular matrix. Biosci Biotechnol Biochem 2002;66(7):1473–1478. [DOI] [PubMed] [Google Scholar]
- 6. Liu B, Weinzimer SA, Gibson TB, Mascarenhas D, Cohen P. Type I alpha collagen is an IGFBP‐3 binding protein. Growth Horm IGF Res 2003;13(2–3):89–97. [DOI] [PubMed] [Google Scholar]
- 7. Di Lullo GA, Sweeney SM, Korkko J, Ala‐Kokko L, San Antonio JD. Mapping the ligand‐binding sites and disease‐associated mutations on the most abundant protein in the human, type I collagen. J Biol Chem 2002;277(6):4223–4231. [DOI] [PubMed] [Google Scholar]
- 8. Saby C, Buache E, Brassart‐Pasco S, El Btaouri H, Courageot MP, Van Gulick L, Garnotel R, Jeannesson P, Morjani H. Type I collagen aging impairs discoidin domain receptor 2‐mediated tumor cell growth suppression. Oncotarget 2016;7(18):24908–24927. [DOI] [PMC free article] [PubMed] [Google Scholar]
- 9. Maquoi E, Assent D, Detilleux J, Pequeux C, Foidart JM, Noel A. MT1‐MMP protects breast carcinoma cells against type I collagen‐induced apoptosis. Oncogene 2012;31(4):480–493. [DOI] [PubMed] [Google Scholar]
- 10. Gorell ES, Leung TH, Khuu P, Lane AT. Purified type I collagen wound matrix improves chronic wound healing in patients with recessive dystrophic epidermolysis bullosa. Pediatr Dermatol 2015;32(2):220–225. [DOI] [PubMed] [Google Scholar]
- 11. Shevchenko RV, Sibbons PD, Sharpe JR, James SE. Use of a novel porcine collagen paste as a dermal substitute in full‐thickness wounds. Wound Repair Regen 2008;16(2):198–207. [DOI] [PubMed] [Google Scholar]
- 12. Wollina U, Meseg A, Weber A. Use of a collagen‐elastin matrix for hard to treat soft tissue defects. Int Wound J 2011;8(3):291–296. [DOI] [PMC free article] [PubMed] [Google Scholar]
- 13. Barhoumi A, Salvador‐Culla B, Kohane DS. NIR‐triggered drug delivery by collagen‐mediated second harmonic generation. Adv Healthc Mater 2015. [DOI] [PubMed] [Google Scholar]
- 14. Wallace DG, Rosenblatt J. Collagen gel systems for sustained delivery and tissue engineering. Adv Drug Deliv Rev 2003;55(12):1631–1649. [DOI] [PubMed] [Google Scholar]
- 15. Friess W. Collagen–biomaterial for drug delivery. Eur J Pharm Biopharm 1998;45(2):113–136. [DOI] [PubMed] [Google Scholar]
- 16. Lynn AK, Yannas IV, Bonfield W. Antigenicity and immunogenicity of collagen. J Biomed Mater Res B Appl Biomater 2004;71(2):343–354. [DOI] [PubMed] [Google Scholar]
- 17. Pranoto Y, Lee CM, Park HJ. Characterizations of fish gelatin films added with gellan and kappa‐carrageenan. LWT Food Sci Technol 2007;40(5):766–774. [Google Scholar]
- 18. Muralidharan N, Jeya Shakila R, Sukumar D, Jeyasekaran G. Skin, bone and muscle collagen extraction from the trash fish, leather jacket (Odonus niger) and their characterization. J Food Sci Technol 2013;50(6):1106–1113. [DOI] [PMC free article] [PubMed] [Google Scholar]
- 19. Wang Y, Regenstein JM. Effect of EDTA, HCl, and citric acid on Ca salt removal from Asian (silver) carp scales prior to gelatin extraction. J Food Sci 2009;74(6):C426–C431. [DOI] [PubMed] [Google Scholar]
- 20. Wang C, Zhan CL, Cai QF, Du CH, Liu GM, Su WJ, Cao MJ. Expression and characterization of common carp (Cyprinus carpio) matrix metalloproteinase‐2 and its activity against type I collagen. J Biotechnol 2014;177:45–52. [DOI] [PubMed] [Google Scholar]
- 21. Benjakul S, Thiansilakul Y, Visessanguan W, Roytrakul S, Kishimura H, Prodpran T, Meesane J. Extraction and characterisation of pepsin‐solubilised collagens from the skin of bigeye snapper (Priacanthus tayenus and Priacanthus macracanthus). J Sci Food Agric 2010;90(1):132–138. [DOI] [PubMed] [Google Scholar]
- 22. Nalinanon S, Benjakul S, Kishimura H. Collagens from the skin of arabesque greenling (Pleurogrammus azonus) solubilized with the aid of acetic acid and pepsin from albacore tuna (Thunnus alalunga) stomach. J Sci Food Agric 2010;90(9):1492–1500. [DOI] [PubMed] [Google Scholar]
- 23. Tziveleka LA, Ioannou E, Tsiourvas D, Berillis P, Foufa E, Roussis V. Collagen from the Marine sponges Axinella cannabina and Suberites carnosus: Isolation and morphological, biochemical, and biophysical characterization. Mar Drugs 2017;15(6). [DOI] [PMC free article] [PubMed] [Google Scholar]
- 24. Pallela R, Venkatesan J, Janapala VR, Kim SK. Biophysicochemical evaluation of chitosan‐hydroxyapatite‐marine sponge collagen composite for bone tissue engineering. J Biomed Mater Res A 2012;100(2):486–495. [DOI] [PubMed] [Google Scholar]
- 25. Coelho RCG, Marques ALP, Oliveira SM, Diogo GS, Pirraco RP, Moreira‐Silva J, Xavier JC, Reis RL, Silva TH, Mano JF. Extraction and characterization of collagen from Antarctic and Sub‐Antarctic squid and its potential application in hybrid scaffolds for tissue engineering. Mater Sci Eng C Mater Biol Appl 2017;78:787–795. [DOI] [PubMed] [Google Scholar]
- 26. Yamamoto T, Uemura K, Sawashi Y, Mitamura K, Taga A. Optimization of method to extract collagen from “emperor” tissue of soft‐shelled turtles. J Oleo Sci 2016;65(2):169–175. [DOI] [PubMed] [Google Scholar]
- 27. Zou Y, Wang L, Cai P, Li P, Zhang M, Sun Z, Sun C, Xu W, Wang D. Effect of ultrasound assisted extraction on the physicochemical and functional properties of collagen from soft‐shelled turtle calipash. Int J Biol Macromol 2017. [DOI] [PubMed] [Google Scholar]
- 28. Yang Y, Li C, Song W, Wang W, Qian G. Purification, optimization and physicochemical properties of collagen from soft‐shelled turtle calipash. Int J Biol Macromol 2016;89:344–352. [DOI] [PubMed] [Google Scholar]
- 29. Bluemlein K, Ralser M. Monitoring protein expression in whole‐cell extracts by targeted label‐ and standard‐free LC–MS/MS. Nat Protoc 2011;6(6):859–869. [DOI] [PubMed] [Google Scholar]
- 30. Old WM, Meyer‐Arendt K, Aveline‐Wolf L, Pierce KG, Mendoza A, Sevinsky JR, Resing KA, Ahn NG. Comparison of label‐free methods for quantifying human proteins by shotgun proteomics. Mol Cell Proteomics 2005;4(10):1487–1502. [DOI] [PubMed] [Google Scholar]
- 31. Zybailov B, Coleman MK, Florens L, Washburn MP. Correlation of relative abundance ratios derived from peptide ion chromatograms and spectrum counting for quantitative proteomic analysis using stable isotope labeling. Anal Chem 2005;77(19):6218–6224. [DOI] [PubMed] [Google Scholar]
- 32. Dennis G, Jr. , Sherman BT, Hosack DA, Yang J, Gao W, Lane HC, Lempicki RA. DAVID: Database for annotation, visualization, and integrated discovery. Genome Biol 2003;4(5):P3. [PubMed] [Google Scholar]
- 33. Huang da W, Sherman BT, Lempicki RA. Systematic and integrative analysis of large gene lists using DAVID bioinformatics resources. Nat Protoc 2009;4(1):44–57. [DOI] [PubMed] [Google Scholar]
- 34. Huang da W, Sherman BT, Lempicki RA. Bioinformatics enrichment tools: Paths toward the comprehensive functional analysis of large gene lists. Nucleic Acids Res 2009;37(1):1–13. [DOI] [PMC free article] [PubMed] [Google Scholar]
- 35. Liang CC, Park AY, Guan JL. In vitro scratch assay: A convenient and inexpensive method for analysis of cell migration in vitro . Nat Protoc 2007;2(2):329–333. [DOI] [PubMed] [Google Scholar]
- 36. Lundgren DH, Hwang SI, Wu L, Han DK. Role of spectral counting in quantitative proteomics. Expert Rev Proteomics 2010;7(1):39–53. [DOI] [PubMed] [Google Scholar]
- 37. Yamamoto T, Kudo M, Peng WX, Naito Z. Analysis of protein expression regulated by lumican in PANC1 cells using shotgun proteomics. Oncol Rep 2013;30(4):1609–1621. [DOI] [PubMed] [Google Scholar]
- 38. Takaya A, Peng WX, Ishino K, Kudo M, Yamamoto T, Wada R, Takeshita T, Naito Z. Cystatin B as a potential diagnostic biomarker in ovarian clear cell carcinoma. Int J Oncol 2015;46(4):1573–1581. [DOI] [PubMed] [Google Scholar]
- 39. Kanzaki A, Kudo M, Ansai S‐I, Peng W‐X, Ishino K, Yamamoto T, Wada R, Fujii T, Teduka K, Kawahara K, Kawamoto Y, Kitamura T, Kawana S, Saeki H, Naito Z, et al. Insulin‐like growth factor 2 mRNA‐binding protein‐3 as a marker for distinguishing between cutaneous squamous cell carcinoma and keratoacanthoma. Int J Oncol 2016;48(3):1007–1015. [DOI] [PMC free article] [PubMed] [Google Scholar]
- 40. Yamamoto T, Kudo M, Peng W‐X, Takata H, Takakura H, Teduka K, Fujii T, Mitamura K, Taga A, Uchida E, Naito Z, et al. Identification of aldolase A as a potential diagnostic biomarker for colorectal cancer based on proteomic analysis using formalin‐fixed paraffin‐embedded tissue. Tumour Biol 2016;37(10):13595–13606. [DOI] [PMC free article] [PubMed] [Google Scholar]
- 41. Takata H, Kudo M, Yamamoto T, Ueda J, Ishino K, Peng WX, Wada R, Taniai N, Yoshida H, Uchida E, et al. Increased expression of PDIA3 and its association with cancer cell proliferation and poor prognosis in hepatocellular carcinoma. Oncol Lett 2016;12(6):4896–4904. [DOI] [PMC free article] [PubMed] [Google Scholar]
- 42. Kawamura T, Nomura M, Tojo H, Fujii K, Hamasaki H, Mikami S, Bando Y, Kato H, Nishimura T. Proteomic analysis of laser‐microdissected paraffin‐embedded tissues: (1) stage‐related protein candidates upon non‐metastatic lung adenocarcinoma. J Proteomics 2010;73(6):1089–1099. [DOI] [PubMed] [Google Scholar]
- 43. Zeisberg M, Neilson EG. Biomarkers for epithelial–mesenchymal transitions. J Clin Invest 2009;119(6):1429–1437. [DOI] [PMC free article] [PubMed] [Google Scholar]
- 44. Barrallo‐Gimeno A, Nieto MA. The snail genes as inducers of cell movement and survival: Implications in development and cancer. Development 2005;132(14):3151–3161. [DOI] [PubMed] [Google Scholar]
- 45. Shintani Y, Hollingsworth MA, Wheelock MJ, Johnson KR. Collagen I promotes metastasis in pancreatic cancer by activating c‐Jun NH(2)‐terminal kinase 1 and up‐regulating N‐cadherin expression. Cancer Res 2006;66(24):11745–11753. [DOI] [PubMed] [Google Scholar]
- 46. Shintani Y, Wheelock MJ, Johnson KR. Phosphoinositide‐3 kinase‐Rac1‐c‐Jun NH2‐terminal kinase signaling mediates collagen I‐induced cell scattering and up‐regulation of N‐cadherin expression in mouse mammary epithelial cells. Mol Biol Cell 2006;17(7):2963–2975. [DOI] [PMC free article] [PubMed] [Google Scholar]
- 47. Koenig A, Mueller C, Hasel C, Adler G, Menke A. Collagen type I induces disruption of E‐cadherin‐mediated cell–cell contacts and promotes proliferation of pancreatic carcinoma cells. Cancer Res 2006;66(9):4662–4671. [DOI] [PubMed] [Google Scholar]
- 48. Shintani Y, Maeda M, Chaika N, Johnson KR, Wheelock MJ. Collagen I promotes epithelial‐to‐mesenchymal transition in lung cancer cells via transforming growth factor‐beta signaling. Am J Respir Cell Mol Biol 2008;38(1):95–104. [DOI] [PMC free article] [PubMed] [Google Scholar]
- 49. Hay ED. An overview of epithelio‐mesenchymal transformation. Acta Anat (Basel) 1995;154(1):8–20. [DOI] [PubMed] [Google Scholar]
- 50. Haensel D, Dai X. Epithelial‐to‐mesenchymal transition in cutaneous wound healing: Where we are and where we are heading. Dev Dyn 2017. [DOI] [PMC free article] [PubMed] [Google Scholar]
- 51. Chen L, Mai W, Chen M, Hu J, Zhuo Z, Lei X, Deng L, Liu J, Yao N, Huang M, Peng Y, Ye W, Zhang D, et al. Arenobufagin inhibits prostate cancer epithelial–mesenchymal transition and metastasis by down‐regulating beta‐catenin. Pharmacol Res 2017;123:130 – 142. [DOI] [PubMed] [Google Scholar]