Abstract
Previous studies indicate that the transcription factor upstream stimulating factor 1 (USF1) is involved in the regulation of lipid and glucose metabolism. However, the role of USF1 in lipid‐induced autophagy remains unknown. Interestingly, we found that USF1 overexpression suppresses autophagy‐related gene expression in HepG2 cells. Further assays confirmed that USF1 could transcriptionally activate mTOR expression, thereby suppressing rapamycin‐induced autophagy in HepG2 cells. Moreover, pharmacological activation of autophagy with rapamycin decreases the numbers and sizes of lipid droplets (LDs) in HepG2 cells exposed to an oleate/palmitate mixture. Of note, USF1 upregulation decreases colocalization of LDs and autophagosomes. In conclusion, our data provide evidence that USF1 contributes to abnormal lipid accumulation in the liver by suppressing autophagy via regulation of mTOR transcription.
Keywords: autophagy, lipid droplet catabolism, mTOR, USF1
Abbreviations
ChIP, Chromatin immunoprecipitation
EM, Electron microscopy
FBS, foetal bovine serum
HFD, high‐fat diet
MEM, minimum essential medium
NAFLD, nonalcoholic fatty liver disease
RT‐PCR, Reverse transcription polymerase chain reaction
USF1, upstream stimulating factor 1
Nonalcoholic fatty liver disease (NAFLD) is defined, as evidenced by either imaging or histology, as hepatic steatosis that is not caused by alcohol 1. Accumulating evidence indicates that autophagy contributes to the removal of excess lipid droplets and decreases steatosis in livers 2, 3. It has been suggested that when the amount of lipid is moderately increased or under conditions of insufficient nutrition, liver cells degrade lipid droplets via autophagy and to produce free fatty acids and ATP, thus providing energy for the body 4, 5. Conversely, a long‐term high‐fat diet (HFD) induces severe lipid accumulation in livers and inhibits autophagy in hepatocytes 4, 6. Therefore, autophagy may be an important target for the treatment of NAFLD.
As a mammalian target of rapamycin, mTOR is a serine/threonine kinase that belongs to the phosphoinositide 3‐kinase related kinase (PIKK) family and is extensively expressed in most mammalian cells 7, 8. Two of the best‐characterized biological effects of mTOR‐activated signalling pathways include the improvement of hepatic lipogenesis and the inhibition of autophagy 9. Research suggested that mTOR activity was enhanced in the livers of HFD‐fed mice compared with that of chow‐fed mice 10. It is now well established that multiple upstream pathways might be involved in the activation of mTOR signalling, including growth factor signalling, amino acid levels, cellular energy levels and stress 11. However, the transcriptional control of mTOR is poorly understood.
Upstream stimulating factor 1 (USF1), a 43‐kDa protein, belongs to the eukaryotic evolutionarily conserved basic helix‐loop‐helix‐leucine zipper transcription factor family 12. By interacting with E‐box regulatory elements (CANNTG), USF1 is involved in various transcriptional processes, including cell proliferation, bone remodelling, inflammation and cell division modulating 13. Biochemical and molecular analyses in cells indicated that multiple genes were modulated by USF1, including apolipoproteins, lipases and various enzymes participating in lipid and glucose metabolism 14, 15. In addition, in vivo studies also showed that inactivating USF1 in mice significantly improved diet‐induced dyslipidaemia, obesity, insulin resistance, hepatic steatosis and atherosclerosis 16, 17. Although USF1 is one of the key regulators in hepatic lipid metabolism, little is known about the regulatory significance of USF1 in the context of mTOR‐suppressed autophagy.
Here, we showed that USF1 was significantly upregulated in the livers of HFD‐fed mice and was accompanied by enhanced hepatic lipid accumulation and reduced expression of autophagy‐related genes. Furthermore, we found that USF1 suppressed autophagy by transcriptionally activating mTOR. Our results demonstrate that USF1 might be a novel suppressor of autophagy in the liver, which might have important implications for our understanding of the regulation of intracellular hepatic lipid homeostasis.
Materials and methods
Experimental animals
Three‐week‐ old male C57BL/6J mice were purchased from the Peking University Health Science Center. The mice were fed a standard chow diet or a high‐fat diet (HFD, D12451, 20% kcal from protein, 35% kcal from carbohydrate, fat 45% kcal from fat, Research Diet, USA,) for 5 or 10 weeks starting at ~ 3 weeks of age and were maintained in a temperature‐controlled (20–24 °C) and humidity‐controlled (45–55%) environment. A 12 h/12 h light/dark cycle was maintained in the animal housing rooms. The animals were sacrificed, and their liver tissues were collected for further analyses.
All the animal procedures were approved by the Animal Ethics Committee of the Beijing Institute of Geriatrics.
Cell culture and treatment
The human hepatic carcinoma cell line HepG2 was purchased from the American Type Culture Collection. The cells were cultured in Eagle's minimum essential medium (MEM) (Invitrogen, Carlsbad, California, USA) supplemented with 10% foetal bovine serum (FBS, HyClone, Logan, Utah, USA), 100 units·mL−1 penicillin (Invitrogen, Carlsbad, California, USA), and 0.1 mg·mL−1 streptomycin (HyClone) at 37 °C with humidified air and 5% CO2. Rapamycin (1 μm) was dissolved in DMSO and was used immediately after preparation. The working concentration was 50 nm.
Construction of adenoviral vectors
An adenoviral vector containing USF1 (Ad‐USF1) and a control vector (Ad‐NC) were constructed by Genepharma (Shanghai, China).
Transient transfection
USF1 siRNA and nonspecific siRNA (NC) were constructed by Genepharma (Shanghai, China). siRNA transfection was performed with HiPerFect transfection reagent (Qiagen, Duesseldorf, Germany) as previously described 18. Briefly, 6 × 10⁵ cells were seeded in 6‐well plates with 2 mL of MEM culture medium containing 10% FBS and antibiotics. At the same time, siRNA or the NC was mixed with HiPerFect transfection reagent and incubated at room temperature for 10 min. Then, the preparations were transfected into HepG2 cells for 48 h.
RNA isolation and reverse transcription polymerase chain reaction (RT‐PCR)
Total RNA from HepG2 cells was extracted with Trizol (Invitrogen, Carlsbad, California, USA) according to the manufacturer's instructions. To quantify the mRNA, real‐time PCR was performed as previously described 19. In brief, a total of 1 μg of RNA was reverse transcribed using a cDNA synthesis kit (Invitrogen, Carlsbad, California, USA) according to the manufacturer's instructions. For real‐time PCR, 2 μL of the cDNA template was mixed with 5 μL of SYBR Green Supermix, 0.4 μL of forward primer, 0.4 μL of reverse primer, and 2.2 μL of ddH2O. The cycling conditions were as follows: 95 °C for 10 min, followed by 40 cycles at 95 °C for 15 s and 60 °C for 1 min. The fluorescent signals were analysed using an ICycler IQ5 detection system (Bio‐Rad). The relative levels of USF1, autophagy‐associated genes and lipid metabolism‐related genes were determined using the 2‐delta delta Ct analysis method. β‐actin was used as the endogenous control. The primers used for real‐time PCR are listed in Table 1.
Table 1.
List of real‐time PCR primers used
| Gene name | Forward primer | Reverse primer |
|---|---|---|
| FAS (Human) | CTTGGTCTTCTTTATTGGCAT | AGGAAAATTACAAATGGCCTT |
| ACC (Human) | TTGATTCCTGGCTCTACCC | TCACTGCCTCTGAATACACA |
| SCD1 (Human) | TTGATTCCTGGCTCTACCC | TCACTGCCTCTGAATACACA |
| SREBP1 (Human) | TCTCTTAGAGCGAGCACTGA | TCAGAGAGGCCCACCACTT |
| LXR (Human) | CTATCGGCTCTCATCCCTT | GACCTGCAACCCTTTCACC |
| Fatp1 (Human) | GATGTCCCCATTTAGCCAT | TATTCAACAGGCTAGAACCCC |
| Fatp2 (Human) | CCGGTTTCTAAGAATACAGG | ATCCAAGAAATACAAGGCAT |
| Fatp5 (Human) | CCCATTTCATCCGCATCCAG | TGGTACATTTCTGCCGTCA |
| CD36 (Human) | AACCTATTGGTCAAGCCAT | ATGTTTGCCTTCTCATCACC |
| PPAR‐γ (Human) | AGCCTCATGAAGAGCCTTCCAACT | TGTCTTTCCTGTCAAGATCGCCCT |
| Fabp1 (Human) | AACATCAAGTCTGTGACCGAA | TTGAAGACAATGTCACCCAA |
| Cpt1α (Human) | TAGATCATGCACTGTTGACCA | TATGTTTAAGCACTCACGTCT |
| Scad (Human) | TCAAGTTCCTCATCTAAGTGGC | AAGGAAAAGACAGACCCCA |
| Acox1 (Human) | CGGACTACACTTCATAAATGCC | GCAAAGTAATTATGTGCTCCC |
| PPAR‐α (Human) | AGTCTCCCAGTGGAGCATTGAACA | ATACGCTACCAGCATCCCGTCTTT |
| apoB (Human) | ATATCTTAGCATCCTTACCGA | AAATTATTTTCTTCGTCGCAAT |
| Mtp (Human) | AAAATATTGGACCTAGCACAG | GTCATCCTAGCTATTGTGCAG |
| β‐actin (Human) | CGGGTCACCCACACTGTGC | CTAGAAGCATTTGCGGTGGACGATG |
| USF1 (Human) | CACTAAACTCTGGGGCTTGTCC | CACCAGCCACTGCTAAACATCC |
| Bnip3 (Human) | CGCAGACACCACAAGATACCAA | GCCGACTTGACCAATCCCAT |
| Atg12 (Human) | CTGGCTGAATACCTCAAATAGTCC | TTCAGTCTGTCCTATGTGCTTG |
| Beclin1 (Human) | ACAACATGCCATCTATAGTTGCC | CCCACATTATCCAACTGTGCATC |
| Map1lc3b (Human) | TTCTCCCACACCAAGTGCAT | ACCTGCTACACATAGGGTCT |
| Bnip3 l (Human) | AGTAGACCCGAAAACATTCCAC | CAATATAGATGCCTAGCCCCAA |
| Atg4B (Human) | TACGACACTCTCCGGTTTGCT | ATGCCACATCAGACAAGATCTCG |
| Beclin1 (Mouse) | CCAGAGTACGCCATGTATAGCAA | TCCTTTCCCCACATCACCCAA |
| Vps34 (Mouse) | CTCACCAAGGCTCATCGGCAAG | TTGACACAGCGAAACTCAACCA |
| Atg12 (Mouse) | CGTTAGAGTGTGCCATTACTCCC | AGAGGTCCCCTGAATAAGCAA |
| Gabarap1 (Mouse) | AACAGCAACCTTATCTGCGATG | TGCTAACATACGCCACTAGCTC |
| Actin (Mouse) | GGCTGTATTCCCCTCCATCG | CCAGTTGGTAACAATGCCATGT |
Western blot analysis
Cells or liver tissues were extracted in RIPA buffer (Solarbio, China). Approximately 30 μg of protein was separated by 10% SDS/PAGE and then transferred onto PVDF membranes (Millipore, Boston, Massachusetts, USA). The membranes were incubated with 8% percent weight by volume nonfat dry milk in PBST (pH 7.5) for 2 h at room temperature; then, the membranes were incubated with the following specific primary antibodies at 4 °C overnight: anti‐USF1 (ab125020, Abcam), anti‐SREBP1 (sc‐13551, Santa Cruze), anti‐FAS (3180, CST), anti‐SCD1 (2794, CST), anti‐CD36 (ab133625, Abcam), anti‐β‐actin (4970, CST), anti‐mTOR (2983, CST), anti‐p‐S6 (4858, CST), anti‐S6 (2217, CST), anti‐p‐S6K (9204, CST), anti‐S6K (2708, CST), anti‐LC3I and anti‐LC3II (L8918, Sigma). After washing three times with PBST, the membranes were incubated with HRP‐conjugated anti‐rabbit or anti‐mouse secondary antibodies (1 : 5000, Zhongshan Gold Bridge, China) for 2 h at room temperature. Immunodetection was performed using the ECL Plus detection system (Millipore, Boston, Massachusetts, USA) according to the manufacturer's instructions. To quantify the protein levels, we normalized the protein in each lane to that of β‐actin. ImageJ software (National Institutes of Health, Bethesda, MD, USA) was used for density analyses.
Histological analysis of tissues
Oil Red O staining and H&E staining were performed as previously described 20.
Electron microscopy (EM)
Cells cultured in monolayers were fixed in 2.5% glutaraldehyde in 100 mm sodium cacodylate, pH 7.43, and postfixed in 1% osmium tetroxide in sodium cacodylate, followed by 1% uranyl acetate. Samples were dehydrated in increasing concentrations of ethanol and then propylene oxide. Epon 812‐like resin Agar 100 (Agar Scientific, Essex, UK) was gradually added and allowed to harden for 48 h at 64 °C. Ultrathin sections (65 nm) were placed on copper grids and briefly exposed to a 0.4% (w/v) lead citrate solution; images were captured with an AMT XR41 digital camera at 80 kV on a JEOL 1200EX transmission electron microscope. Autophagic vacuoles were identified using previously established criteria 21, 22. Autophagic vacuoles (vesicles <0.5 μm) were classified as autophagosomes when two or more of the following criteria were present: double membranes (complete or at least partially visible), ribosomes attached to the cytosolic side of the membrane, luminal density similar to cytosol, and identifiable organelles or regions of organelles in their lumen. Lipid droplets (LDs) are regarded as a unique structure and have a core of neutral lipids, triacylglycerols (TAGs), and sterol esters (SEs) surrounded by a phospholipid monolayer 23.
GFP‐LC3 transient transfection
HepG2 cells were seeded at a density of 5 × 10⁵ cells/well in 6‐well plates. After 24 h, a GFP‐LC3‐expressing plasmid was transfected into the cells using Lipofectamine 2000 reagent (Invitrogen, Carlsbad, CA, USA) according to the manufacturer's instructions. Twenty‐four hours post‐transfection, the cells were treated with 10 μm vehicle or cisplatin and incubated for 16 h. Then, GFP‐LC3‐positive dots were counted using a confocal laser microscope (LSM700, Carl Zeiss, Jena, Germany).
Immunofluorescence
HepG2 cells were cultured on 6‐well plates with glass coverslips, and the samples were fixed in 4% paraformaldehyde for 30 min at room temperature. The samples were washed three times in PBS for 5 min each time. Then, the coverslips were incubated with the antibody against LC3 (diluted 1 : 50 in PBS) in a humidified chamber overnight at 4 °C. After washing with PBS three times (5 min each time), the slides were incubated accordingly with TRITC‐conjugated anti‐rabbit or mouse IgG (diluted 1 : 500 in PBS) at room temperature. After removing the secondary antibody solution and washing three times with PBS in the dark, the coverslips were mounted with a drop of mounting medium and coated onto glass slides. The slides were sealed at room temperature for approximately 1 h in the dark. The fluctuation of fluorescence intensity was then examined using a fluorescence microscope. Lipid droplets were stained by incubating the cells with BODIPY 493/503 (Invitrogen) for 30 min; then, the cells were fixed and processed for immunofluorescence.
Chromatin immunoprecipitation (ChIP)
A chromatin immunoprecipitation assay kit was purchased from Millipore (Boston, Massachusetts, USA). Briefly, the nuclei extracted from the cells transfected with Ad‐USF1/NC or si‐USF1/NC were sonicated into 200–1000 base pair fragments. Precleared chromatin was immunoprecipitated with anti‐USF1 and normal IgG antibodies according to the manufacturer's instructions. Immunocomplexes were added to 50 μL of protein A/G‐Sepharose beads and purified with Qiaquick PCR purification columns (QIAGEN, Duesseldorf, German). The precipitated DNA was amplified using mTOR‐specific primers. The primers specific to the USF1 binding sites on the mTOR promoter were 5′‐ GGCAAGAGGATCGGTCAGTT ‐3′ and 5′‐ TCGGGAAAGCAGAGAGAAGC ‐3′.
Luciferase reporter assay
For the luciferase assay, the promoter sequence of mTOR was cloned into the PGL3 promoter vector as previously described 24. The RLUs were determined using the dual‐luciferase reporter assay system (Promega, Madison, Wisconsin, USA) according to the manufacturer's instructions. The primers for amplification were as follows: mTOR‐F: 5′‐ CGGGTACCAGGATCGGTCAGTTCAAGGC‐3′, mTOR‐R: 5′‐ CCCTCGAGCAAGGGAATGAAACGGGTGC‐3′. The restriction sites for KpI and XhoI are underlined.
Triglyceride measurement
The triglycerides in HepG2 cells were quantified using Triglyceride Assay kit according to the manufacturers’ instructions (ab65336, Abcam, Cambridge, UK). Briefly, HepG2 cells were preincubated with 10 μm Fatostain (Fato) for 24 h then transfected with Ad‐NC or Ad‐USF1 for another 48 h. Then, the cells were collected for triglyceride quantification.
Statistical analysis
The data represent the mean ± standard deviation (SD). Comparisons between groups were analysed by two‐tailed Student's t‐test, and statistical significance was set at P < 0.05. ANOVA multiple comparison tests (SPSS 13.0) followed by Turkey post hoc tests were used for comparisons of two more groups.
Results
Reduced autophagy in 10‐week HFD‐fed mice
First, 5‐week and 10‐week HFD‐fed mice were established. As shown in Fig. 1A,B, the body and liver weights were increased in both the 5‐week and 10‐week HFD‐fed mice. Small vacuoles of lipid droplets were observed in the livers of the 5‐week HFD‐fed mice compared with those of the normal control mice (Fig. 1C). However, the lipid droplets were much larger in the livers of the 10‐week HFD‐fed mice, indicating increased hepatic lipid accumulation (Fig. 1C). Furthermore, we determined the changes in autophagy‐related genes over time. Real‐time PCR analyses showed that the mRNA levels of beclin1, Vps34, Atg12 and Atg4B were markedly enhanced in the livers of 5‐week HFD‐fed mice, but not in those of 10‐week HFD‐fed mice, compared with the mRNA levels in the livers of 5‐week NC mice or 10‐week NC mice (Fig. 2A,B,C and D). Interestingly, we found that the mRNA levels of beclin1, Vps34, Atg12 and Atg4B were markedly reduced in the livers of 10‐week HFD‐fed mice compared with those of 5‐week HFD‐fed mice (Fig. 2A,B,C and D). Furthermore, Western blot assay demonstrated decreased protein level of Beclin and increased expression of p62 in the livers of 10‐week HFD‐fed mice than that of 5‐week HFD‐fed mice (Fig. 2E). Taken together, these results suggested that autophagy was suppressed in long‐term liver steatosis but was induced in short‐term liver steatosis.
Figure 1.
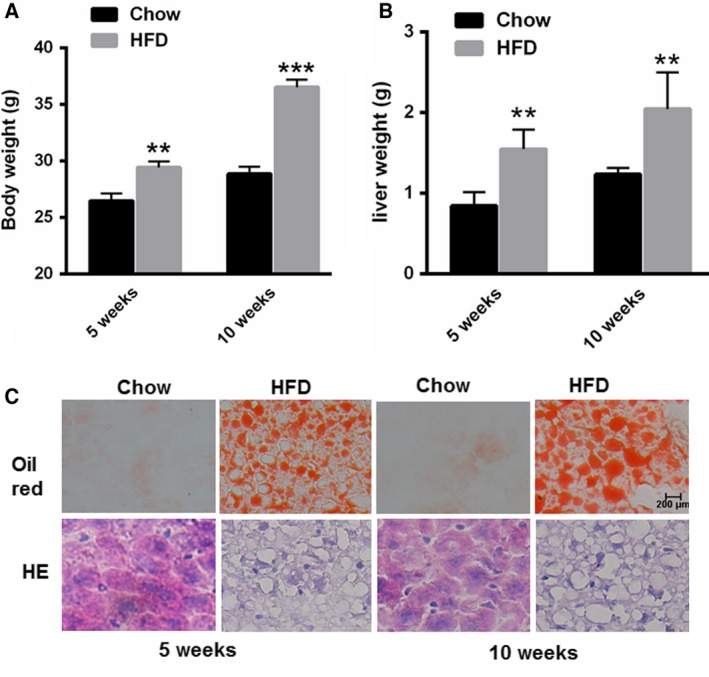
Characteristics of the 5‐week and 10‐week HFD‐fed animal model. (A,B) Measurement of the body and liver weights in the HFD‐fed mice (n = 5). (C) Oil red O and H&E staining in the livers of HFD‐fed mice (n = 5). Data represent the mean ± SEM, n = 5 mice. *P < 0.05; **P < 0.01 versus control. The bar represents 200 μm.
Figure 2.
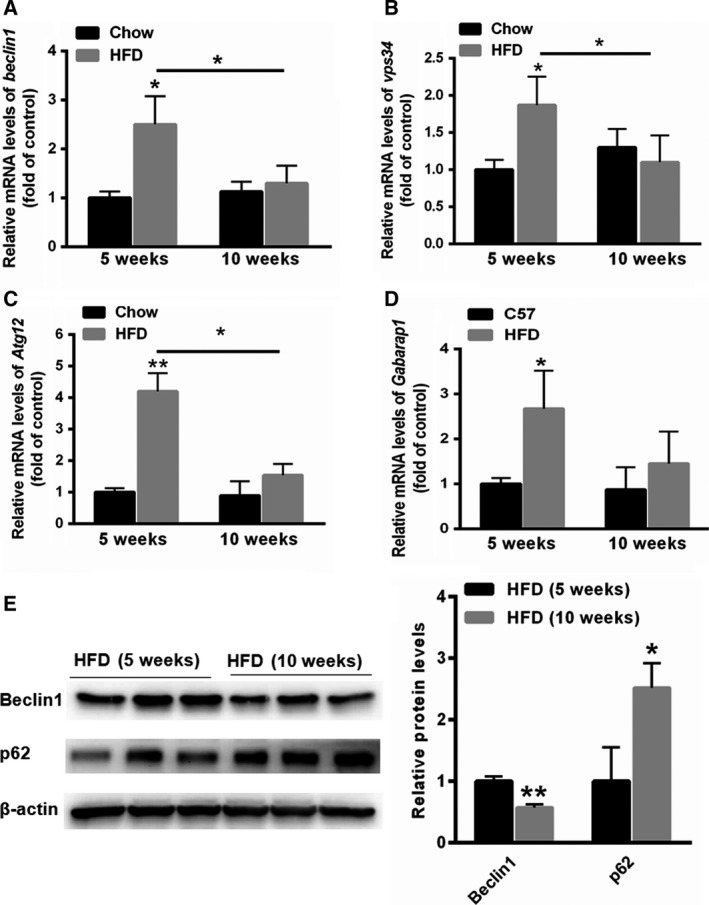
Expression changes in autophagy‐associated genes in the 5‐week and 10‐week HFD‐fed mice. (A,B,C and D) Real‐time PCR results showing the relative expression patterns of autophagy‐associated genes, including beclin1, Vps34, Atg12 and Atg4B in the livers of 5‐week and 10‐week HFD‐fed mice (n = 5). (E) Western blot assay was carried out to evaluate the expression of Beclin1 and p62 in the livers of 5‐week and 10‐week HFD‐fed mice (n = 3). Data represent the mean ± SEM, n = 5 mice. *P < 0.05; **P < 0.01 versus control.
USF1 is upregulated in the livers of long‐term HFD‐fed mice
To determine the specific contribution of USF1 to the regulation of cell autophagy in liver steatosis, we analysed the mRNA level and protein expression of USF1 in the livers of both 5‐week HFD‐fed mice and 10‐week HFD‐fed mice. The mRNA level and protein expression of USF1 remained unchanged in the livers of the 5‐week HFD‐fed mice compared with that of the 5‐week NC mice (Fig. 3A,B). However, a significant increase in USF1 mRNA level and protein expression was observed in the livers of 10‐week HFD‐fed mice compared with that of the 10‐week NC mice (Fig. 3C,D), demonstrating that USF1 was upregulated in long‐term HFD exposure.
Figure 3.
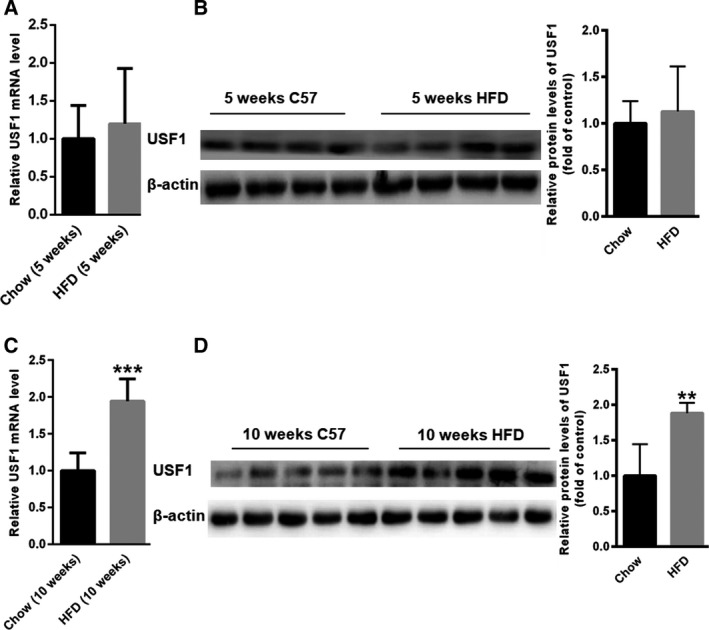
Increased expression of USF1 in 10‐week HFD‐fed mice. Real‐time PCR and Western blots showing the expression of USF1 in the livers of 5‐week (A,B) and 10‐week (C,D) HFD‐fed mice (n = 5). Data represent the mean ± SEM, n = 5 mice. *P < 0.05; **P < 0.01 versus control.
USF1 inhibits rapamycin‐induced autophagy
We next investigated whether USF1 was involved in autophagy in hepatocytes. First, USF1 was overexpressed in HepG2 cells using a recombinant adenoviral vector (Ad‐USF1). Forty‐eight hours after the administration of Ad‐USF1 to the HepG2 cells, USF1 was overexpressed in the HepG2 cells, as indicated by real‐time PCR (Fig. 4A). Of note, significantly decreased expression of autophagic genes, including Bnip3, Atg12, beclin1, Map1lc3b, Bnip3 l and Atg4b, was observed (Fig. 4A). In contrast, these autophagic genes were abundantly increased in HepG2 cells transfected with USF1 siRNA (Fig. 4B). GFP‐LC3 transfection assays showed higher amounts of punctate structures after rapamycin treatment or USF1 silencing. However, these effects of rapamycin were markedly attenuated in the rapamycin‐treated HepG2 cells transfected with Ad‐USF1 for 48 h (Fig. 4C). Similar to the above findings, electron microscopy examinations of the HepG2 cells transfected with Ad‐USF1 also demonstrated significantly reduced numbers of autophagosomes in the HepG2 cells treated with rapamycin (Fig. 4D), supporting that USF1 upregulation induced biochemical alterations in key autophagy molecules.
Figure 4.
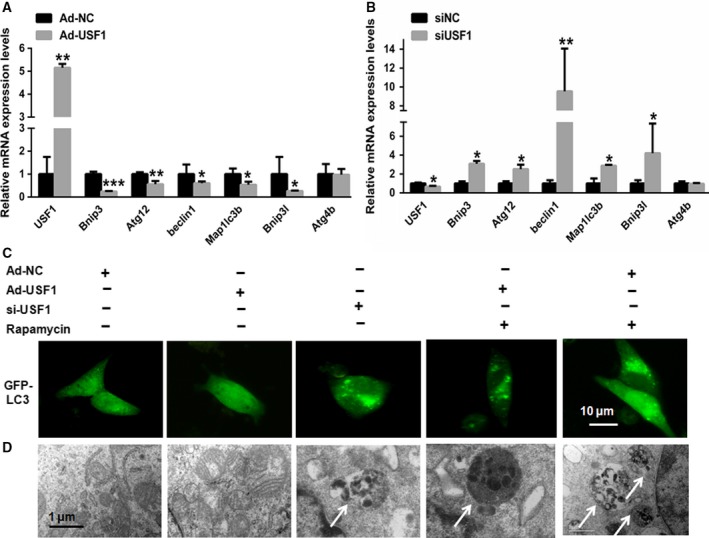
Activation of USF1 inhibits autophagy in hepatocytes. (A,B) Real‐time PCR showing the relative expression patterns of autophagy‐associated genes, including Bnip3, Atg12, beclin1, Bnip3 l and Atg4b, in HepG2 cells transfected with Ad‐USF1 or siUSF1 (n = 6). (C) GFP‐LC3 transfection assay images showing the number of punctate structures. (D) Electron microscopy examination of the autophagosomes in HepG2 cells treated with rapamycin in the absence or presence of USF1. White arrows indicate autophagosomes. Data represent the mean ± SEM, n = 6 independent experiments. *P < 0.05; **P < 0.01 versus control. The bar represents 10 μm.
USF1 mediates autophagy by transcriptionally activating mTOR
We next explored the potential mechanisms that may underlie USF1‐suppressed autophagy in the fatty livers. First, we examined the changes in mTOR signalling. As shown in Fig. 5A, the overexpression of USF1 significantly increased the expression of mTOR, p‐S6K/S6K and the p‐S6/S6 ratio. Moreover, autophagy was suppressed, as evidenced by the decreased ratio of LC3II/LC3I (Fig. 5A). In contrast, there was a marked reduction in mTOR, p‐S6K/S6K and the p‐S6/S6 ratio after USF1 silencing (Fig. 5B). Furthermore, the LC3II/LC3I ratio was increased in the USF1‐knockdown HepG2 cells (Fig. 5B). To determine whether USF1 transcriptionally activated the expression of mTOR, we aligned the promoter region of mTOR from humans and mice. A conserved E‐box regulatory element (CACTTG) recognized by USF1 was identified (Fig. 5C). Then, the promoter region containing the CACTTG region was cloned into the PGL3 promoter vector. Dual luciferase assays showed a marked enhancement in the relative luciferase units (RLUs) in HepG2 cells transfected with Ad‐USF1, whereas siRNA treatment led to an 80% reduction in RLUs in HepG2 cells (Fig. 5D). Moreover, ChIP assays revealed that the upregulation of USF1 increased the interaction between USF1 and the mTOR promoter, but knockdown of USF1 reduced this interaction (Fig. 5E). Furthermore, we also evaluated the activity and expression of mTOR in the livers of HFD‐fed mice. As shown in Fig. 5F, the phosphorylation levels of mTOR and S6 were significantly increased in the livers of 10‐week HFD mice than those of 10‐week C57 mice. Taken together, these data linked the reduced autophagy to USF1 upregulation and mTOR activation in liver cells and demonstrated the systemic metabolic impact of USF1 upregulation in vitro.
Figure 5.
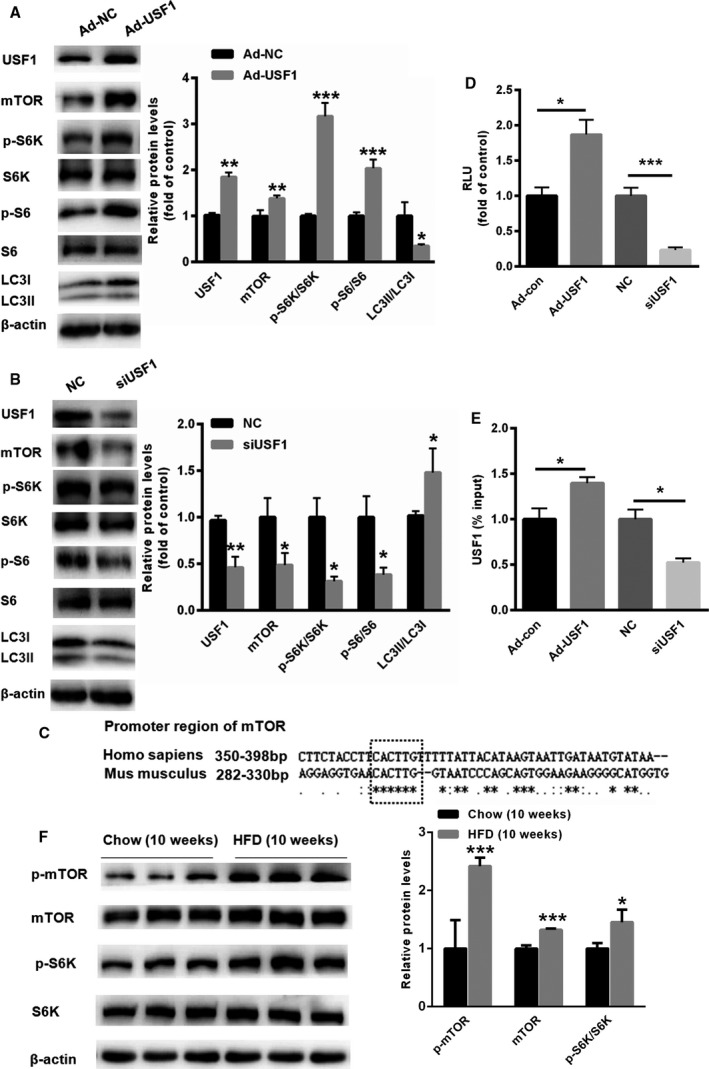
USF1 mediates autophagy by transcriptionally activating mTOR. (A, B) Western blots showing the expression of mTOR, p‐S6K, p‐S6/S6 and LC3‐II/LC3‐I in HepG2 cells transfected with Ad‐USF1 or siUSF1 (n = 6). (C) Schematic analysis of the conserved E‐box elements in the mTOR promoter region of USF1 in humans and mice. (D) Promoter reporter analysis and (E) ChIP assay in HepG2 cells transfected with Ad‐USF1 and siUSF1. (F) Western blot assay showed that the expression and activity of mTOR were increased in the livers of 10‐week HFD‐fed mice. Data represent the mean ± SEM, n = 6 independent experiments. *P < 0.05; **P < 0.01 versus control.
Upregulation of USF1 results in abnormal lipid accumulation
Excess fatty acid accumulation in hepatocytes is a hallmark of metabolic disease, and USF1 is considered as an important contributor to abnormal increases in intracellular lipids. Hence, we tested the effect of USF1 on lipid‐related gene expression. Increased mRNA levels of genes related to lipid synthesis (FAS, ACC, SCD1, SREBP1 and LXR) and uptake (CD36 and PPARγ) were evident in HepG2 cells transfected with Ad‐USF1 (Fig. 6A). Similarly, the overexpression of USF1 in HepG2 cells increased the protein levels of SREBP1, FAS, SCD1 and CD36 (Fig. 6B). In contrast, the inhibition of USF1 expression using siRNA led to much lower mRNA and protein levels of SREBP1, FAS, SCD1 and CD36 compared to those in control cells (Fig. 6C,D). Taken together, these results confirmed that the upregulation of USF1 in hepatocytes induced aberrant de novo lipogenesis and lipid uptake.
Figure 6.
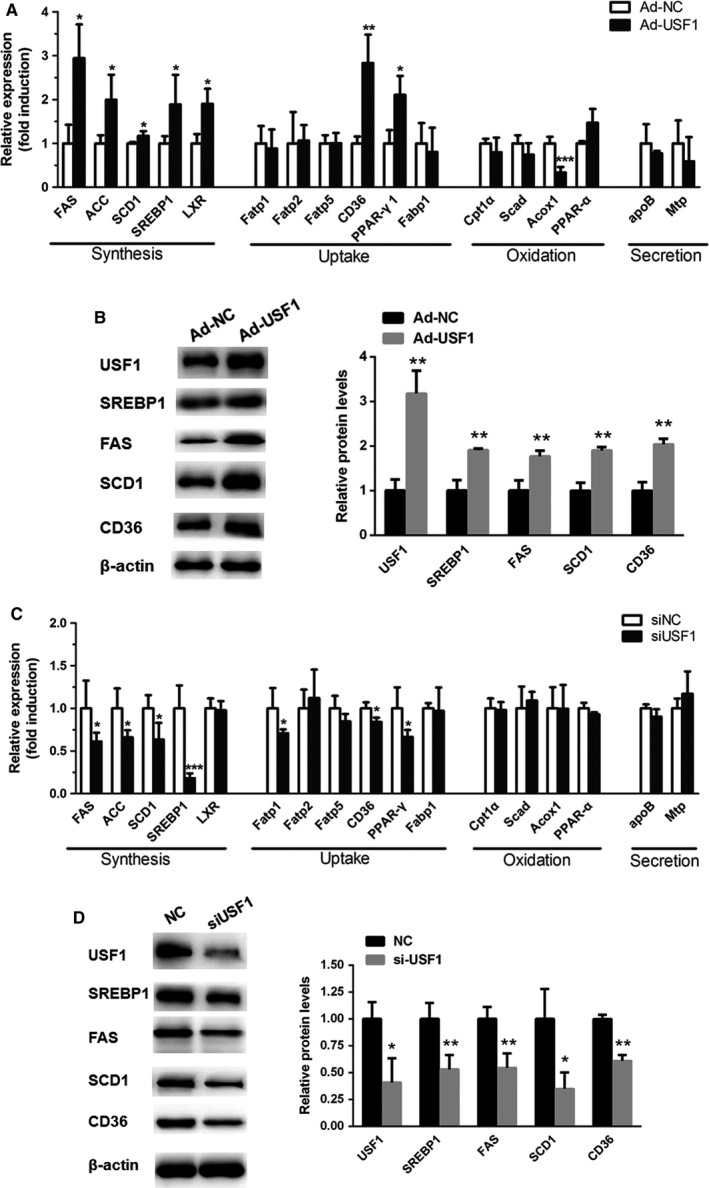
Increased USF1 promotes hepatic lipid accumulation. (A, B) Real‐time PCR and Western blot analyses of lipid metabolism genes after adenovirus‐mediated overexpression of USF1 in HepG2 cells. (C, D) Real‐time PCR and Western blot analyses of lipid metabolism genes in HepG2 cells transfected with siUSF1. Data represent the mean ± SEM, n = 6 independent experiments. *P < 0.05; **P < 0.01 versus control.
Suppression of autophagy by USF1 promotes lipid accumulation
To determine how USF1 regulates TG levels via autophagy, the number and size of lipid droplets (LDs) were examined in HepG2 cells in the absence or presence of rapamycin. Lipid staining with BODIPY 493/503 or Oil red O revealed that the pharmacological activation of autophagy with rapamycin decreased the LD number and size in HepG2 cells treated with an oleate/palmitate (O/P) mixture (Fig. 7A,B). The absence of colocalization of BODIPY 493/503 and the autophagy marker‐LC3 demonstrated that lipid accumulation in cytosolic LDs was negatively correlated with autophagosomes. These changes were largely absent in USF1‐overexpressing cells (Fig. 7A). An increase in the number and size of LDs and a reduced number of autophagosomes in O/P‐treated USF1‐overexpressing cells was also confirmed by electron microscopy (Fig. 7C). Moreover, Western blot analyses showed that the LC3II/LC3I ratio was increased and S6K phoshorylation was decreased after rapamycin treatment, but these effects were largely reversed by the upregulation of USF1 (Fig. 7D). To identify the extent to which lipid accumulation under conditions of USF1 overexpression was due to autophagy inhibition, we quantified the lipid levels in HepG2 cells transfected with USF1 in the presence or absence of rapamycin. As shown in Fig. 7E, compared with Ad‐NC transfected cells (35.8 ± 6.4 mg·million cells−1), overexpression of USF1 in HepG2 cells significantly enhanced lipid contents (48.2 ± 4.7 mg·million cells−1). However, treatment with rapamycin alone decreased intracellular lipid contents by 21.3 ± 3.8 mg·million cells−1. More importantly, overexpression of USF1 could increase the intracellular lipid contents to 34.5 ± 4.6 mg·million cells−1 in HepG2 cells treated with rapamycin. These results demonstrated that in the USF1 overexpression condition, autophagy activation by rapamycin led to reduced lipid contents (less 13.9 mg·million cells−1). Moreover, in the presence of rapamycin, USF1 overexpression resulted in increased lipid contents (enhanced 13.2 mg·million cells−1). However, the relationship between USF's effects on autophagy and lipid accumulation need to be further investigated (Fig. 7E). mTOR also has dual roles in lipid metabolism: one is suppression of autophagy/lipophagy, and another is promotion of lipogenesis by activating SREBP1/2 transcription factors. To determine whether USF1 plays a major role in lipophagy or lipogenesis, we selected SREBP1/2 inhibitor, Fatostatin (Fato), to differentiate lipophagy and lipogenesis. As shown in Fig. 7F, after suppression of SREBP1/2 by Fato, overexpression of USF1 could still increase lipid contents, indicating suppression of autophagy by USF1 contributed to lipid accumulation in liver cells. However, the relationship between USF's effects on autophagy and lipid accumulation need to be further investigated (Fig. 7E). These results suggested that activation of autophagy triggered reduced TG and LD accumulation in HepG2 cells challenged with USF1 overexpression.
Figure 7.
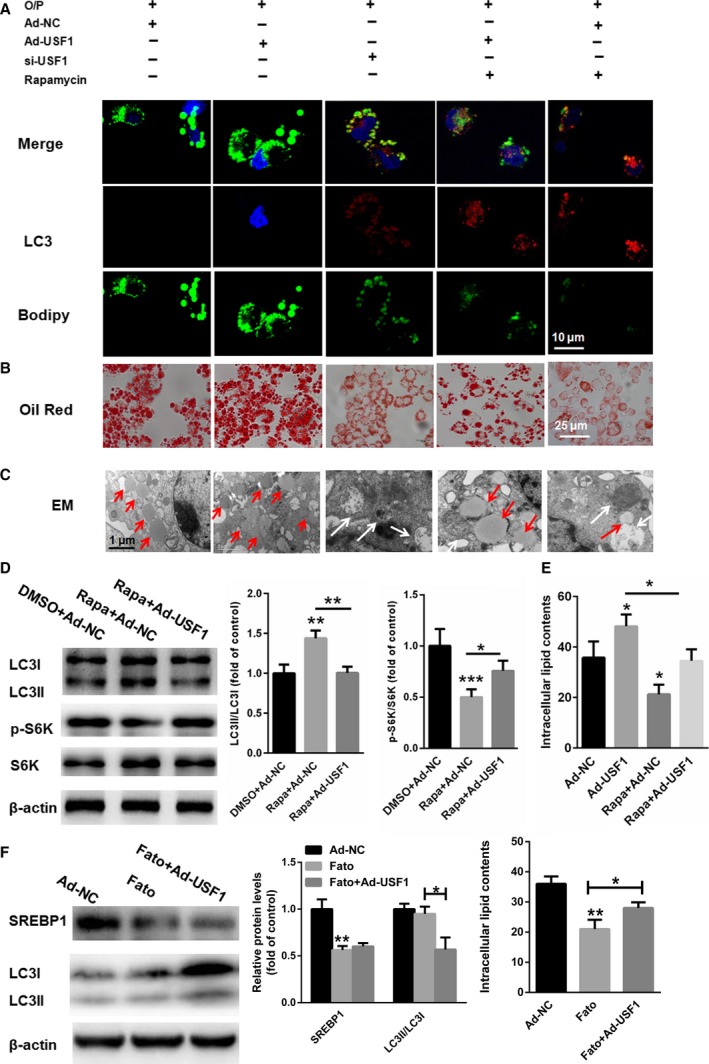
Suppression of autophagy by USF1 promotes lipid accumulation. (A,B and C) Immunofluorescence/BODIPY 493/503, Oil red O staining and electron microscopy images showing the LDs and autophagosomes in HepG2 cells. (D) Western blot analyses show enhanced LC3II/LC3I and decreased S6K phoshorylation changes after rapamycin treatment, but the effects were largely reversed by the upregulation of USF1. (E) Lipid levels in HepG2 cells transfected with USF1 in the presence or absence of rapamycin. (F) Relative lipid contents were determined in HepG2 cells treated with Fato in the presence or absence of Ad‐USF1. Data represent the mean ± SEM, n = 6 independent experiments. *P < 0.05; **P < 0.01 versus control. The bar represents 10 μm. White arrows indicate autophagosomes and red arrows indicate lipid droplets.
Discussion
This study examined the effects of USF1 on the mTOR‐autophagy axis in the livers of mice fed HFD as well as in cultured hepatocarcinoma cells treated with fatty acids. We made a novel finding that USF1 suppresses rapamycin‐induced autophagy at the transcriptional level via regulating expression levels of autophagy‐related genes, which, together with USF1′s promoting role in lipogenesis, promotes lipid accumulation in livers and hepatocytes in response to overnutrition.
In vivo studies showed that autophagy was suppressed in nonalcoholic fatty liver disease 25. However, in the early stages of free fatty acid accumulation in hepatocytes, autophagy might have a protective effect by regulating fatty acid metabolism in liver cells 4. For instance, it has been demonstrated that autophagy flux was increased in 2‐week HFD mice but was nearly inhibited in the livers of 10‐week HFD mice4. PAPÁČKOVÁ Z et al. found that the mRNA level of Beclin1 was enhanced in the livers of 2‐week HFD‐fed rats, while the mRNA level of Beclin1 returned to the normal level in the livers of 10‐week HFD rats4. In line with previous study, our data showed that 10‐week HFD‐fed did not reduce the mRNA of the Atgs, including Beclin1, compared to that of control mice. However, the reduction in Atgs mRNA levels of 10‐week HFD‐fed mice was conducted by comparing with that of 5‐week HFD‐fed mice. We propose that autophagy was gradually suppressed in long‐term liver steatosis.
Studies showed that USF1 could modulate the expression of genes related to glycolipid metabolism 26, 27. For example USF1 could modulate the expression of FAS, ACC and SREBP1, which then modulated lipid synthesis 27. In line with previous studies, our data indicated that USF1 significantly induced abnormal lipid accumulation in hepatocytes. More importantly, we also monitored the changes in USF1 expression over time in HFD‐fed mice. It is interesting to see that USF1 expression varies over time during HFD feeding. Data seem to suggest that fatty liver disease may benefit from USF1 inhibition.
Of note, the expression pattern of USF1 was opposite that of autophagy‐related genes, which prompted us to seek the possible connection between USF1 and autophagy‐related lipid metabolism. Our data demonstrated that the overexpression of USF1 suppressed the transcription of autophagy‐related genes and enhanced lipid accumulation in HepG2 cells in the presence of rapamycin. Moreover, the co‐localization of LDs and autophagosome was reduced after USF1 was overexpressed, indicating that the disturbed balance between autophagy and lipolysis might trap hepatocytes in a harmful cycle in which impaired autophagy promotes lipid accumulation that then further suppresses autophagic function, thus increasing lipid accumulation. Moreover, we found that overexpression of USF1 inhibited the effect of rapamycin. In the preliminary experiment, we treated HepG2 cells with 20 nm rapamycin for 24 h, 48 h. However, the state of HepG2 cells is poor after treatment with 20 nm rapamycin for 24 h, 48 h (Data not shown). Then, we tried to use high dose of rapamycin, 50 nm, to treat HepG2 cells for shorter time (2 h, 4 h, 8 h). We found that autophagy was efficiently induced in HepG2 cells exposed to 50 nm rapamycin for 2 h. However, HepG2 cells treated with 50 nm rapamycin for longer time treatment (4 h, 8 h) were seriously injured (Data not shown). Therefore, to perform the rescue experiment, 50 nm rapamycin was used to treat HepG2 cells for 2 h. After the culture medium was discarded and fresh complete DMEM medium was added, Ad‐USF1 or Ad‐NC was transfected into HepG2 cells for 48 h and cells were collected for further analysis. However, further study is required to investigate whether overexpression of USF1 inhibit the effect of rapamycin due to insufficient dose of rapamycin or short treatment time.
The aberrant activation of mTOR signalling is common in autophagy; thus, we evaluated whether USF1 was involved in the transcriptional control of mTOR 10. As a target of rapamycin, mTOR regulates cell growth and proliferation and integrates growth factors and nutritional signals, thus regulating cellular functions, including lipid synthesis, mitochondrial activity and autophagy 28. mTOR can initiate downstream signalling via nutrition and energy signals. Several studies showed that mTOR signalling defects could cause reductions in body fat, liver gluconeogenesis and glycogen breakdown, thus leading to metabolic disorders such as obesity and diabetes 29. Our present study demonstrated a conserved E‐box element in the promoter region of mTOR targeted by USF1. ChIP and dual luciferase reporter assays indicated that USF1 could transcriptionally activate mTOR expression, thereby suppressing autophagy in hepatocytes. We also examined the expression and activity of mTOR in the livers of 10‐week HFD‐fed mice. As shown in Fig. 5F, the expression and activity of mTOR were increased in the livers of 10‐week HFD‐fed mice. Hence, a relatively long‐term HFD‐fed could increase USF1 expression, which in turn upregulated the expression of mTOR, leading to autophagy suppression and lipid accumulation in the livers.
Additionally, the autophagic flux should be assayed in cultured cells when USF1 is overexpressed or inhibited using lysosomal inhibitors. This is one of our shortcomings. In the future study, we will induce an initial activation of autophagic flux, followed by inhibition of lysosome inhibitors in the presence or absence of USF1 overexpression, thereby evaluating whether USF1 blocks the autophagic flux.
In conclusion, our data provide evidence that USF1 contributes to abnormal lipid accumulation in the liver by suppressing autophagy via regulation of mTOR transcription. Based on our results, we regard USF1 as a potential biomarker, especially in diseases of dyslipidaemia and autophagy, and we expect that USF1 could be a therapeutic strategy for treating these types of diseases.
Author contributions
JG and WF performed the experiments and analyzed the data. XC helped to revise the manuscript. YL, GH, JW, XZ and CY performed part of the RT‐qPCR experiments. JL designed the experiments, analysed the data and gave final approval of the version to be published.
Acknowledgements
This work was supported by 973 program grants from the National Basic Research Program of China [2014CB910503 to JL] and the National Natural Science Foundation of China [81570789 and 81270887 to JL; 81700765 to JG].
Jun Guo, Weiwei Fang and Xiehui Chen contributed equally to this work.
Edited by Hitoshi Nakatogawa
References
- 1. Loomba R, Seguritan V, Li W, Long T, Klitgord N, Bhatt A, Dulai PS, Caussy C, Bettencourt R, Highlander SK et al (2017) Gut microbiome‐based metagenomic signature for non‐invasive detection of advanced fibrosis in human nonalcoholic fatty liver disease. Cell Metab 25, 1054–1062. e5. [DOI] [PMC free article] [PubMed] [Google Scholar]
- 2. Xiao Y, Liu H, Yu J, Zhao Z, Xiao F, Xia T, Wang C, Li K, Deng J, Guo Y et al (2016) MAPK1/3 regulate hepatic lipid metabolism via ATG7‐dependent autophagy. Autophagy 12, 592–593. [DOI] [PMC free article] [PubMed] [Google Scholar]
- 3. Jaishy B and Abel ED (2016) Lipids, lysosomes, and autophagy. J Lipid Res 57, 1619–1635. [DOI] [PMC free article] [PubMed] [Google Scholar]
- 4. Papackova Z, Dankova H, Palenickova E, Kazdova L and Cahova M (2012) Effect of short‐ and long‐term high‐fat feeding on autophagy flux and lysosomal activity in rat liver. Physiol Res 61 (Suppl 2), S67–S76. [DOI] [PubMed] [Google Scholar]
- 5. Yang L, Li P, Fu S, Calay ES and Hotamisligil GS (2010) Defective hepatic autophagy in obesity promotes ER stress and causes insulin resistance. Cell Metab 11, 467–478. [DOI] [PMC free article] [PubMed] [Google Scholar]
- 6. Tong W, Ju L, Qiu M, Xie Q, Chen Y, Shen W, Sun W, Wang W and Tian J (2016) Liraglutide ameliorates non‐alcoholic fatty liver disease by enhancing mitochondrial architecture and promoting autophagy through the SIRT1/SIRT3‐FOXO3a pathway. Hepatol Res 46, 933–943. [DOI] [PubMed] [Google Scholar]
- 7. Brown EJ, Albers MW, Shin TB, Ichikawa K, Keith CT, Lane WS and Schreiber SL (1994) A mammalian protein targeted by G1‐arresting rapamycin‐receptor complex. Nature 369, 756–758. [DOI] [PubMed] [Google Scholar]
- 8. Lakhlili W, Cheve G, Yasri A and Ibrahimi A (2015) Determination and validation of mTOR kinase‐domain 3D structure by homology modeling. Onco Targets Ther 8, 1923–1930. [DOI] [PMC free article] [PubMed] [Google Scholar]
- 9. Hare SH and Harvey AJ (2017) mTOR function and therapeutic targeting in breast cancer. Am J Cancer Res 7, 383–404. [PMC free article] [PubMed] [Google Scholar]
- 10. Li X, Gong H, Yang S, Yang L, Fan Y and Zhou Y (2017) Pectic bee pollen polysaccharide from rosa rugosa alleviates diet‐induced hepatic steatosis and insulin resistance via induction of AMPK/mTOR‐mediated autophagy. Molecules 22, pii: E699. 10.3390/molecules22050699 [DOI] [PMC free article] [PubMed] [Google Scholar]
- 11. Sengupta S, Peterson TR and Sabatini DM (2010) Regulation of the mTOR complex 1 pathway by nutrients, growth factors, and stress. Mol Cell 40, 310–322. [DOI] [PMC free article] [PubMed] [Google Scholar]
- 12. Zhang L, Handel MV, Schartner JM, Hagar A, Allen G, Curet M and Badie B (2007) Regulation of IL‐10 expression by upstream stimulating factor (USF‐1) in glioma‐associated microglia. J Neuroimmunol 184, 188–197. [DOI] [PubMed] [Google Scholar]
- 13. Cheung E, Mayr P, Coda‐Zabetta F, Woodman PG and Boam DS (1999) DNA‐binding activity of the transcription factor upstream stimulatory factor 1 (USF‐1) is regulated by cyclin‐dependent phosphorylation. Biochem J 344, 145–152. [PMC free article] [PubMed] [Google Scholar]
- 14. Naukkarinen J, Gentile M, Soro‐Paavonen A, Saarela J, Koistinen HA, Pajukanta P, Taskinen MR and Peltonen L (2005) USF1 and dyslipidemias: converging evidence for a functional intronic variant. Hum Mol Genet 14, 2595–2605. [DOI] [PubMed] [Google Scholar]
- 15. Rada‐Iglesias A, Ameur A, Kapranov P, Enroth S, Komorowski J, Gingeras TR and Wadelius C (2008) Whole‐genome maps of USF1 and USF2 binding and histone H3 acetylation reveal new aspects of promoter structure and candidate genes for common human disorders. Genome Res 18, 380–392. [DOI] [PMC free article] [PubMed] [Google Scholar]
- 16. Laurila PP, Soronen J, Kooijman S, Forsström S, Boon MR, Surakka I, Kaiharju E, Coomans CP, Van Den Berg SA, Autio A et al (2016) USF1 deficiency activates brown adipose tissue and improves cardiometabolic health. Sci Transl Med 8, 323ra13. [DOI] [PubMed] [Google Scholar]
- 17. Wu S, Mar‐Heyming R, Dugum EZ, Kolaitis NA, Qi H, Pajukanta P, Castellani LW, Lusis AJ and Drake TA (2010) Upstream transcription factor 1 influences plasma lipid and metabolic traits in mice. Hum Mol Genet 19, 597–608. [DOI] [PMC free article] [PubMed] [Google Scholar]
- 18. Fang W, Guo J, Cao Y, Wang S, Pang C, Li M, Dou L, Man Y, Huang X, Shen T et al (2016) MicroRNA‐20a‐5p contributes to hepatic glycogen synthesis through targeting p63 to regulate p53 and PTEN expression. J Cell Mol Med 20, 1467–1480. [DOI] [PMC free article] [PubMed] [Google Scholar]
- 19. Guo J, Li M, Meng X, Sui J, Dou L, Tang W, Huang X, Man Y, Wang S and Li J (2014) MiR‐291b‐3p induces apoptosis in liver cell line NCTC1469 by reducing the level of RNA‐binding protein HuR. Cell Physiol Biochem 33, 810–822. [DOI] [PubMed] [Google Scholar]
- 20. Meng X, Guo J, Fang W, Dou L, Li M, Huang X, Zhou S, Man Y, Tang W, Yu L et al (2016) Liver MicroRNA‐291b‐3p promotes hepatic lipogenesis through negative regulation of adenosine 5’‐monophosphate (AMP)‐activated protein kinase alpha1. J Biol Chem 291, 10625–10634. [DOI] [PMC free article] [PubMed] [Google Scholar]
- 21. Dunn WA Jr (1990) Studies on the mechanisms of autophagy: maturation of the autophagic vacuole. J Cell Biol 110, 1935–1945. [DOI] [PMC free article] [PubMed] [Google Scholar]
- 22. Nixon RA, Wegiel J, Kumar A, Yu WH, Peterhoff C, Cataldo A and Cuervo AM (2005) Extensive involvement of autophagy in Alzheimer disease: an immuno‐electron microscopy study. J Neuropathol Exp Neurol 64, 113–122. [DOI] [PubMed] [Google Scholar]
- 23. Choudhary V, Ojha N, Golden A and Prinz WA (2015) A conserved family of proteins facilitates nascent lipid droplet budding from the ER. J Cell Biol 211, 261–271. [DOI] [PMC free article] [PubMed] [Google Scholar]
- 24. Guo J, Fang W, Sun L, Lu Y, Dou L, Huang X, Sun M, Pang C, Qu J, Liu G et al (2016) Reduced miR‐200b and miR‐200c expression contributes to abnormal hepatic lipid accumulation by stimulating JUN expression and activating the transcription of srebp1. Oncotarget 7, 36207–36219. [DOI] [PMC free article] [PubMed] [Google Scholar]
- 25. Inokuchi‐Shimizu S, Park EJ, Roh YS, Yang L, Zhang B, Song J, Liang S, Pimienta M, Taniguchi K, Wu X et al (2014) TAK1‐mediated autophagy and fatty acid oxidation prevent hepatosteatosis and tumorigenesis. J Clin Invest 124, 3566–3578. [DOI] [PMC free article] [PubMed] [Google Scholar]
- 26. Corre S and Galibert MD (2005) Upstream stimulating factors: highly versatile stress‐responsive transcription factors. Pigment Cell Res 18, 337–348. [DOI] [PubMed] [Google Scholar]
- 27. Griffin MJ and Sul HS (2004) Insulin regulation of fatty acid synthase gene transcription: roles of USF and SREBP‐1c. IUBMB Life 56, 595–600. [DOI] [PubMed] [Google Scholar]
- 28. Wang Y, Ding Y, Li J, Chavan H, Matye D, Ni HM, Chiang JY, Krishnamurthy P, Ding WX and Li T (2017) Targeting the enterohepatic bile acid signaling induces hepatic autophagy via a CYP7A1‐AKT‐mTOR axis in mice. Cell Mol Gastroenterol Hepatol 3, 245–260. [DOI] [PMC free article] [PubMed] [Google Scholar]
- 29. Farah BL, Landau DJ, Sinha RA, Brooks ED, Wu Y, Fung SYS, Tanaka T, Hirayama M, Bay BH, Koeberl DD et al (2016) Induction of autophagy improves hepatic lipid metabolism in glucose‐6‐phosphatase deficiency. J Hepatol 64, 370–379. [DOI] [PubMed] [Google Scholar]


