Abstract
The health of patients in the intensive care unit (ICU) can change frequently and inexplicably. Crucial events and activities responsible for these changes often go unnoticed. This paper introduces healthcare event and action logging (HEAL) which automatically and unobtrusively monitors and reports on events and activities that occur in a medical ICU room. HEAL uses a multimodal distributed camera network to monitor and identify ICU activities and estimate sanitation-event qualifiers. At the core is a novel approach to infer person roles based on semantic interactions, a critical requirement in many healthcare settings where individuals’ identities must not be identified. The proposed approach for activity representation identifies contextual aspects basis and estimates aspect weights for proper action representation and reconstruction. The flexibility of the proposed algorithms enables the identification of people roles by associating them with inferred interactions and detected activities. A fully working prototype system is developed, tested in a mock ICU room and then deployed in two ICU rooms at a community hospital, thus offering unique capabilities for data gathering and analytics. The proposed method achieves a role identification accuracy of 84% and a backtracking role identification of 79% for obscured roles using interaction and appearance features on real ICU data. Detailed experimental results are provided in the context of four event-sanitation qualifiers: clean, transmission, contamination, and unclean.
Keywords: Contextual aspects for events and activities, smart ICU, medical Internet of Things, multimodal sensor network
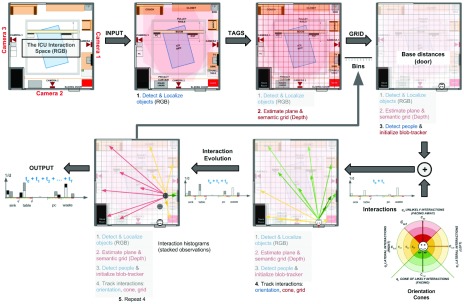
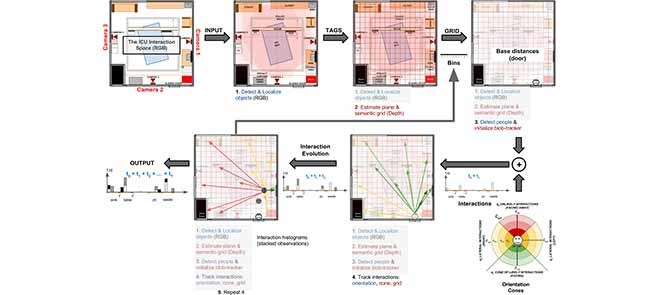
The interactions of people in the space are used to represent and identify roles and their activities. The interaction cone, narrows down the activity search space and allows HEAL to infer which objects need to be included in the estimation and interaction based on their relative orientations and distances. The tracking and quantification steps are repeated throughout the observation to represent the evolution of the interactions and activities over time.
I. Introduction
Effective healthcare is at the core of national debate. A report published in August 2016 by Harvard’s School of Medicine [12] indicates that monitoring Intensive Care Units can save up to $15 billion per year by saving about $20, 000 on each of the 750, 000 ICU beds. This can be achieved by monitoring and tackling preventable health risks such as bed sores and spread of infections by touch. However, effective monitoring require autonomous systems that can work reliably in real-world situations. In the context of visual monitoring, this requires working with occlusions, illumination changes, multiple subjects, and concurrent activities and events. This paper introduces the HEAL framework, which focuses on the detection and classification of human activities and events.
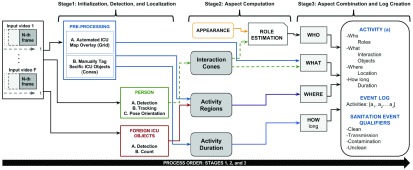
The main novelty of HEAL is the creation of chronologically consistent event logs by fusing contextual and visual information from multiple views and modalities. Contextual information includes location, relevant scene objects, duration of activities or events. We introduce the concept of actor roles, i.e., individuals present in the scene are identified based on their interactions as opposed to recognizing their identities. This is especially important given the ICU conditions and generally accepted protocols for security and privacy of patients and staff in such environments. Figure 4 shows the overall event analysis workflow consisting of three stages: aspect initialization, aspect computation, and label estimation.
FIGURE 4.
Contextual aspects stages for activity and event analysis. Stage 1: estimation and overlay of the activity map on the ICU space, tagging and localization of ICU-objects; detection, tracking, localization of people and objects (foreign to the ICU) on the map. Stage 2: computation of interaction cones as individuals and ICU-objects relative orientations and distances, identification of the activity grid, and estimation of activities duration. Stage 3: combination of aspects to create logs, estimation of activity labels, localization of activities in time, and computation sanitation-event qualifiers.
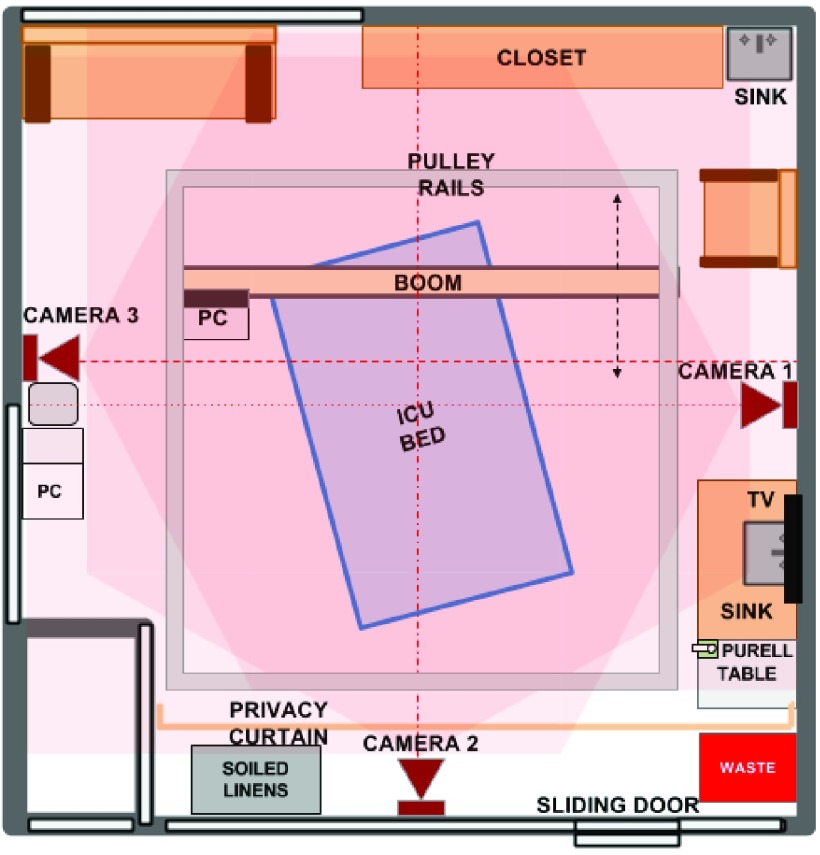
We built an inexpensive HEAL prototype for healthcare using off-the-shelf hardware and sensors. The multimodal sensor nodes are installed at various locations inside the ICU room to monitor the space from multiple views, see Figure 1 for a top-view in an ICU space. The multimodal multiview nature of HEAL allows it to accurately monitor the ICU room and is robust to scene conditions such as illumination variations and partial occlusions. HEAL is currently deployed in a medical ICU where it continuously monitors two rooms without disrupting existing infrastructure or standards of care.
FIGURE 1.
Top-view of the medical ICU. The space is monitored by three nodes, each containing RGB-D sensors.
A. Importance of Event Logs and Qualifiers in Healthcare
Consider the issue of Hospital Acquired Infections (HAIs) by touch in the ICU. For consistency, assume that events can have one of four qualifiers: clean, contamination, transmission, or unclean. The labels depend on the sequence of underlying activities and the detection of hand sanitation activities performed by people after entering and before exiting the ICU room. The variation of HAI-relevant events is often attributed to staff fatigue, monotonous routines, or emergencies, and to visitors not being aware of sanitation protocols. The log’s objective is to provide a chronological description of events inside the ICU room. The logs can be used by healthcare professionals to backtrack the origins of pathogens, which can help designing and executing corrective action plans.
HEAL’s event and activity logging in the ICU will enable the following tasks for healthcare:
-
•
An unobtrusive monitoring system for healthcare that can be used to detect deficiencies and areas of improvement, while maintaining the privacy of patients and staff.
-
•
Semantic healthcare logs that can be used to analyze the spread of pathogens and HAIs by physical contact.
-
•
A platform to evaluate best practices in ICU architectural and operational designs, which promote sanitation and prevent the spread of infections (e.g., sanitation plans).
B. Related Technical Work
The latest developments in convolutional neural network (CNN) architectures for visual activity recognition achieve impressive performance; however, these techniques require large labeled data sets [2], [4], [33], [35]. The method in [28] uses egocentric cameras to analyze off-center activities. A supervised method for learning local feature descriptors is introduced in [41]. The spatio-temporal evolution of features for action recognition is explored in [18]. A multimodal bilinear method for person detection is explored in [34]. The method in [36] uses CNNs to analyze off-center activities, but it requires scenes with good illumination and clear of occlusions. Multi-sensor and multi-camera systems and methods have been applied to smart environments [13], [37]. The systems require alterations to existing infrastructure making their deployment in a hospital logistically difficult. Multiview and multimodal/multimedia methods have been explored in the past. Activity analysis and summarization via camera networks enables systems to represent and monitor environments from multipleviews via graphs [38], hypergraphs [29], or motion motifs [6]. These methods, however, are limited to smooth sequential motion in scenes with relatively good illumination and cannot be applied to the ICU. The work in [27] surveys multimedia methods for large-scale data retrieval and classification. A multimedia method to analyze events in videos via audio, visual, and textual saliency is introduced in [9]. Although interesting, these methods expect speech or text information as input, which cannot be recorded in the ICU (or hospital space) due to infrastructural and privacy restrictions. The studies from [13] and [37] use multiview systems and methods for smart environments. Unfortunately, these methods require modifications to existing infrastructure. Internet-of-Things (IoT) applications for healthcare are surveyed in [14] and [24], with a lifelonging visualization explored in [39].
In general, these previously listed studies are cannot be used in the ICU since they are unable to overcome illumination variations and occlusions. They do not account for subtle motion, which can be non-uniform and non-sequential. The ICU scene conditions disqualify techniques based on skeletal estimation and tracking [1] and pure RGB data for human body orientation [33]. The performance of existing single-camera systems is limited by partial occlusions and challenging ICU scene configurations, which are tackled via HEAL’s multimodal multiview data.
Healthcare applications of patient monitoring include the detection and classification of patient body configurations for quality of sleep, bedsore incidence, and rehabilitation. Torres et al. [31] introduce a coupled-constrained optimization technique that allows them to trust sensor sources for static pose classification. Torres et al. [32] use a multimodal multiview system and combine it with time-series analysis to summarize patient motion. A pose detection and tracking system for rehabilitation is proposed in [20]. The controlled study in [22] focuses on workflow analysis by observing surgeons in a mock-up operating room. The work most similar to HEAL is introduced in [17], where Radio Frequency Identification Devices (RFIDs) and a single depth camera are used to analyze work flows in a Neo-Natal ICU (NICU) environment. These studies focus on staff activities and disregard patient motion. Literature searches indicate that HEAL is the first of its kind in utilizing a distributed multimodal camera network for activity monitoring in a real hospital environment. HEAL’s technical innovation is motivated by medical needs and the availability of cheap sensors and ubiquitous computing. It observes the environment and extracts contextual aspects from various ICU room activities. The events are observed from multiple views and modalities. HEAL integrates contextual aspects such as roles and interactions with temporal information via elastic-net optimization and principled statistics.
A sample input and output for activity classification is shown in Figure 2, where various activity elements are identified across the multiviews of the ICU.
FIGURE 2.
Views of the mock-up ICU where HEAL is tested and activities and events are simulated with the help of actor-volunteers. Left: the multiview (depth and grid information are not shown) input videos for HEAL. Right: the labeled activity output and its labeled aspects.
Technical Contributions. The main contributions are:
-
•
A holistic activity representation that integrates contextual aspects (i.e., roles, locations, interactions, and duration) to identify activities and create event logs.
-
•
The concept of role and role identification, which narrows the activity-role label search space and preserves privacy.
-
•
Integration of activity regions (location and interaction cones) to localize and improve activity classification.
Organization. The ICU activity and events multimodal and multiview dataset is described in Section II. The general approach event detection is described in Section III, along with the definition of aspects, representation of activities via aspects, and estimation of aspect basis and weights. The computation of the various contextual aspects is detailed in Section IV. Tests and results are described in Sections V and VI, respectively. Finally, Section VII discusses our findings, limitations, and future work.
II. Heal Events and Activities Dataset
Two experimental setups are considered. First, we built a mock-ICU room complete with an ICU bed and various activities are acted out. The multimodal sensor rig was custom built as described below using off-the-shelf components and Raspberry Pi3 devices for data acquisition. This provided the preliminary data for methods development.The mock-up data contains 30-minute videos from six views, each view having two modalities. The videos are fully annotated. The preliminary data enabled us to modify the acquisition process and deploy a fully functional distributed sensor network in a community hospital ICU.
A. Multimodal Multview System Setup
The sensor network is composed of three independent nodes each with a RaspberryPi 3B+, an RGB-Depth carmine camera sensor, and a battery pack. The elements are placed inside an aluminum enclosure for sanitation purposes. The nodes are placed at three distinct locations in the ICU to ensure complete coverage of the space as shown in Figure 1. The nodes use TC/IP protocols for communication and synchronization via a Local Area Network. Each node operates up to 12hrs on a single battery.
B. Activity Set
The 20 activities in the set  with their corresponding number of observed instances are: washing hands (68), sanitizing hands (33), entering the room (200), exiting the room (185), delivering food (15), delivering medicine (10), auscultating (48), cleaning room areas (16), cleaning the patient (18), bedside sitting (80), watching tv (45), patient moving on bed (50), rotating (adjusting) the patient (76), observing equipment (105), visiting patient without contact (83), visiting patient (with contact) (59), eating (16), sleeping/resting (84), turning lights on (60), turning lights off (45).
C. Event Set
This study covers the following set of events  :
:
-
1)
Clean: As people walk into the ICU room, they use hand sanitizers or wash their hands. After performing a series of activities, the person uses the hand sanitation once again, as the last activity before stepping out of the room.
-
2)
Contamination: Occurs when visitors bring in contaminants or pathogens from outside the room by bringing in contaminated equipment, objects, or contaminated hands (unwashed or unsanitized).
-
3)
Transmission: Occurs when an individual, such as a nurse, enters a room and follows sanitation protocols up to the point before leaving the room, bringing out contaminants and pathogens, which can affect others.
-
4)
Unclean (risk of contamination and transmission): Occurs when sanitation protocols are not followed, neither upon entering nor exiting the room.
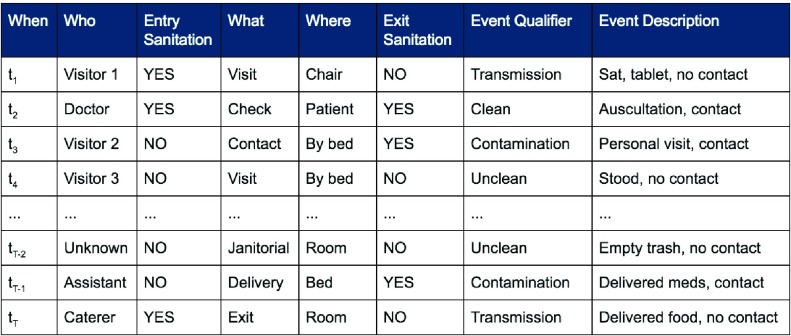
Figure 3 shows a sample log with sanitation event qualifiers. For instance, a very descriptive “clean visit event” includes the following sequence of activities: visitors enter the room, visitors sanitize their hands, visitors seat by the bed, visitors gets up, visitors sanitizes their hands one last time, and visitors exit the room. In short, the event is qualified based on hand sanitation and washing activities in the ICU immediately after entering and before exiting the room. Note that HEAL only observes the inside of the room and not the outside, where additional sanitation and washing stations are also available.
FIGURE 3.
Sample HEAL log indicating the time, role, activity label, location, and detailed description given by a human observer.
The following tasks are performed to classify activities: (1) detect people, (2) identify relevant objects, (3) define the activity blocks (location of respective activities), (4) estimate interaction cones from quantized poselet orientations, (5) estimate activity duration at the estimated ICU location from the grid, and (6) infer person roles. Tasks (1) to (4) are the activity and interaction regions, Task (5) is activity duration using HSMMs, and task (6) is achieved using interaction maps and allows HEAL to narrow the activity search space and increase its activity and event classification accuracy. Events qualifiers are estimated from a sequence of activities, where the objective is to identify sanitation activity and localize in time as immediately after entering or before exiting the ICU.
III. Approach
The problem of event logging involves identifying what activities are executed, where these activities are executed, and by whom, in chronological order. Figure 4 shows the main elements of the HEAL approach. In addition, interacting objects and the activity duration are also recorded. For example, consider the hand-washing activity: this involves a person (nurse) walking towards the sink, using the soap, drying with a towel, and walking away from the sink. The interacting objects are the sink, soap, and towel. The description includes the location of the sink and duration of the overall activity, the objects present, the locations where the person moved around within the monitored space, and the duration or time spent at these various locations. These cues provide significant contextual information is used to identify individuals and their activities. We refer to these data as Contextual Activity Aspects, represented by a  -dimensional vector described as follows.
A. Contextual Activity Aspects
Contextual aspects capture the location, orientation and interaction of a person with other static/dynamic objects in the ICU scene. We use two major objects categories: tagged (i.e., initialized manually, e.g., patient, patient bed, sink, ventilator, etc.) and automatically detected (e.g., cart, cot bed, bottles, books, other people). The  aspects (
 in our implementation) are
  .
.
-
1)
Interaction Cones (C). The interaction cone vector is a vector with
 number-of-tagged-ICU-objects elements. Its elements can take values from the set
  depending on the distance to the object. In our implementation we use 1: ≤ 1ft, 2: > 1 ≤ 2ft, 3: > 2ft). The cone vector (
 ) encodes relative orientation and distance to objects of interest. There are 10 identified ICU objects (light-switch, bed, ventilator, trashcan, computer, closet, couch, door, sink, and tv), so the cone vector has 40 elements.
 -
2)
Activity Grid (G). The monitored space is partitioned into a Cartesian map with
 , where
  is the grid dimensions. The map encodes activity location as a
  dimensional binary vector
  . Our implementation uses a
  grid, so
  .
. -
3)
Activity Duration (D). The activity duration is modeled using segments to more flexibly account for variable state longevity and quantized into slow, medium, and fast. The duration vector is represented by
 .
. -
4)
Foreign Objects (O). The of detectable objects include: laptops, trays, chairs, carts, boxes, cups, books, etc. In our implementation, the number of detectable objects per activity is limited to max of 20. The foreign objects vector is represented by
 .
. -
5)
Roles (R). Eight actor roles are considered – nurse Assistant, Caterer, medical Doctor, Facilities, Isolation, Nurse, Patient, and Visitor [30]. The role aspect is an eight-element vector, where each element is the score assigned to the corresponding role. The role vector is represented by
 .
.
B. Activity Representation via Contextual Aspects
Let  [
[ ,
,  ,
,  ,
,  ,
,  ],
],  , represent the contextual aspects feature vector computed at each frame
  (the frame number is omitted to simplify the notation) for each detected person in the scene. Ideally one could use this aspects vector for the modeling and recognition stages. However, given the uncertainty and noise in the measurements, we found that it is more effective to perform this analysis after approximating the vector in a reduced basis representation. This approximation
  is composed as a linear combination of
  aspects basis
  and
and  reconstruction weights
  , with
 |
C. Aspect Basis and Weights
The aspect basis and aspect weights are estimated from the collection of  segmented and labeled training frames by minimizing:
 |
where  ,
,  (= 0.2) is the regularization parameter. The solution to Eqn. (2) is implemented in Python using the convex optimization library from [7].
IV. Contextual Aspects
Contextual aspects are computed for each detected person per time instance in the scene. The computation of aspects involves the following steps: tag static object of interest, detect individuals entering the room, compute appearance features and initialize a depth-modality blob tracker, estimate poselets and compute interaction cones, detect foreign objects, and estimate roles. Multiple person detectors are tested and two are selected for system deployment [5] limited by Raspberry Pi hardware and convolutional neural networks [26] for offline analysis. This section describes the computation of each of the five aspects: cones, duration, grid, objects, and roles.
A. Interaction Cones Aspect
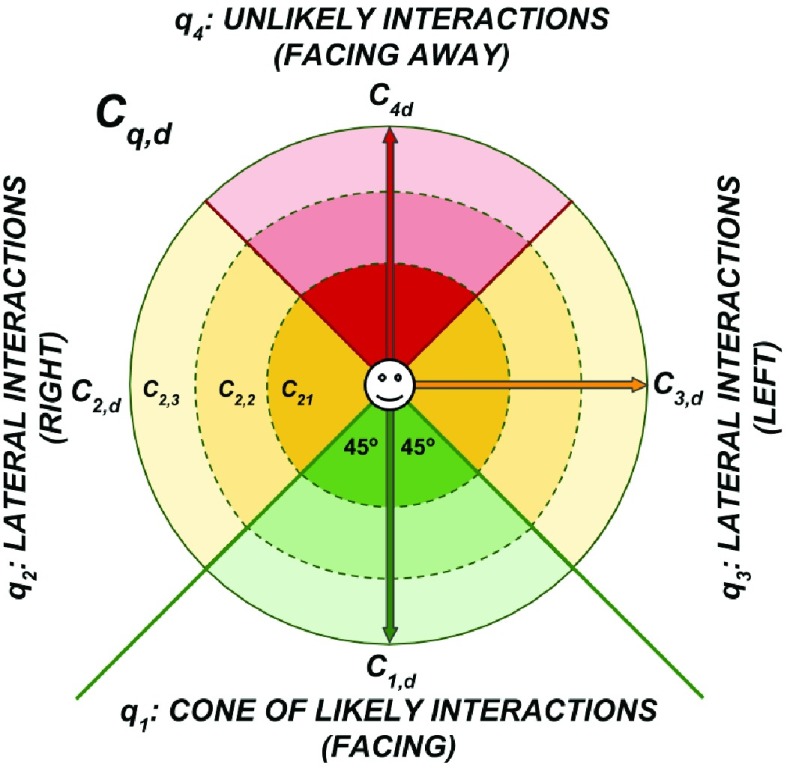
Individuals are tracked using the Depth modality via a blob tracker and RGB modality using the method from [19]. The location of individuals is mapped between RGB and Depth modalities and localized on the activity grid map. Finally, the poselet detector from [3] is used to estimate the relative pose orientation of a person with respect to the door-way. The orientation is quantified using a conical structure shown in Figure 5. A cone is one of four circumference quadrants. Each cone has a  operating arc starting at the
  mark. The elements of the cone feature vector
  contain the distances (
 ) between the individuals and each object
  from the set of tagged ICU objects
  {bed, chair, computer, doorway, nearest-person, sink, table, trashcan, closet, and ventilator}.
FIGURE 5.
The interaction cones represents relative orientation and distances between individuals and tagged objects of interest to the ICU.
B. Activity Duration Aspect
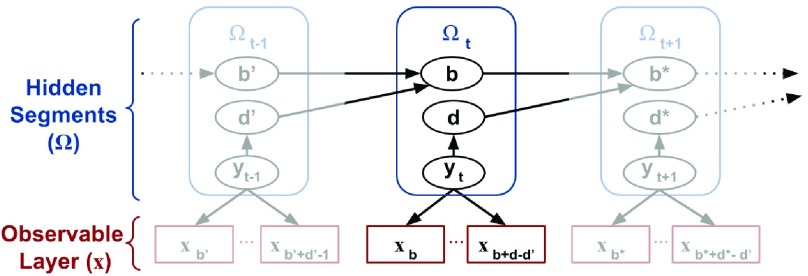
A major limitation of existing activity recognition and classification methods is the inability to distinguish activities that appear to be similar, i.e., coming from a similar scene context. For example, in the ICU environment, walking by the sink, sanitizing hands, and washing hands all appear very similar. The challenge is to identify the aspects that provide discriminant feature representations of these activities. We use the HSMM from [25] as it offers a flexible modelling of activities duration as opposed to conventional HMM. Figure 7 shows the modified trellis and its components. Our implementation uses the software library from [15]. The sequence of states  is represented by the segments
  . A segment is a sequence of unique, sequentially repeated observations (person grid locations). The segments contain information to identify when the person is detected, what the person is doing, and for how long (in time-slice counts). The elements of the
  -th segment
  are the indices (from the original sequence of locations) where the observation (
 ) is detected, the number of sequential observations of the same symbol (duration
  ), and the state or pose (
 ).
).
FIGURE 7.
HSMM trellis with hidden segments  indexed by
  and their elements
  . The variable
  is the first detection in a sequence,
  is the hidden layer,
  is the observable layer containing samples from time
  to
to  . The observation’s initial detection and observation’s duration are represented by the variables
  and
and  , respectively.
HSMM Elements
The hidden variables are segments  and the observable features are
  , which are the semantic grid vectors. The joint probability of the segments and the semantic activity location features is given by:
 |
where  is the sequence of segments such that
  for
for  and with
  as the start position (a bookkeeping variable to track the starting point of a segment),
  is the duration, and
  is the hidden state (
 ). The range of time slices starting at
  and ending at
  (exclusively) have state label
  . All segments have a positive duration and over the time-span
  without overlap and constrained by:
 |
The transition matrix ( ):
):  , represents the probability of going from one segment to the next via:
 |
The first segment ( ) starts at 1 (
 ) and consecutive points are calculated from the previous point via:
 |
where  is
is  : else. Therefore,
  , with
  as dummy variables and
  .
.
The probability of duration  is given by:
 |
Using segments and HSMMs we can model the state duration as a normal distribution  and the duration probability of the
  -th state can be used to distinguish between slow, medium, and fast activities. We refer to [32] for details about HSMM parameter estimation and inference processes.
The duration of the activities is analyzed at three levels: slow, medium, and fast. This allows us to further reduce the label search space. For example, duration information is used to distinguish washing hands (slowest), sanitizing hands (moderate), or walking by the sanitation station (fastest) activities. Additional aspects such as detected objects, critical object interactions, activity locations, and person roles is extracted from the training videos to increase the probability of correctly identifying activities and logging events.
C. Activity Grid Aspect
The binary grid vector  represents activated activity regions and are computed per person. The spatial location is computed by overlaying a 2-D grid on the ICU work-space as shown in Figure 6. The grid dimensions depend on the size of the physical space. When projected to the ICU floor, each block in the grid has dimensions
  inches. The floor plane is estimated from three points using standard image geometry methods. The grid dimensions are
  dimension with
  yields a 256 element activity grid vector (i.e.,
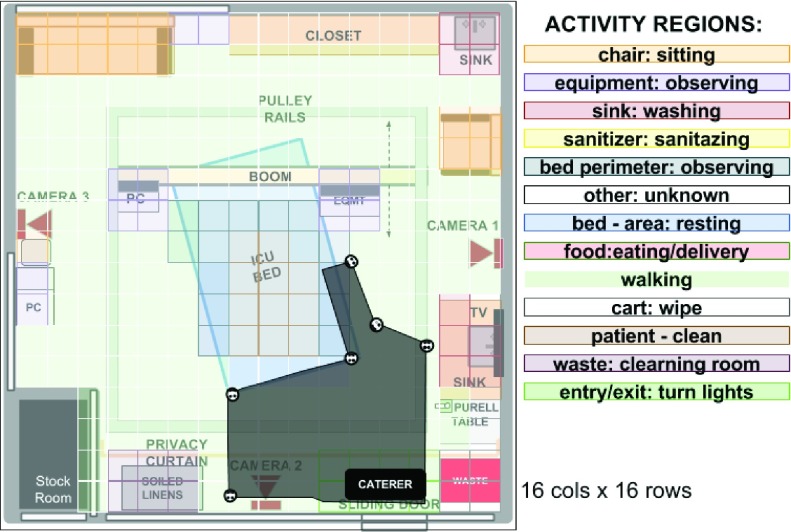
  ). A sample food delivery map is shown in Figure 8 overlayed in translucent black, indicating the areas where activities occur.
FIGURE 6.
The interaction overview diagram for role representation and identification. The cone, narrows down the activity search space and allows HEAL to infer which objects need to be included in the estimation and interaction based on their relative orientations and distances. The tracking and quantification steps are repeated throughout the observation.
FIGURE 8.
Semantic activity map for the caterer role in a  grid overlayed in black. The various block colors in the map are described by the legend on the left, and indicate the associated activity regions.
D. Foreign Objects Aspect
Methods to detect foreign ICU object are tested. These include: [10], [16], and [26]. There is an uncountable number of objects associated with activities. A total of 20 objects is selected based on a detection consistency ≥ 75% on 10 continuous observations. Evaluation of object detectors is beyond the scope of this work; however, the best performing detector for offline-ICU processes is YOLO [26], which uses convolutional neural networks. The best performing detector capable of running on the Raspberry Pi3 is [10], which detects objects from learned attributes.
E. Roles Aspect
Use of identifiable information in the ICU is restricted by patient privacy, labor protection, and Health Insurance Portability and Accountability Act (HIPAA) stipulations [11]. We use role representation from appearance and interaction information to deal with these ICU restrictions. It assigns roles over the complete activity or event using a threshold (70%) based on the number of frames or observations to link a role, else the role is considered to be “unknown”. Learning a role starts with identifying appearance and interaction features for each role and compute scores for each element in the vector  for roles in the set
  [Assistant, Caterer, Doctor, Facilities, Isolation, Nurse, Patient, and Visitor], indexed by
  , from all views
  , and across all frames
  . The appearance vectors (
 ) are computed at
  and used to construct the dictionary of appearances for all roles
  . Similarly, the interaction vectors (
 ) are computed for
  and are used to construct a dictionary of role-interactions for all roles
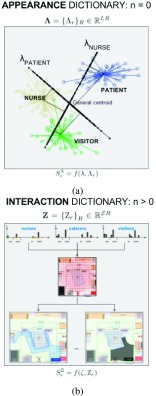
  . The dictionaries are shown in Figure 9 for (a) appearance and (b) interaction elements.
FIGURE 9.
Role representation appearance (a) and interaction (b) dictionaries.
1). Appearance Dictionary ( )
)
Appearance vectors  are computed for each person as they enter the ICU room (i.e., frame
  ) using the data from available view
  . The vectors computed have two parts: a 128-dimension GIST vector (one scale) for texture [21], and the 96-dimension (first and second order) color histogram vector [40] by combining the first moment (mean) and second moment (standard deviation) on 16-bin histograms extracted from each of the three channels in the HSV color space. The texture and color features are concatenated to form the vector
  . The intuition is that these vectors can help identify distinct visitor clothing patterns and generic healthcare staff uniforms. These vectors are used to create the appearance dictionary
  , where
  is the cardinality of the appearance feature vector and
  is the number of roles. The elements of the dictionary
  are the Linear Discriminant Analysis (LDA) [23] boundaries for each role, each represented by
  . The decision hyper-planes are used to score a new sample by computing the distance to all, but selecting the closest one. The the average score
  for role
  is computed for a new individual at
  using available view
  via:
via:
 |
where  is the Euclidean distance computed between the input appearance vector
  and each role boundary
  .
.
2). Interaction Dictionary (Z)
The interaction features representing the  -th role at frame
  correspond to the interaction cones (i.e.,
  ) computed for each role
  and each available view
  at frame
  from a network with
  views over a total of
  frames. The floor plane is estimated from the depth modality to localize ten tagged objected and compute interaction features, which are person-object relative distances and orientations. This interaction feature vector is noted as
  and has 40-elements representing four relative orientations to each of the ten tagged objects. The value of each element corresponds to the quantized person-object distances: 1 (close), 2 (nearby), or 3 (far) for one of the four orientations as shown in Figures 5 and 6. This feature vector represents the evolution of roles interacting with ICU objects over time. Interaction features vectors are clustered using density based clustering (DBSCAN) [8] and the resulting in the interaction dictionary
  , where each
  represents the cluster centroid for role
  ,
,  is the cardinality of the interactions feature, and
  is the number of roles.
The interaction scores are computed for  via:
via:
 |
where  is the distance between the interaction vector
  and the role-centroid
  at frame
  from view
  .
.
3). Appearance and Interactions for Role Identification
Role candidates  are a combination of an individual’s appearance and interaction scores:
 |
The estimated role  is the one with the most similar representation over all roles given by:
 |
V. Testing Contextual Aspects
Activity Classification: Activity labels are estimated using the computed aspects basis and weights over an observed event with  frames indexed by
  . Activity label inference is integrated via majority-vote over the range of frames that starts at frame
  and ends at frame
  and
and  . Activity labels are estimated using the per-frame aspect information, where
  is size of activity-observation window in number of frames. In our implementation we use
  (approximately 1 second). Activity label scores
  are obtained via:
 |
where  is defined in Eqn. (1), with its elements computed using Eqn. (2), where
  is the LDA-decision hyper-plane of activity
  . Finally, the activity label
  is:
is:
 |
Ambiguous activities are labeled unknown and identified via the ratio test on  with a relative dissimilarity of, at least, 0.2 for the highest and second-highest label candidates. Due to the limited number of instances a very small number of activities, such as clerical, physical therapy sessions, and religious services, are classified as unknown.
A. Event Log Creation
A sample log in shown in Figure 3. The various aspects are used to populated the log as shown in Figure 4 and described as follows: First, the ICU door is used to mark the beginning frame ( ) and the ending of an event (
 ); single individuals are detected, tracked, and localized using the grid map and the blob-tracker; finally interactions, activity duration, and role aspects are computed to infer activity labels for a set of frames starting at
  and ending at
  ; The activities are localized in time using the order of the frames and combined with the aspect values to populate the log. The event qualifiers are estimated after the conclusion of the vent (i.e., individual has exited the room).
Event Qalifier Estimation
Considered the event  represented by a sequence of
  activities indexed by
  i.e.,
i.e.,  . A single activity is represented by
  . The event qualifiers evaluate the order of sanitation (hand-washing or hand sanitation) activities in a sequence of activities and provide sanitation labels based on detected activities within a window at the beginning and at the end of the sequence. In our implementation, we consider a clean entry if sanitation is detected within the first three activities. Similarly, a clean exit is recorded if sanitation activity is detected within the last three activities detected.
VI. Experimental Results
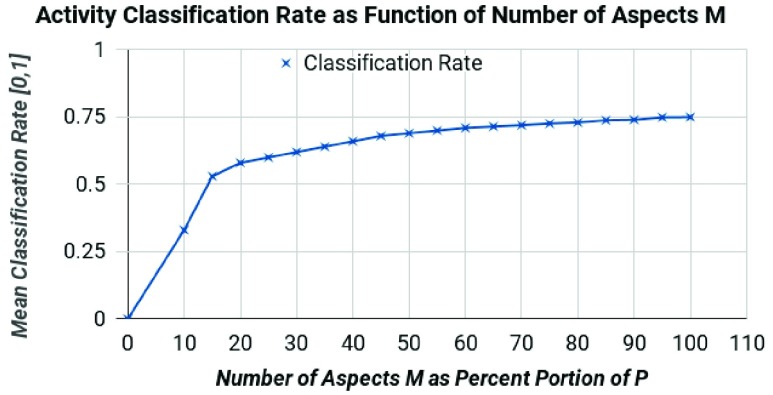
HEAL is evaluated using a 10-fold cross-validation. The reported results are the confusion matrix obtained from the best fold and the mean accuracy over all folds. Figure 10 shows the affect of  on activity classification accuracy.
FIGURE 10.
Mean activity classification accuracy as function of  aspect weights
  for basis
  .
.
A. Role Identification
Each individual entering the room is detected ( ) using the RGB modality, from which texture and color (HSV colorspace) features are extracted. The RGB person information is used to localize people on the scene and initialize a blob-tracker using the depth modality. The features are used to train a Linear SVM Classifier (
 ) with seven classes (isolation is a higher order class that needs to be identified prior to scoring roles using appearance features alone). The systems estimates roles for each frame and assigns a the label with the most votes over a period of observations (i.e,
  to
to  ). The first inference is enabled after a minimum of five frames. The confusion matrix is shown in Figure 11. The label column and rows are highlighted yellow to indicate that individuals in the ICU are not wearing isolation scrubs and role scores are computed using Eqns. (11) and (12).
FIGURE 11.

Role identification confusion matrix of isolated roles. The symbols are A: assistant, C: caterer, D: doctor, F: facilities, N: nurse, P: patient, V: visitor. The cells are color scaled to indicate classification accuracy (darker cells have higher accuracy) in scale 0 – 100. The first column and top row are highlighted using light yellow cells do indicates a non-isolated ICU room.
B. Role Identification in Isolated ICU Rooms
Roles are estimated from logged events. For example, a clean patient rotation event is most likely to be performed by nurses, than patient relatives (i.e., visitors). However, this is not always possible for the activities that apply to all roles. Figure 12 shows a qualitative representation of the performance of HEAL’s role identification correctness of individuals wearing isolation scrubs. The label column and rows are highlighted using dark blue cells do indicate isolated roles. Note:  is ignored in Eqn. (11), which sets
  .
.
FIGURE 12.

Role identification confusion matrix of isolated roles. The symbols are A: assistant, C: caterer, D: doctor, F: facilities, N: nurse, P: patient, V: visitor. The cells are color scaled to indicate classification accuracy (darker cells have higher accuracy) in scale 0 – 100. The first column and top row are highlighted using blue cells to indicate individuals wore isolation scrubs.
C. Accuracy of Log Event Qualifiers
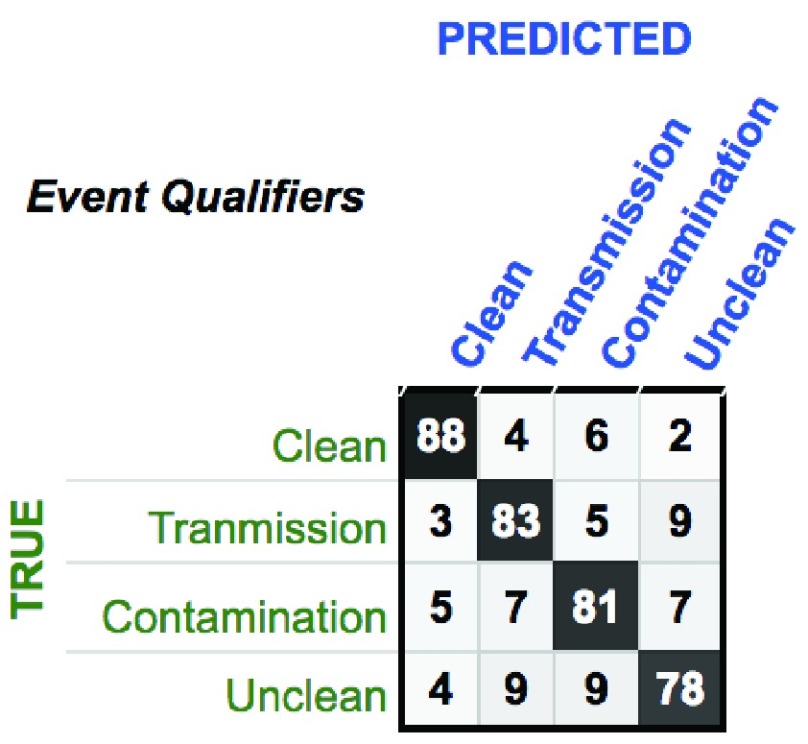
Logs are descriptions of past events that occurred in an area and were performed by a certain role. This experiment involves evaluating the correctness of the event qualifiers: clean, contamination, transmission, and unclean qualifiers by asserting that a sanitation event is detected within the first activities performed by an individual that entered the room and within the last three activities performed by an individual that exited the room. The confusion matrix in Figure 13 indicates true and predicted event qualifiers, where the average accuracy reaches an 82.5% classification rate.
FIGURE 13.
Confusion matrix of the qualifier of the various events in the ICU room. The cells are color scaled to indicate accuracy (darker cells correspond to higher classification accuracy) in scale 0 – 100. The four qualifier are: clean, transmission, contamination, and unclean event.
D. Contribution of Aspects for Activity Classification
The objective of this experiment is to show the impact of the contextual aspects in activity classification.
E. Activity Classification
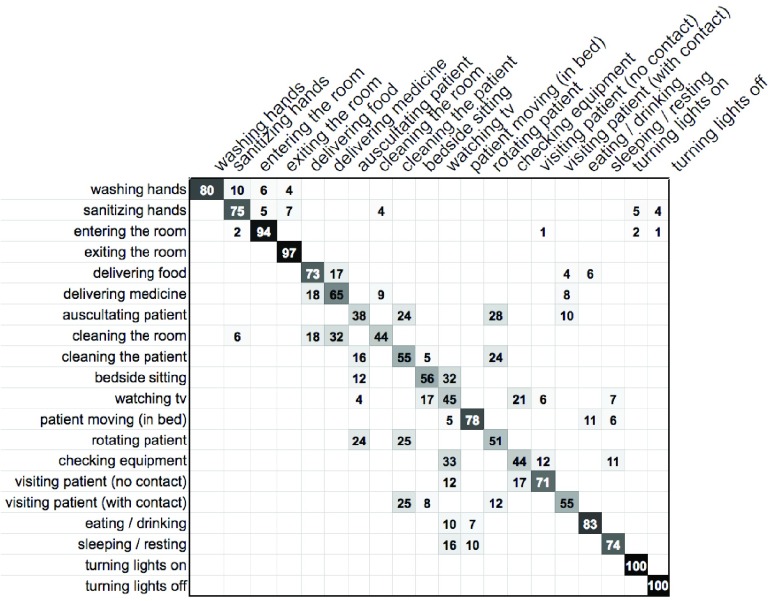
Even with the use of aspects activities in the ICU can be confused with other, similar activities. The confusion matrix in Figure 15 shows the labels and rates of correctly and incorrectly classified activities, where darker cells correspond to better performance and the rows add up to 100. The left column contains the true labels and the top row the predicted labels.
FIGURE 15.
Confusion matrix of the activity classification performance of HEAL using contextual aspects. The left column indicates the true activity labels, while the top row (vertical text) indicates predicted activity labels. Darker cells indicate better performance, while empty cells indicate zero. The values are rounded for displaying purposes in the range [0–100].
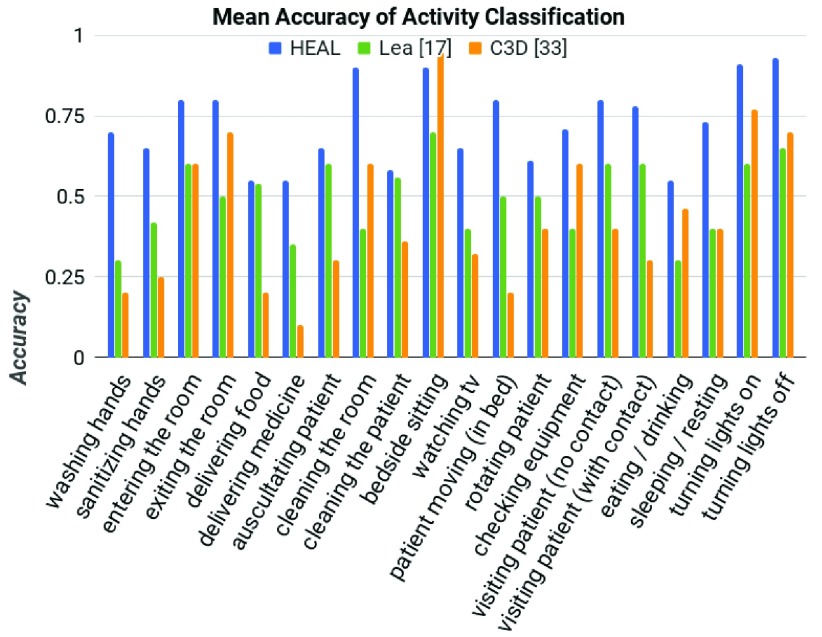
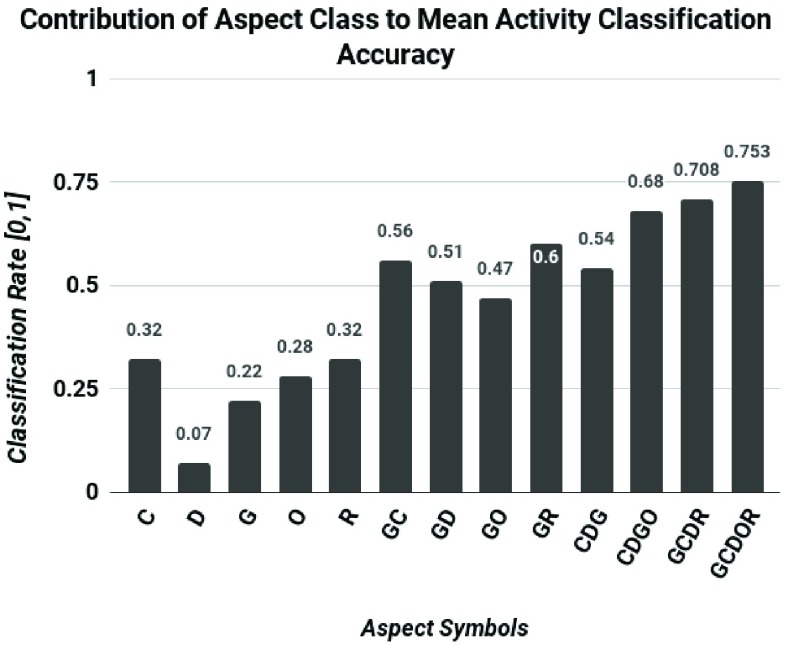
The bar-plot in Figure 16 compares the proposed approach to two methods: the in-house implementation of [17], which classifies activities using RFIDs and a single depth camera via distance feature vectors and a support vector machine (SVM); and [33], which uses C3D features with a linear SVM. Lea et al. [17] use distances to represent person-object interactions for healthcare staff. However, it does not include interactions, roles, or activity duration. The C3D method uses deep convolutional operations, which are unable to capture activities’ contextual information. Neither of these methods encapsulates the subtleties captured by the contextual aspects such as activity regions, interactions, roles, and relative distances and orientations. This information helps to better represent and classify complex activities and allows the proposed solution to outperform the competition. The contextual aspects and their respective contribution for activity classification are shown in Figure 14. HEAL outperforms [17] by mean average classification ranging from 0.01 in “delivering medicine” to 0.31 in “sleeping/resting”. The performance comparison between HEAL and C3D ranges from C3D outperforming HEAL by 0.05 for “bedside sitting” to HEAL outperforming C3D in all other activities ranging from 0.1 for “exiting room” activity to 0.5 for “washing hands” activity.
FIGURE 16.
Average precision classification accuracy of HEAL using contextual aspects compared to the in-house implementation of the methods from [17], which analyzes activities in a neo-natal ICU room the CNN method from [33] (C3D), which is a popular techniques to represent and classify activities.
FIGURE 14.
Contribution of contextual aspects for mean classification accuracy. The aspects are: the interaction cones (C), the activity duration (D), the activity grid location (G), the object detector outputs (O), and the roles (R).
VII. Discussion and Future Directions
We proposed a comprehensive multiview multimodal framework for robustly estimating sanitation qualifiers for events in an ICU. This is achieved by effectively leveraging contextual aspect information. The experimental results indicate that aspects contribute differently to the representation and classification of activities, estimation of event qualifiers, and creation of event logs. The methods rely on effective localization of individuals and objects in the ICU. The strength of HEAL is its multimodal multiview nature, which allow the methods to robustly and effectively represent activities by detecting, tracking, and localizing person-objects and person-person interactions in the ICU. IoT applications and systems for healthcare can benefit from privacy protection practices and methods such as role representation, which omits using face recognition methods. In addition, the automated creation of event and activity logs removes human observers and avoids the manual process of describing room activities and events.
Future Work
Future work will explore applications outside the ICU such as supporting elderly independent living and monitoring and presenting effective logs for concurrent activities and events. Future IoT-based studies will explore the remote access of logs across rooms and facilities, while preserving the privacy of all individuals. The future investigations will include user studies to identify the best possible way to present logs to medical practitioners. Continuous efforts in data collection will allow us to develop and evaluate new methods to analyze activities and events using Convolutional Neural Nets including training and re-evaluating the popular C3D network. In addition, future work will integrate the analysis of concurrent activities: multiple people performing multiple activities and multitasking: single individuals performing multiple activities.
Acknowledgements
The authors thank Dr. Richard Beswick, Paula Gallucci, Mark Mullenary, and Dr. Leilani Price from Santa Barbara Cottage Hospital for support. Special thanks to Professor Victor Fragoso and Archith J. Bency for their feedback.
Funding Statement
This work was supported in part by the Army Research Laboratory (ARL) (the ARL Network Science CTA) under Agreement W911NF-09-2-0053.
References
- [1].Ben Amor B., Su J., and Srivastava A., “Action recognition using rate-invariant analysis of skeletal shape trajectories,” IEEE Trans. Pattern Anal. Mach. Intell., vol. 38, no. 1, pp. 1–13, Jan. 2016. [DOI] [PubMed] [Google Scholar]
- [2].Baccouche M., Mamalet F., Wolf C., Garcia C., and Baskurt A., “Sequential deep learning for human action recognition,” in Proc. Int. Workshop Human Behav. Understand., 2011, pp. 29–39. [Google Scholar]
- [3].Bourdev L. and Malik J., “Poselets: Body part detectors trained using 3D human pose annotations,” in Proc. IEEE Int. Conf. Comput. Vis. (ICCV), Sep./Oct. 2009, pp. 1365–1372. [Google Scholar]
- [4].Chéron G., Laptev I., and Schmid C., “P-CNN: Pose-based CNN features for action recognition,” in Proc. IEEE Int. Conf. Comput. Vis. (ICCV), Jul. 2015, pp. 3218–3226. [Google Scholar]
- [5].Dalal N. and Triggs B., “Histograms of oriented gradients for human detection,” in Proc. IEEE Conf. Comput. Vis. Pattern Recognit. (CVPR), Jun. 2005, pp. 886–893. [Google Scholar]
- [6].de Leo C. and Manjunath B., “Multicamera video summarization and anomaly detection from activity motifs,” ACM Trans. Sensor Netw., vol. 10, no. 2, 2014, Art. no. 27. [Google Scholar]
- [7].Diamond S., Chu E., and Boyd S. (2014). CVXPY: A Python-Embedded Modeling Language for Convex Optimization, Version 0.2. [Online]. Available: http://cvxpy.org/ [PMC free article] [PubMed] [Google Scholar]
- [8].Ester M., Kriegel H.-P., Sander J., and Xu X., “A density-based algorithm for discovering clusters a density-based algorithm for discovering clusters in large spatial databases with noise,” in Proc. KDD, 1996, pp. 226–231. [Google Scholar]
- [9].Evangelopoulos G.et al. , “Multimodal saliency and fusion for movie summarization based on aural, visual, and textual attention,” IEEE Trans. Multimedia, vol. 15, no. 7, pp. 1553–1568, Nov. 2013. [Google Scholar]
- [10].Farhadi A., Endres I., Hoiem D., and Forsyth D., “Describing objects by their attributes,” in Proc. IEEE Conf. Comput. Vis. Pattern Recognit. (CVPR), Jun. 2009, pp. 1778–1785. [Google Scholar]
- [11].Centers for Medicare & Medicaid Services. (1996). The Health Insurance Portability and Accountability Act of 1996 (HIPAA). [Online]. Available: http://www.cms.hhs.gov/hipaa
- [12].Frost and Sullivan. (2016). Finding Top-Line Opportunities in a Bottom-Line Healthcare Market. [Online]. Available: http://www.frost.com/prod/servlet/cio/296601044
- [13].Hoque E. and Stankovic J., “AALO: Activity recognition in smart homes using active learning in the presence of overlapped activities,” in Proc. IEEE Int. Conf. Pervasive Comput. Technol. Healthcare (PervasiveHealth) Workshops, May 2012, pp. 139–146. [Google Scholar]
- [14].Riazul Islam S. M., Kwak D., Humaun Kabir M., Hossain M., and Kwak K.-S., “The Internet of Things for health care: A comprehensive survey,” IEEE Access, vol. 3, pp. 678–708, 2015. [Google Scholar]
- [15].Johnson M. J. and Willsky A. S., “Bayesian nonparametric hidden semi-Markov models,” J. Mach. Learn. Res., vol. 14, no. 1, pp. 673–701, 2013. [Google Scholar]
- [16].Lampert C. H., Nickisch H., and Harmeling S., “Learning to detect unseen object classes by between-class attribute transfer,” in Proc. IEEE Conf. Comput. Vis. Pattern Recognit. (CVPR), Jun. 2009, pp. 951–958. [Google Scholar]
- [17].Lea C., Facker J., Hager G., Taylor R., and Saria S., “3D sensing algorithms towards building an intelligent intensive care unit,” in Proc. Amer. Med. Inform. Assoc. (AMIA), 2013, pp. 136–140. [PMC free article] [PubMed] [Google Scholar]
- [18].Liu A.-A., Su Y.-T., Nie W.-Z., and Kankanhalli M., “Hierarchical clustering multi-task learning for joint human action grouping and recognition,” IEEE Trans. Pattern Anal. Mach. Intell., vol. 39, no. 1, pp. 102–114, Jan. 2017. [DOI] [PubMed] [Google Scholar]
- [19].Nebehay G. and Pflugfelder R., “Clustering of static-adaptive correspondences for deformable object tracking,” in Proc. IEEE Conf. Comput. Vis. Pattern Recognit. (CVPR), Jun. 2015, pp. 2784–2791. [Google Scholar]
- [20].Obdržálek S., Kurillo G., Han J., Abresch T., Bajcsy R., “Real-time human pose detection and tracking for tele-rehabilitation in virtual reality,” Studies Health Technol. Inform., vol. 173, pp. 320–324, 2012. [PubMed] [Google Scholar]
- [21].Oliva A. and Torralba A., “Modeling the shape of the scene: A holistic representation of the spatial envelope,” Int. J. Comput. Vis., vol. 42, no. 3, pp. 145–175, May 2001. [Google Scholar]
- [22].Padoy N., Mateus D., Weinland D., Berger M.-O., and Navab N., “Workflow monitoring based on 3D motion features,” in Proc. IEEE Int. Conf. Comput. Vis. Workshops (ICCV Workshops), Sep./Oct. 2009, pp. 585–592. [Google Scholar]
- [23].Pedregosa F.et al. , “Scikit-learn: Machine learning in Python,” J. Mach. Learn. Res., vol. 12, pp. 2825–2830, Jan. 2011. [Google Scholar]
- [24].Qi J., Yang P., Min G., Amft O., Dong F., and Xu L., “Advanced Internet of Things for personalised healthcare systems: A survey,” Pervasive Mobile Comput., vol. 41, pp. 132–149, Oct. 2017. [Google Scholar]
- [25].Rabiner L. R., “A tutorial on hidden Markov models and selected applications in speech recognition,” Proc. IEEE, vol. 77, no. 2, pp. 257–286, Feb. 1989. [Google Scholar]
- [26].Redmon J., Divvala S., Girshick R., and Farhadi A., “You only look once: Unified, real-time object detection,” in Proc. IEEE Conf. Comput. Vis. Pattern Recognit. (CVPR), 2016, pp. 779–788. [Google Scholar]
- [27].Song J., Jegou H., Snoek C., Tian Q., and Sebe N., “Guest editorial: Large-scale multimedia data retrieval, classification, and understanding,” IEEE Trans. Multimedia, vol. 19, no. 9, pp. 1965–1967, Sep. 2017. [Google Scholar]
- [28].Soran B., Farhadi A., and Shapiro L., “Generating notifications for missing actions: Don’t forget to turn the lights off!” in Proc. IEEE Int. Conf. Comput. Vis. (ICCV), Dec. 2015, pp. 4669–4677. [Google Scholar]
- [29].Sunderrajan S. and Manjunath B. S., “Context-aware hypergraph modeling for re-identification and summarization,” IEEE Trans. Multimedia, vol. 18, no. 1, pp. 51–63, Jan. 2016. [Google Scholar]
- [30].Torres C., Bency A. J., Fried J. C., and Manjunath B. S., “RAM: Role representation and identification from combined appearance and activity maps,” in Proc. ACM/IEEE Int. Conf. Distrib. Smart Cameras (ICDSC), 2017, pp. 144–150. [Google Scholar]
- [31].Torres C., Fragoso V., Hammond S. D., Fried J. C., and Manjunath B. S., “Eye-CU: Sleep pose classification for healthcare using multimodal multiview data,” in Proc. IEEE Winter Conf. Appl. Comput. Vis. (WACV), Mar. 2016, pp. 1–9. [Google Scholar]
- [32].Torres C., Fried J. C., Rose K., and Manjunath B., “Deep Eye-CU (DECU): Summarization of patient motion in the ICU,” in Proc. Eur. Conf. Comput. Vis. (ECCV), 2016, pp. 178–194. [Google Scholar]
- [33].Tran D., Bourdev L., Fergus R., Torresani L., and Paluri M., “Learning spatiotemporal features with 3D convolutional networks,” in Proc. IEEE Int. Conf. Comput. Vis. (ICCV), Dec. 2015, pp. 4489–4497. [Google Scholar]
- [34].Ulutan O., Riggan B. S., Nasrabadi N. M., and Manjunath B. S., “An order preserving bilinear model for person detection in multi-modal data,” in Proc. IEEE Winter Conf. Appl. Comput. Vis. (WACV), 2018, pp. 1160–1169. [Google Scholar]
- [35].Veeriah V., Zhuang N., and Qi G.-J., “Differential recurrent neural networks for action recognition,” in Proc. IEEE Int. Conf. Comput. Vis. (ICCV), Jun. 2015, pp. 4041–4049. [Google Scholar]
- [36].Wang L.et al. , “Temporal segment networks: Towards good practices for deep action recognition,” in Proc. Eur. Conf. Comput. Vis. (ECCV), 2016, pp. 20–36. [Google Scholar]
- [37].Wu C., Khalili A. H., and Aghajan H., “Multiview activity recognition in smart homes with spatio-temporal features,” in Proc. ACM/IEEE Int. Conf. Distrib. Smart Cameras (ICDSC), 2010, pp. 142–149. [Google Scholar]
- [38].Xu J., Jagadeesh V., Ni Z., Sunderrajan S., and Manjunath B. S., “Graph-based topic-focused retrieval in distributed camera network,” IEEE Trans. Multimedia, vol. 15, no. 8, pp. 2046–2057, Dec. 2013. [Google Scholar]
- [39].Yang P.et al. , “Lifelogging data validation model for Internet of Things enabled personalized healthcare,” IEEE Trans. Syst., Man, Cybern., Syst., vol. 48, no. 1, pp. 50–64, Jan. 2016. [Google Scholar]
- [40].Yu H., Li M., Zhang H.-J., and Feng J., “Color texture moments for content-based image retrieval,” in Proc. IEEE Int. Conf. Image Process. (ICIP), Sep. 2002, pp. 929–932. [Google Scholar]
- [41].Zhen X., Zheng F., Shao L., Cao X., and Xu D., “Supervised local descriptor learning for human action recognition,” IEEE Trans. Multimedia, vol. 19, no. 9, pp. 2056–2065, Sep. 2017. [Google Scholar]


