

Summary
More than 25 inherited human disorders are caused by the unstable expansion of repetitive DNA sequences termed short tandem repeats (STRs). A fundamental unresolved question is why some STRs are susceptible to pathologic expansion, whereas thousands of repeat tracts across the human genome are relatively stable. Here, we discover that nearly all disease-associated STRs (daSTRs) are located at boundaries demarcating 3D chromatin domains. We identify a subset of boundaries with markedly higher CpG island density compared to the rest of the genome. daSTRs specifically localize to ultra-high-density CpG island boundaries, suggesting they might be hotspots for epigenetic misregulation or topological disruption upon STR expansion. Fragile X Syndrome patients exhibit severe boundary disruption in a manner that correlates with local loss of CTCF occupancy and the degree of FMR1 silencing. Our data uncover higher-order chromatin architecture as a new dimension in understanding repeat expansion disorders.
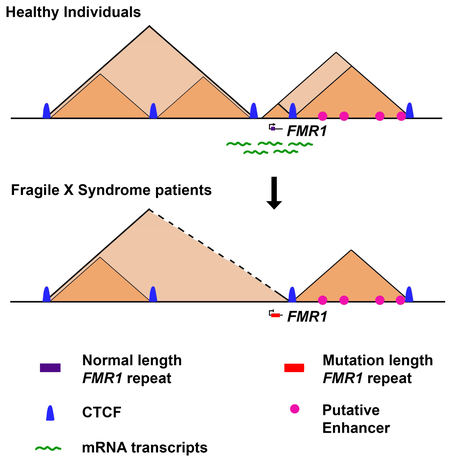
Graphical Abstract
Introduction
Unstable expansion of repetitive DNA sequences termed short tandem repeats (STRs) serves as the mechanistic basis for more than 25 inherited human disorders, including Fragile X syndrome, Huntington’s disease, Amyotrophic lateral sclerosis, and Friedreich’s ataxia (La Spada and Taylor, 2010; McMurray, 2010; Mirkin, 2007; Nelson et al., 2013; Pearson et al., 2005). Patients with unstable repeat expansion disorders suffer from a complex array of symptoms, including: cardiac defects, cataracts, anxiety, hyperactivity, low IQ, social deficits, respiratory defects, and seizures (Orr and Zoghbi, 2007). An increased understanding of the molecular mechanisms governing STR instability would facilitate efforts to develop treatments for repeat expansion disorders.
Healthy individuals have tens of thousands of relatively short STR tracts distributed throughout their genomes (Gymrek and Erlich, 2013; Gymrek et al., 2016; Willems et al., 2017). Normal-length STR tracts are generally stable across generations and among somatic tissues in the same individual (McMurray, 2010). By a process that is poorly understood, a small number of specific normal-length STRs undergo somatic or germline expansion and transition to intermediate, pre-mutation, and mutation (affected) repeat unit tract lengths (Mirkin, 2007; Pearson et al., 2005). A fundamental unresolved question is why STRs at some key genomic locations are susceptible to unstable expansion leading to severe pathology, whereas the majority of normal-length STRs across the genome remains relatively stable.
Disease-associated STR tracts (hereafter referred to as daSTRs) exhibit tremendous diversity in sequence, gene body location, and tract length. daSTRs consist predominantly of a trinucleotide unit, but expandable tetra-, penta-, and hexa-nucleotide repeat sequences have also been reported (Iyer et al., 2015). Pre-mutation and mutation lengths vary widely among the repeat expansion disorders (Iyer et al., 2015; McMurray, 2010). daSTRs also exhibit a wide range of repeat unit sequences and can be localized across the gene body in introns, exons, promoters and 3’/5’ untranslated regions (UTRs) (La Spada and Taylor, 2010). The diversity of daSTR features renders them challenging to study and raises the question of whether a unified model could exist to explain the mechanism(s) governing repeat instability.
Mammalian genomes are organized into a hierarchy of Megabase (Mb)-scale topologically associating domains (TADs) (Dixon et al., 2012; Nora et al., 2012) and smaller, nested subTADs (Dixon et al., 2012; Nora et al., 2012; Phillips-Cremins et al., 2013; Rao et al., 2014). TADs/subTADs are defined as contiguous intervals in the genome in which every pair of loci has an elevated interaction frequency compared to loci outside the domain. Such chromatin domains span >90% of the genome and are thought to create insulated neighborhoods demarcating the search space of specific long-range interactions between enhancers and their target genes (Dowen et al., 2014; Narendra et al., 2015; Symmons et al., 2014). Linker regions termed boundaries separate TADs/subTADs. Boundary disruption has recently been linked to cancer and diseases of limb development (Flavahan et al., 2016; Hnisz et al., 2016; Lupianez et al., 2015), but the role for TAD boundaries in neurological disorders has not yet been reported.
Here, we discover a link between 3D genome folding and repeat expansion disorders. Although daSTRs exhibit tremendous diversity in sequence, gene body location, and mutation-length threshold, we find that nearly all are spatially placed at the boundaries between chromatin domains. Boundaries can be stratified into at least two groups: (1) those with high CpG island density and high occupancy of the architectural protein CTCF and (2) those depleted of CpG island density. We observed that nearly all daSTRs are specifically targeted to CpG island-rich boundaries, but not boundaries devoid of CpG islands or CpG islands internal to domains. We found severe boundary disruption in patients with Fragile X Syndrome. The extent of boundary disruption correlates with the degree of FMR1 silencing and local loss of CTCF occupancy at specific sites. Together, these data support a working model in which the unique genetic, epigenetic, and topological state at a critical subset of 3D chromatin domain boundaries might earmark locations in the genome with increased susceptibility to STR instability in human disease.
Results
daSTRs co-localize with chromatin domain boundaries in human ES cells
To understand higher-order 3D genome folding patterns around daSTR loci, we analyzed Hi-C maps generated from human embryonic stem (ES) cells (Dixon et al., 2015) and human fetal cortical plate tissue (Won et al., 2016). Because the samples are not diseased, we mapped daSTRs to the normal-length repeat tracts found in the hg19 reference genome (Tables S1-S3). To quantitatively determine the precise location of Mb-scale TAD boundaries, we used a well-established method based on the directionality index (DI) test statistic and a hidden Markov model (DI+HMM) (Dixon et al., 2015; Dixon et al., 2012). Consistent with previous reports (Methods), we identified 2,384 TADs in human ES cells using a DI window of 50 (Dixon et al., 2015; Dixon et al., 2012) (Table S4). Surprisingly, we observed that 11 out of 27 daSTR loci exhibit striking co-localization with boundaries of TADs, including FMR1 (Fragile X syndrome), HTT (Huntington’s disease), DMPK (Myotonic dystrophy 1), FXN (Friedreich’s ataxia), C9orf72 (amyotrophic lateral sclerosis) and ATXN1 (spinocerebellar ataxia 1) (Figure 1A, Figure S1A).
Figure 1. Nearly all disease-associated short tandem repeats (daSTRs) susceptible to pathologic instability are positioned at chromatin domain boundaries in human embryonic stem cells.

(A-B) Heatmaps of 40 kilobase binned Hi-C data in human embryonic stem cells. (A) daSTR loci co-localized with TAD (blue) and (B) subTAD (yellow) boundaries. Genes (green) containing the daSTR (red) are shown in the tracks below heatmaps. Domain boundaries at the daSTR are demarcated with a black arrow. (C) Stacked bar plot showing number of daSTRs located at TAD, subTAD, or qualitative domain boundaries in human embryonic stem cells. TAD/subTAD calls were determined using the DI-HMM and 3DNetMod methods as detailed in Methods. See also Figures S1-S3.
We next set out to understand the daSTRs initially classified as distal from TAD boundaries. We used a new method recently developed by our lab, 3DNetMod (Norton et al., 2018), to identify a nested hierarchy of 15,330 subTADs in human ES cells (detailed in the Methods). We detected an additional 11 out of 27 daSTRs at subTAD boundaries, including RUNX2 (cleidocranial dysplasia), ZIC2 (holoprosencephaly) and CACNA1A (spinocerebellar ataxia 6) (Figure 1B, Figure S1B). Notably, 4 of the 5 daSTR loci that did not exhibit adjacency to quantitatively called domain boundaries were still co-localized at visually evident domain borders (Figure S1C-D). We can attribute the false negative boundaries missed by 3DNetMod to our decision to use rigorous thresholds that minimize false positive domain detection. Thus, our observation of 22 out of 27 daSTR loci at human ES cell boundaries is a conservative estimate. Together, our analyses indicate that the majority of daSTRs currently reported as susceptible to unstable expansion in human disease are spatially co-localized to boundaries of 3D genome domains in human ES cells (Figure 1C).
daSTRs localize to boundaries significantly more than normal-length repeats genome-wide
We next set out to determine how the boundary localization of daSTRs compared to the genome-wide expectation of matched normal-length repeats. To ensure a rigorous null model, we compared the daSTR loci in hg19 to all other normal-length STR tracts genome-wide matched by repeat sequence, normal-length range, and gene body placement (Methods, Tables S1-S2). We found that daSTRs are significantly closer to domain boundaries compared to matched repeat tracts (0 bp versus 5,203 bp median; P = 0.00074 Mann Whitney U Test; P = 0.0037, Kolmogorov-Smirnov test) (Figure 2A). Moreover, daSTRs showed significantly higher enrichment at domain boundaries compared to other normal-length, matched repeat sequences (Odds Ratio = 4.77, Fisher’s Exact Test, P = 0.00056, Figure 2B). We confirmed that the effect was largely unchanged (Odds Ratio was =4.23) when performing the Cochran–Mantel–Haenszel test. This striking boundary enrichment is a conservative estimate given that some daSTRs are located at visually apparent domain boundaries missed by the domain calling methods.
Figure 2. Disease-associated STRs (daSTRs) are significantly more likely to be found at domain boundaries compared to matched, normal-length repeats genome-wide.

(A) Empirical distribution of genomic distance from daSTRs and matched repeats to the nearest domain boundary. Of the 27 daSTRs analyzed in this study, CSTB was excluded from the statistical test because normal-length matched repeats were not found in the hg19 reference genome. (B) Bar plots comparing localization of daSTRs and matched repeats at boundaries or not at boundaries. (C) Bootstrapped distributions of percent daSTRs or matched repeats overlapping boundaries. (D) Percent daSTRs overlapping boundaries compared to a null distribution consisting of 10,000 draws of randomly sampled (n=26) matched, normal-length repeats.
We also computed bootstrapped confidence intervals for the percentage of repeat tracts located at boundaries (Methods). The mean percentage of drawn repeats tracts that are boundary-associated increased from 49.5% (bootstrapped 95% CI: 30.3% < μpercent_boundary < 68.6%) in matched repeats compared to 81.1% (bootstrapped 95% CI: 66.2% < μpercent_boundary < 96.0%) in daSTRs, respectively (Figure 2C). Finally, we conducted a randomization test and demonstrated that daSTRs are significantly closer to domain boundaries compared to the genome-wide null distribution of matched repeats (empirical P=0.0001, Figure 2D). Together, our data indicate that loci susceptible to pathologic, unstable repeat expansion are significantly closer to domain boundaries than expected genome-wide by matched, normal-length repeat sequences.
daSTRs co-localize with TADs that are invariant across somatic cell types
We next set out to determine if the strong enrichment of daSTRs at domain boundaries was specific to ES cells or more generalizable across lineages. Due to the read depth and resolution limits of Hi-C data published to date, subTAD boundaries have not been reported genome-wide across multiple human cell types. Therefore, we focused on only Megabase-scale TADs reported in an independent study by Ren and colleagues (Methods) in human ES cells (n=2,502) and ES cell-derived differentiated cells, including: mesendoderm (n=2,479), mesenchymal stem cells (n=2,290), neural progenitor cells (n=2,378), and trophoblast-like cells (n=2,435) (Schmitt et al., 2016). We observed that the majority of daSTRs at the human ES cell TAD boundaries reported in Schmitt et al. were also observed at boundaries invariant across the other four ES cell-derived differentiated cell types (Figure S2). Notably, a large number of daSTRs known to undergo paternal instability (McMurray, 2010; Pearson et al., 2005) co-localized to boundaries in mouse sperm and not in mouse oocytes (Du et al., 2017), suggesting that daSTRs could be at boundaries when germ line expansion takes place (Figure S3). Together, these results indicate that daSTRs are present at boundaries in embryonic and somatic cell lineages and also in at least one stage of spermatogenesis when daSTR instability is paternally inherited.
daSTRs linked to neurological disorders co-localize with boundaries in human cortical tissue
To understand genome folding in a tissue relevant to the subset of STR expansions linked to neurological dysfunction (Table S1), we next analyzed recently published Hi-C data from human fetal cortical plate tissue (Won et al., 2016). We applied the DI+HMM method to detect 2,102 TADs and the DI+HMM and 3DNetMod methods to identify the full sweep of 11,206 subTADs in human cortical plate Hi-C (Methods, Table S4). We focused our analysis on the 23 daSTR loci specifically associated with neurological or neuromuscular disorders. Consistent with our observations in human ES cells, we found 8 out of the 23 neurological daSTR loci were detected at TAD boundaries in human fetal cortical plate tissue (Figure 3A). An additional 8 and 5 daSTRs localized to subTAD and qualitatively apparent boundaries, respectively (Figure 3B, Figure S4A-C). These results indicate that the majority of the neurological daSTRs (21 out of 23) are located at domain boundaries in human cortical tissue (Figure 3C). Thus, although the target cell type(s) for many unstable repeat expansion disorders are unknown, the strong enrichment at boundaries regardless of tissue origin suggests that daSTR co-localization with boundaries might be robust across cell types relevant for the pathology.
Figure 3. Nearly all daSTRs linked to neurological unstable repeat expansion disorders are positioned at chromatin domain boundaries in human fetal cortical plate tissue.

(A-B) Heatmaps of 40 kilobase binned Hi-C data in human fetal cortical plate tissue. (A) daSTR loci co-localized with TAD (blue) and (B) subTAD (yellow) boundaries. Genes (green) containing the daSTR (red) are shown in the tracks below heatmaps. Domain boundaries at the daSTR are demarcated with a black arrow. (C) Stacked bar plot showing number of daSTRs located at TAD, subTAD, or qualitative domain boundaries in human fetal cortical plate tissue. TAD/subTAD calls were determined using the DI-HMM and 3DNetMod methods as detailed in the Methods. See also Figure S4.
Due to the diversity of daSTR attributes (Table S1-3), we sought to understand if a particular repeat class was driving the co-localization with boundaries. We stratified our daSTRs into 4 main groups: (i) a CAG repeat unit in exons or 5’UTR (n=9), (ii) a GCG repeat unit in exons or 5’UTR (n=8), (iii) repeat units in introns (n=5), and (iv) a CTG repeat unit in 3’UTRs (n=3) (Table S3, Methods). Although statistical power was restricted by the small size of the groups, all four classes of daSTRs showed enrichment at boundaries compared to other normal-length repeats matched by sequence and gene body location (Figure S5A). Together, these results indicate that multiple diverse classes of daSTRs are significantly enriched at domain boundaries compared to their matched, normal-length repeat tracts genome-wide.
Boundaries containing daSTRs are characterized by ultra-high density of CpG islands
We next sought to understand the genetic and epigenetic features enriched at chromatin domain boundaries. Consistent with previous reports, we found enrichment for the architectural protein CCCTC-binding factor (CTCF) at human ES cell boundaries compared to loci internal to domains (Figure S6A-B) (Dixon et al., 2012; Nora et al., 2012; Phillips-Cremins et al., 2013). Noteworthy, we also observed a marked increase in the density of CpG islands at boundaries vs. non-boundaries, whereas classic repressive chromatin marks such as H3K9me3 were slightly depleted at boundaries compared to loci internal to domains. Two classes of boundaries emerge: boundaries with high CpG island density and boundaries depleted of CpG islands (Figure S6C-D). These results demonstrate that a subclass of TAD/subTAD boundaries represent hotspots in the genome of ultra-high density of CTCF occupancy and CpG islands.
To understand the relationship between STRs, CpG islands, and boundaries, we stratified boundaries into those with daSTRs, those with normal-length matched repeat tracts, and those that do not contain repeats. Boundaries containing matched normal-length repeat tracts show a striking increase in CpG island density compared to boundaries without repeats (Odds Ratio = 3.92, Fisher’s Exact Test, P = 1.69E-110, Figure 4A-B). Importantly, daSTRs localize with boundaries exhibiting ultra-high CpG island density (blue spheres, Figure 4A). Moreover, boundaries with daSTRs exhibit a dramatic increase in CpG island density even over the rigorous null of boundaries containing matched, normal-length repeats (Odds Ratio = 24.2, Fisher’s Exact Test, P = 1.19E-8, Figure 4C). All four classes of daSTRs co-localize with CpG island-rich boundaries, including STRs that did not specifically contain CpG dinucleotides in the repeat unit sequence (Figure S5B). These data uncover unique genetic and epigenetic features (high CpG island density, high CTCF occupancy) at chromatin boundaries where daSTRs become unstable in repeat expansion disorders.
Figure 4. Boundaries containing disease-associated STRs (daSTRs) are characterized by ultra-high density of CpG islands.

(A) Contour density plot depicting the number of CTCF sites and CpG islands in 120 kb bins representing boundaries with normal-length, matched repeats or those depleted of repeat tracts. Points are colored according to density. daSTRs are marked in blue. (B-C) 2×2 contingency table and Fisher’s Exact Test comparing CpG island density at boundaries with normal-length matched repeats versus (B) no repeat tracts and (C) daSTRs. (D-F) Bar plots comparing localization of daSTRs and matched repeats at or not at boundaries for (D) boundaries with >=3 CpG islands, (E) boundaries depleted of CpG islands and (F) CpG islands not at boundaries. (G-I) Bootstrapped distributions of percent daSTRs or matched repeats overlapping boundaries for (G) boundaries with >=3 CpG islands, (H) boundaries depleted of CpG islands and (I) CpG islands not at boundaries. See also Figures S5-S6.
We hypothesized that the combination of boundary placement and ultra-high density of CpG islands would earmark daSTR versus normal-length STR locations in the genome, whereas boundaries devoid of CpG islands or CpG islands internal to domains would not. To test this hypothesis, we revisited our original statistical tests (Figure 2) after stratifying the genome into (i) boundaries with ≤1 CpG islands, (ii) boundaries with ≥3 CpG islands, and (iii) CpG islands at non-boundary genomic locations. We found that daSTRs are significantly more enriched at CpG-rich domain boundaries compared to normal-length matched STRs (Fisher's Exact Test: Odds Ratio = 10.4 and P = 1.4E-8; Cochran-Mantel-Haenszel Test: Odds Ratio = 6.64; Figure 4D). Importantly, there is no significant difference between matched repeats and daSTRs when the test is performed on CpG island-depleted boundaries (Fisher's Exact Test: Odds Ratio = 0.271 and P = 0.063; Cochran-Mantel-Haenszel Test: Odds Ratio = 0.364; Figure 4E) or CpG islands not at boundaries (Fisher's Exact Test: Odds Ratio = 0.531 and P = 0.57; Cochran-Mantel-Haenszel Test: Odds Ratio = 0.407; Figure 4F). We also computed bootstrapped confidence intervals and observed that the mean percentage of repeat tracts located at CpG island-rich boundaries was 3-fold higher at daSTRS (65.7%; bootstrapped 95% CI: 47.5% < μ percent_boundary < 84.0%) compared to normal-length matched repeats (22.0 %, bootstrapped 95% CI: 5.9% < μ percent_boundary < 38.1%) (Figure 4G). The mean percentage of repeat tracts located at CpG island-depleted boundaries or CpG islands not at boundaries was similar between matched repeats and daSTRs, respectively (Figure 4H, I). Our results are consistent with a working model in which the combination of ultra-high CpG island density and TAD boundary localization earmarks genomic locations susceptible to STR instability.
TAD boundary at the FMR1 daSTR is ablated in Fragile X Syndrome
CpG islands are generally hypomethylated in normal somatic cells and can acquire aberrant hypermethylation in disease (Robertson, 2005). We reasoned that boundaries might be disrupted in unstable repeat expansion disorders given that: (1) daSTRs are hypermethylated in Fragile X syndrome (FXS) and myotonic dystrophy (Burman et al., 1999; Malter et al., 1997; Wohrle et al., 1998; Wohrle et al., 2001) and (2) DNA methylation disrupts occupancy of the key architectural protein CCCTC binding factor (CTCF) (Renda et al., 2007). We performed Chromosome-Conformation-Capture-Carbon-Copy (5C) (Dostie and Dekker, 2007; Dostie et al., 2006) on B-lymphocytes from an FXS patient with ~935 CGG daSTR (GM09237 from the Coriell Cell Repository), his healthy male sibling (GM09236), and a genetically unrelated FXS male with ~645 repeats (GM04025) (Figure 5A, Tables S5-S7).
Figure 5. The TAD boundary at the FMR1 daSTR is ablated in Fragile X Syndrome (FXS).

(A) 5C contact matrices in B-lymphocytes from a male with FXS with a full mutation of ~935 CGG repeats (Coriell Catalog ID GM09237), a healthy male sibling (GM09236), and a genetically unrelated male with FXS and with a full mutation of ~645 CGG repeats in length (GM04025). (B-C) Zoomed-in 5C heatmaps on the FMR1 locus are shown for the B-lymphocytes from an FXS patient and healthy sibling. The log fold change between the diseased and healthy sibling 5C highlights contacts gained (red) and depleted (blue). Green arrows point to loops lost in disease and green brackets annotate the region of increased interaction frequency indicative of boundary disruption. (D) Zoomed-in 5C heatmaps on the FMR1 locus for an additional genetically unrelated patient (645 repeats, Coriell Catalog ID GM04025), and fold change map compared to sample GM09236. (E) 5C contact matrices in human cerebellum tissue from an unaffected individual (Control 1, age of death 62) and from an individual with FXS (Case 1, age of death 60). The FMR1 gene is highlighted in green and the repeat demarcated by a red vertical line. (F) Zoomed-in 5C heatmaps on the FMR1 locus for the brain samples shown in (B). (G-H) A metric quantifying boundary strength, directionality index, is plotted at the FMR1 daSTR boundary (B1) and a boundary distal from FMR1 (B2) for affected and unaffected patient samples. See also Figure S7.
We observed severe topological disruption around the FMR1 daSTR in both FXS patient B cell lines compared to the healthy sibling with normal-length repeats (Figure 5B-D). First, a domain boundary separating FMR1 from the immediate upstream TAD in the healthy sibling was ablated in the ~935 FXS patient (Figure 5B-C, green bracket). Second, the specific loop connecting the TAD immediately upstream of FMR1 was absent in the ~935 FXS patient (Figure 5B-C, upper green arrow). Third, the small subTAD encompassing the FMR1 gene dissolves in the ~935 FXS patient compared to the healthy sibling (Figure 5B-C, lower green arrow). Finally, when plotting the difference between FXS and WT contact maps, it becomes evident that there is a strong depletion and enrichment of contacts between the FMR1 gene and downstream and upstream TADs, respectively (Figures 5B-C, blue and red stripes in fold change maps). All four topological phenotypes occurred in the second FXS patient with ~645 repeats (Figure 5D). These results demonstrate that FMR1 is associated with the downstream TAD in healthy B cells and shifts to the upstream TAD in two patients with FXS.
To understand if the FMR1 topological disruption was generalizable to tissues affected in FXS, we performed 5C in human brain tissue from two unaffected males (Control 1, Control 2, age of death 62, 69) and two males diagnosed with FXS (Case 1, Case 2, age of death 60, 74) (Tables S5-6). We observed the same boundary disruption and large-scale reorganization of the topological environment surrounding the FMR1 daSTR in human brain tissue, including enrichment of contacts between FMR1 and upstream TAD and depletion of contacts across the downstream TAD (Figure 5E-F, Figure S7A-B). We also observed complete boundary ablation in fibroblasts obtained from the same patient who contributed the B cells with ~645 repeats (GM04025) compared to fibroblasts from a race-, gender-, and age-matched individual (GM04024) (Figure S7C-D). We quantified the boundary disruption across cell types and patients by plotting the directionality index (DI) (Figure 5G). FMR1 is biased towards downstream contacts (positive DI) in healthy individuals and transitions to upstream contacts (negative DI) in diseased individuals. Notably, we did not observe any difference in boundary structure between FXS patient and control B cells or brain tissue when examining domains distal to FMR1 (Figure 5H, Figure S7E-F), suggesting that loss of domain integrity in the FXS patient was specific to the genomic location of the daSTR. Together, these results reveal severe topological disruption at the FMR1 daSTR in at least three cell types and at least four patients with FXS.
CTCF occupancy at the FMR1 daSTR is ablated in Fragile X Syndrome
CTCF occupancy is disrupted at boundaries that lose structural integrity in diseases of limb development and cancer (Flavahan et al., 2016; Hnisz et al., 2016; Lupianez et al., 2015). To determine if CTCF was altered in the FXS patient samples, we performed ChIPseq on the B cells from FXS patients with ~935 (GM09237) and ~645 (GM04025) CGG STRs and the healthy male sibling to GM09237 (GM09236) (Tables S5-S6). CTCF occupancy was largely unchanged across the genome in these samples (Figure 6A). Noteworthy, a doublet of occupied CTCF binding sites approximately 100 kb upstream of the FMR1 daSTR in healthy B-lymphocytes was lost in both FXS patient samples (Figure 6B). The CTCF doublet is located directly at the base of the upstream loop and TAD boundary; disruption of these structural features in FXS patients correlated with lost CTCF occupancy (Figure 6C-D). Consistent with the established principles of CTCF motif convergency (Rao et al., 2014), the doublet CTCF sites contained CTCF motifs in the reverse orientation and looped to distal CTCF occupied motifs oriented in the forward direction (Figure 6C-D). We used Sanger sequencing to confirm that the loss of occupancy was not due to single nucleotide polymorphisms at the motifs (Figure 6F). We also noticed that the specific long-range contacts between FMR1 and the downstream TAD were lost in FXS but not mediated by CTCF (Figure 6E, Figure S7G), suggesting that additional architectural proteins are affected by repeat expansion. These results demonstrate that occupancy of a doublet CTCF motif over 100 kb from the FMR1 daSTR is lost in FXS patient samples at the genomic location of boundary disruption.
Figure 6. CTCF occupancy is lost and FMR1 is silenced when the FMR1 daSTR boundary is disrupted in FXS patients.

(A-D) 5C and ChIPseq in B-lymphocytes from a male FXS patient with ~935 CGG repeats (Coriell Catalog ID GM09237), his unaffected malesibling (Coriell Catalog ID GM09236) and a male FXS patient with ~645 CGG repeats (Coriell Catalog ID GM04025). (A) Heatmap of CTCF occupancy. (B) Zoom in on two CTCF peaks with differential occupancy upstream of the FMR1 gene. Red arrow, forward CTCF motif, blue arrow, reverse CTCF motif. (C) Global 5C contact matrix in healthy B-lymphocytes showing topological context of the zoom boxes in (D), (E), and (I). The FMR1 gene is highlighted in green and the repeat with a red vertical line. (D-E) Zoom-ins on disrupted loops (boxed in green) anchored by the differential CTCF sites. A loop to a locus (D) upstream and (E) downstream of the FMR1 daSTR dissolves in for FXS patients compared to the unaffected sibling. (F) Sanger traces of CTCF motifs across samples. (G) Quantitative RT-PCR analysis of FMR1 expression. Error bars, +/− SEM (n=3 independent experiments). (H) Scatterplot of relative gene expression versus boundary strength as assessed by the directionality index at the FMR1 daSTR compared to FMR1 expression. (I) Log fold change map of 5C contacts in diseased vs WT B-lymphocytes (Coriell Catalog ID GM09237 and GM09236, respectively) with GM12878 H3K27ac tracks from ENCODE shown below. The FMR1 gene is highlighted in green and the repeat with a red vertical line. See also Figure S7.
Boundary disruption in Fragile X Syndrome patients correlates with FMR1 silencing
FXS is caused by the loss of the fragile X mental retardation protein (FMRP) encoded by FMR1 (Verkerk et al., 1991). The mutation-length CGG STR acquires DNA methylation, which is thought to cause FMR1 silencing (Park et al., 2015). To understand the relationship between the topological changes and a phenotype that is clinically relevant, we assessed FMR1 expression levels in all FXS patient samples. We also created 5C maps around the FMR1 daSTR in male patients with a mutation-length STR (~477 CGGs; GM06897) but with no silencing of the FMR1 gene compared to their healthy male sibling (normal-length repeats; GM06890) (Figure S7H-K). We found severe reduction of FMR1 expression in all FXS patient samples with boundary disruption, whereas boundaries remained intact if FMR1 was not silenced (Figure 6G-H, Figure S7I-K). These results suggest that boundary disruption correlates with the pathological transcription silencing of FMR1 in FXS.
Finally, to better understand how the FXS topological changes might be connected to FMR1 trancriptional silencing, we mined published ChIPseq data in GM12878 cells for H3K27ac, an established mark of active enhancers (Creyghton et al., 2010). We found increased density of H3K27ac+ putative enhancers in the downstream TAD and minimal H3K27ac+ signal in the TAD upstream of the FMR1 daSTR (Figure 6I). We hypothesize that the landscape of accessible enhancers is markedly altered as FMR1 switches out of the downstream boundary and into the upstream boundary in FXS. It is tempting to speculate that the loss of FMR1 expression in FXS might in part be due to the shift of the gene from the downstream TAD containing active enhancers to the upstream TAD that is largely devoid of active elements.
Discussion
In this work, we set out to gain insight into the epigenetic, genetic, and topological features that distinguish genomic locations known to undergo unstable STR expansion from the tens of thousands of normal-length STR tracts across the human genome. We find that 3D chromatin domain boundaries can be stratified into at least two groups: (1) those with high CpG island density and high occupancy of the architectural protein CTCF and (2) those depleted of CpG island density. We discover that the majority of daSTRs are specifically targeted to CpG island-rich chromatin domain boundaries and not at boundaries depleted of CpG islands nor CpG islands internal to domains. We unexpectedly find that the boundary encompassing the FMR1 daSTR is ablated in FXS. The extent of boundary disruption correlates with loss of occupancy of two specific CTCF sites and silenced FMR1 expression. Together, these results reveal a new link between mutation-length daSTRs and the reconfiguration of 3D genome folding in repeat expansion disorders.
Based on our observations, we hypothesize that the genetic, epigenetic, and topological environment at CpG island-rich boundaries makes STRs unusually susceptible to instability compared to CpG island-depleted boundaries and all non-boundary locations in the genome (Figure 7A). This hypothesis opens up future studies aimed at elucidating the cause and effect relationship between STR instability and boundary integrity. We suggest three possible models to explain our findings: (1) STR instability occurs preferentially at CpG island-rich boundaries that largely remain intact in diseased individuals; boundaries are only disrupted in severe cases, such as the patients examined here, (2) STR instability occurs as a consequence of boundary disruption, or (3) STR instability occurs preferentially at CpG island-rich boundaries and causes topological misconfiguration upon expansion (Figure 7B).
Figure 7. Models describing the possible relationship between CpG islands, 3D genome architecture, repeat instability, and gene expression.

(A) Working model for the role of domain boundaries with high CpG island density on repeat tract instability. (B-C) Schematics outlining possible cause and effect relationships between (B) local topological environment and initial repeat expansion and (C) boundary disruption and FMR1 silencing.
Based on the striking co-localization of daSTRs with boundaries, we hypothesized that repeat expansion could disrupt TAD/subTAD structure. We show that in four unrelated patients, across two cell types and in brain tissue, that the TAD boundary around the FMR1 daSTR is disrupted in FXS. This boundary disruption results in a dramatic re-organization of genome topology around the FMR1 gene, such that it no longer contacts genomic loci in the downstream TAD marked by histone modifications characteristic of active enhancers. Rather, FMR1 merges with the upstream TAD largely devoid of active enhancer marks, suggesting that the topological reconfiguration of the genome could be related to pathologic silencing of the FMR1 gene. Future work might reveal that TAD disruption occurs at other daSTRs and might potentially have downstream implications for which genes are misregulated in unstable repeat expansion disorders. An exciting area of future inquiry will be to elucidate whether boundary disruption causes and/or contributes to FMR1 transcriptional silencing or is only a consequence of FMRlsilencing (Figure 7C).
We additionally show that FMR1 TAD boundary disruption is correlated with disruption of CTCF occupancy. Our observations add a 3D component to the locus-specific evidence that STR instability is linked to alterations of CTCF occupancy (Brock et al., 1999; Cleary et al., 2010; Filippova et al., 2001; Libby et al., 2008; Sopher et al., 2011). Disruption of a CTCF binding site at the Atxn7 locus leads to increased somatic and germline repeat instability in a transgenic mouse model of spinocerebellar ataxia 7 (Libby et al., 2008). In congenital myotonic dystrophy, the region flanking the DM1 gene is hypermethylated and this methylation disrupts binding of adjacent CTCF binding sites (Filippova et al., 2001; Steinbach et al., 1998). Moreover, CpG islands are aberrantly hypermethylated in a subset of cancers that exhibit microsatellite instability (Sharma et al., 2010; You and Jones, 2012). Understanding the cause and effect relationship among boundary disruption, DNA methylation, CTCF occupancy, CpG islands, STR expansion, and gene expression will provide new insight into the molecular mechanisms governing genome instability (Figure 7B-C).
It is important to highlight that our study does not aim to elucidate the specific genetic variants that will predict the individuals who get repeat expansion disorders across a human population. Indeed, many of the daSTR-associated domain boundaries appear to be constitutive across healthy individuals, thus it remains an open question why only a small proportion of human individuals might undergo daSTR expansion at CpG island-rich boundary locations. We posit that STR instability at CpG island-rich boundaries manifests in individuals already genetically pre-disposed to repeat expansion. Studies in model organisms show that mutations in genes encoding key machinery involved in DNA replication, repair, and recombination are linked to STR instability (Iyer et al., 2015; McMurray, 2010; Mirkin, 2007; Pearson et al., 2005). A recent genome-wide association study in Huntington’s disease patients identified a link between genetic variation in DNA repair machinery and the age of onset of the disease (Genetic Modifiers of Huntington's Disease, 2015). In our working model, the individuals with single nucleotide polymorphisms affecting critical genes encoding replication, recombination, or repair machinery may be more likely to develop repeat instability at CpG island-rich domain boundaries than those in the general population (Figure 7A).
STR instability is known to occur in the germline, but tissue-specific somatic variation in STR tract length has been reported (Leeflang et al., 1995; Telenius et al., 1994; Wohrle et al., 1993; Wong et al., 1995; Zhang et al., 1994). Here we find that Mb-scale TADs co-localized with daSTRs are constitutive across the somatic cell types analyzed in this study. Thus, daSTRs localized between constitutive TADs are likely to be placed at boundaries in the specific cell type(s) of origin relevant to each repeat expansion disorders. By contrast, many other daSTRS are co-localized to subTAD boundaries, which are known to be dynamically reconfigured across cell state transitions in development (Norton et al., 2018). As high-resolution Hi-C data are published across a wide range of somatic cell types in coming years, it will be possible to determine if there is a link between somatic STR instability variation and cell type-specific subTAD boundaries. Future studies focused on creating high-resolution genome folding maps at distinct stages in spermatogenesis and oogenesis (Pearson, 2003) will yield insight into the role for boundaries in the developmental timing of germline instability.
Recent high-resolution Chromosome-Conformation-Capture sequencing studies have revealed that TAD boundaries are perturbed in rare human limb malformation diseases (Lupianez et al., 2015) and certain types of cancers (Flavahan et al., 2016; Hnisz et al., 2016), leading to enhancer miswiring and pathogenic disruption of gene expression. Here, we provide evidence suggesting that inherited human disorders driven by unstable repeat expansion might also be linked to patterns of higher-order genome folding. We demonstrate that although daSTRs exhibit diverse features, they share a common spatial placement at chromatin domain boundaries with ultra-high density CpG islands. We discover that boundaries at a specific daSTR in the FMR1 gene are disrupted in FXS in a manner that markedly alters the enhancer landscape accessible to the gene and correlates with the loss of CTCF occupancy and FMR1 silencing. An exciting area of future inquiry will be to evaluate the cause and effect relationship between STR instability and domain boundary disruption, which may illuminate the potential of topology-directed therapy in treating disease.
STAR Methods
CONTACT FOR REAGENT AND RESOURCE SHARING
Further information and requests for reagents may be directed to, and will be fulfilled by the corresponding author Jennifer E. Phillips-Cremins (jcremins@seas.upenn.edu).
EXPERIMENTAL MODEL AND SUBJECT DETAILS
Cell Lines
All cell lines were obtained from the Coriell Institute for Medical Research Cell Repository. B-lymphocytes were grown at 37 °C and 5% CO2 with 15% FBS in RPMI 1640 media with 2 mM glutamine and 1% penicillin-streptomycin-amphotericin. Cells were passaged every 3-4 days. Fibroblasts were grown at 37 °C and 5% CO2 with 15% FBS in MEM Earles media with 2 mM glutamine and 1% penicillin-streptomycin-amphotericin and passaged every 5-7 days. All cell lines used were male.
Frozen human tissue acquisition
Frozen postmortem human cerebellum tissue from two male full mutation cases diagnosed with FXS (Table S5) were obtained from the Medical Investigation of Neurodevelopmental Disorders Institute Brain Repository at the University of California at Davis in Sacramento, CA, under approved IRB protocols (University of California, Davis). Frozen postmortem human cerebellum tissue from two male age-matched controls were obtained frozen from the Miami Brain Tissue Bank.
METHOD DETAILS
CTCF ChIP-seq
CTCF ChIP-seq was performed as previously described (Beagan et al., 2017). 20 million B-lymphocytes were fixed in serum-free RPMI 1640 in 1% formaldehyde for 10 minutes at room temperature. Fixation was terminated by adding glycine to a final concentration of 0.2 M and incubating for 5 minutes at room temperature. Cells were washed once with PBS and lysed by incubating on ice for 10 minutes in Cell lysis buffer (10 mM Tris pH 8.0, 10 mM NaCl, 0.2% NP-40/Igepal, Protease Inhibitor, PMSF) followed by dounce homogenization, using 30 strokes. Lysed cells were pelleted the resulting nuclei were lysed by re-suspending in 500 mL Nuclear Lysis Buffer (50 mM Tris pH 8.0, 10 mM EDTA, 1% SDS, Protease Inhibitor, PMSF) and incubated on ice for 20 min. Samples were sonicated after adding 300 μl IP Dilution Buffer (20 mM Tris pH 8.0, 2 mM EDTA, 150 mM NaCl, 1% Triton X-100, 0.01% SDS, Protease Inhibitor, PMSF) using a QSonica Q800R2 sonicator for 1 hour set at 100% amplitude, with pulse set to 30 seconds on and 30 seconds off. After sonication, samples were pelleted and supernatant was transferred to pre-clearing reactions containing 3.7 mL IP Dilution Buffer, 500 μl Nuclear Lysis Buffer, 175 μl of a 1:1 ratio of ProteinA:ProteinG bead slurry and 50 ug of rabbit IgG. Samples were rotated at 4C for 2 hours. Next, 200 μl was aliquoted from the pre-cleared chromatin as the whole cell extract ‘input’ control. The remainder of the DNA was added to the pre-bound IP reaction consisting of 1mL cold PBS, 20 μl Protein A, 20 μl Protein G, and 10 μl CTCF antibody. Pre-binding of the IP reaction was performed the previous by rotation at 4C. Upon addition of DNA, IP reactions were rotated overnight at 4C.
IP reactions were pelleted and the supernatant was discarded and the bead pellet was washed once with IP Wash Buffer 1 (20mM Tris pH 8, 2mM EDTA, 50 mM NaCl, 1% Triton X-100, 0.1% SDS), twice with High Salt Buffer (20 mM Tris pH 8, 2mM EDTA, 500 mM NaCl, 1% Triton X-100, 0.01% SDS), once with IP Wash Buffer 2 (10 mM Tris pH 8, 1mM EDTA, 0.25 M LiCl, 1% NP-40/Igepal, 1% sodium deoxycholate) and twice with TE buffer (10mM Tris pH 8, 1mM EDTA pH 8). Washed beads were eluted in Elution buffer (100mM NaHCO3, 1%SDS, prepared fresh) by resuspending and then spinning at 7,500 rpm. RNA was degraded with RNAse A and incubation at 65C for 1 hour. To degrade residual DNA, proteinase K was added and all samples were incubated overnight at 65C. DNA was extracted using phenol:chloroform and then precipitated using sodium acetate and ethanol.
Libraries were prepared for sequencing using the NEBNext Ultra II Library Prep Kit for Illumina following the manufacturers protocol. 0.5 ng of DNA was used for starting material, which was quantified using Qubit dsDNA HS Assay Kit. No size selection step was performed after adaptor ligation. Libraries were amplified over 11 PCR cycles using NEBNext Multiplex Oligos for Illumina. High sensitivity electrophoresis was performed on an Agilent 2100 Bioanalyzer to confirm the library size of 250 to 1200 bp. Library concentration was assayed via the KAPA Illumina Library Quantification Kit and diluted to equivalent concentrations. Pooled libraries were sequenced using a 75-cycle paired-end kit on a Illumina NextSeq 500.
5C library generation and sequencing
3C libraries were created as previously described (Rao et al., 2014). Briefly, 4 million cells were collected per library and fixed with 11% formaldehyde to a final concentration of 1% at room temperature for 10 min. Formaldehyde was quenched by addition of 2.5 M glycine to a final concentration of 0.2 M for 5 min. Cells were washed in PBS and cell pellets were then flash-frozen in liquid nitrogen. Cross-linked pellets were lysed (10mM Tris-HCl pH 8.0, 10mM NaCl, 0.2% NP-40, protease inhibitors) for 15 min. After spinning at 2,500g for 5 min, supernatant was discarded and pelleted nuclei were washed again with cellular lysis buffer. Chromatin was solubilized in 50 μl 0.5% SDS and incubated at 62°C for 10 min. SDS was quenched with 145 μl of water and 25 μl of 10% Triton X-100 and incubated at 37°C for 15 min. Nuclei were digested with 100 U of HindIII at 37°C overnight. HindIII was then inactivated at 62°C for 20 min. HindIII digested chromatin was ligated at 16°C for 2 hours in ligation mix (100μl 10% Triton X-100, 120μl 10x NEB T4 DNA Ligation buffer, 12μl 10 mg/ml BSA, 718μl water and 2000U T4 DNA Ligase). After spinning at 2,500g for 5 min, the supernatant was discarded and the pellet was resuspended in nuclear lysis (10mM Tris-Hcl pH 8.0, 0.5M NaCl, 1.0% SDS). Crosslinks were reversed with the addition of Proteinase K and incubated at 65°C for 4 hours, before additional Proteinase K was added and incubated at 65°C overnight. Prior to DNA extraction, RNaseA was used to degrade RNA. DNA was extracted with 350 μl phenol:chloroform and precipitated with sodium acetate and ethanol. Excess salt was removed using Amicon Ultra centrifugal filter unit.
5C libraries were created as previously described (Beagan et al., 2017; Beagan et al., 2016). Double-alternating 5C primers were designed to a 6.4 Mb-sized region around the FMR1 locus in the hg19 reference genome with the my5C primer design software (Table S7). Primers were denatured at 95°C for 5 min and then annealed to the 3C template at 55°C for 16 h. Annealed 5C primers were ligated across HindIII sites via incubation with 10 U of Taq Ligase at 55°C for 1 h. Taq Ligase was then inactivated at 75°C for 10 min. Ligation products were combined with PCR mix (5μl 5x HF buffer, 0.2μl 25mM dNTP, 1.5μl 80μM Emusion forward primers, 1.5μl 80μM Emulsion phosphorylated reverse primers, 0.25μl Phusion polymerase (NEB), 10.55μl water) and amplified in 3 stages: 1 cycle - 95°C for 5 min, 30 cycles - 98°C for 10 s, 62°C for 30 s, 72°C for 30 s, 1 cycle - 72°C for 10 min, 4°C thereafter. Size selection of the 100 bp 5C library was performed using AMPure XP beads and library preparation was performed with NEBNext Ultra DNA Library Prep Kit according to manufacturer protocol (NEB #7370). Libraries were sequenced on Illumina NextSeq 500 according to the manufacturer’s instruction.
Frozen tissue processing
Flash frozen human tissue was first pulverized using the CP01 Cryoprep Manual Pulverizer by transferring 20 mg of frozen tissue into Covaris TT1 tissue tubes, placing the tube in the Cryoprep Pulverizer, and hitting with a hammer 5 times. The pulverized tissue was reconstituted in 10 mL of cold PBS and fixed in 1% formaldehyde for 10 minutes at room temperature. Fixation was terminated by adding glycine to a final concentration of 0.2 M glycine and incubating for 5 minutes at room temperature. The resulting pellet was spun down, the supernatant removed and washed once with PBS. The pellet was then used for CTCF ChIP-seq and 5C in the same manner as with a cell pellet.
Gene expression quantification via qRT-PCR
FMR1 and GAPDH were quantified in all cell lines used using qRT-PCR as previously described (Beagan et al., 2017). Briefly, RNA isolation was performed using the mirVana miRNA isolation kit following manufacturers protocol precisely for total RNA isolation on 500,000 cells. cDNA was prepared for each sample by loading 100 ng of RNA, quantified via Qubit RNA HS assay kit, into the SuperScript First-Strand Synthesis System according to manufacturer’s specifications. A standard curve was generated for each gene by amplifying cDNA with gene-specific primers using a conventional PCR reaction (see Key Resources Table for primer sequences). The amplicon was size-selected and quantified using the Qubit dsRNA HS assay kit. Standards were created with serial dilutions of 200 – 0.0002 pM standards. qRT-PCR reactions on were performed on the Applied Biosystems StepOnePlus system using the Power SybrGreen PCR Master Mix according to manufacturer recommendations. For each qRT-PCR reaction, primers were added to a final concentration of 400 nM and 1 μl of each standard or sample cDNA was loaded. The resulting CT values of the standards were used to generate a standard curve and compute the absolute concentration of mRNA transcripts per condition using 100 ng of RNA in the cDNA reaction.
KEY RESOURCES TABLE.
| REAGENT or RESOURCE | SOURCE | IDENTIFIER |
|---|---|---|
| Antibodies | ||
| Rabbit polyclonal anti-CTCF | Millipore Sigma | Cat# 07-729 |
| IgG from rabbit serum | Sigma | Cat# I8140 |
| Biological Samples | ||
| Human brain tissue from adults diagnosed with FXS | University of California at Davis Medical Investigation of Neurodevelopmental Disorders Institute Brain Repository | http://www.ucdmc.ucdavis.edu/mindinstitute/ |
| Healthy human brain tissue | Miami Brain Tissue Bank | http://miamibrainbank.org/ |
| Chemicals, Peptides, and Recombinant Proteins | ||
| Protein A agarose beads | Thermo Fisher | Cat#15918014 |
| Protein G agarose beads | Thermo Fisher | Cat#15920010 |
| Power SYBR Green PCR Master Mix | Thermo Fisher | Cat#4367660 |
| AMPureXP beads | Beckman Coulter | Cat#A63881 |
| Critical Commercial Assays | ||
| NEBNext® Ultra™ II DNA Library Prep Kit for Illumina® | New England BioLabs | Cat#E7645S |
| NEBNext® Ultra™ DNA Library Prep Kit for Illumina® | New England BioLabs | Cat#E7370S |
| NEBNext Multiplex Oligos for Illumina Set1 | New England BioLabs | Cat#E7335S |
| KAPA Illumina Library Quantification Kit | KAPA Biosystem | Cat#KK4835 |
| mirVana miRNA isolation kit | Lifetech | Cat#AM1560 |
| SuperScript First-Strand Synthesis System | Lifetech | Cat#11904-018 |
| Qubit™ dsDNA HS Assay Kit | Thermo Fisher | Cat#Q32851 |
| Qubit™ RNA HS Assay Kit | Thermo Fisher | Cat#Q32852 |
| Qiagen DNeasy Blood and Tissue Kit | Qiagen | Cat#69504 |
| Qiagen Gel Extraction Kit | Qiagen | Cat#28706 |
| Deposited Data | ||
| Raw and analyzed data | This paper | GEO: GSE111170 |
| Human H1 ESC Hi-C | Dixon, J. R. et al. Chromatin architecture reorganization during stem cell differentiation. Nature 518, 331-336 (2015). | GEO: GSE52457 |
| Human cortical plate Hi-C | Won, H. et al. Chromosome conformation elucidates regulatory relationships in developing human brain. Nature 538, 523-527 (2016). | GEO: GSE77565 |
| Human H1, MES, MSC, NPC, TRO TAD boundaries | Schmitt, A. D. et al. A compendium of chromatin contact maps reveals spatially active regions in the human genome. Cell Rep 17, 2042-2059 (2016). | GEO: GSE87112 |
| Mouse Early Development Hi-C | Du, Z. et al. Allelic reprogramming of 3D chromatin architecture during early mammalian development. Nature 547, 232-235 (2017). | GEO: GSE82185 |
| Human H1-hESC CTCF ChIP-seq | Rosenbloom KR, Sloan CA, Malladi VS, Dreszer TR, Learned K, Kirkup VM, Wong MC, Maddren M, Fang R, Heitner SG, Lee BT, Barber GP, Harte RA, Diekhans M, Long JC, Wilder SP, Zweig AS, Karolchik D, Kuhn RM, Haussler D, Kent WJ. ENCODE data in the UCSC Genome Browser: year 5 update. Nucleic Acids Res. 2013 Jan;41(Database issue):D56-63. | UCSC – wgEncodeEH000085 |
| hg19 CpG island annotation | Karolchik D, Hinrichs AS, Furey TS, Roskin KM, Sugnet CW, Haussler D, Kent WJ. The UCSC Table Browser data retrieval tool. Nucleic Acids Res. 2004 Jan 1;32(Database issue):D493-6. | USCS Table Browser (group: Regulation, track: CpG Islands, table: cpgIslandExt) |
| hg19 RefSeq genes (exons, introns, 5’UTR, 3’UTR) | Pruitt, K. D. et al. RefSeq: an update on mammalian reference sequences. Nucleic Acids Res. 42, D756–63 (2014). Karolchik D, Hinrichs AS, Furey TS, Roskin KM, Sugnet CW, Haussler D, Kent WJ. The UCSC Table Browser data retrieval tool. Nucleic Acids Res. 2004 Jan 1;32(Database issue):D493-6. |
USCS Table Browser (assembly: Feb. 2009 hg19, group: Genes and Gene Predictions, track: RefSeq Genes, table: refGene) |
| Human H1 ESC H3K9me3 | Hawkins RD, Hon GC, Lee LK, Ngo Q et al. Distinct epigenomic landscapes of pluripotent and lineage-committed human cells. Cell Stem Cell 2010 May 7;6(5):479-91. | GEO: GSM605325 |
| GM12878 H3K27acetyl | Rosenbloom KR, Sloan CA, Malladi VS, Dreszer TR, Learned K, Kirkup VM, Wong MC, Maddren M, Fang R, Heitner SG, Lee BT, Barber GP, Harte RA, Diekhans M, Long JC, Wilder SP, Zweig AS, Karolchik D, Kuhn RM, Haussler D, Kent WJ. ENCODE data in the UCSC Genome Browser: year 5 update. Nucleic Acids Res. 2013 Jan;41(Database issue):D56-63. | UCSC - wgEncodeEH000030 |
| Experimental Models: Cell Lines | ||
| Human: EBV transformed B-lymphocyte | Coriell | Cat # GM09236 |
| Human: EBV transformed B-lymphocyte | Coriell | Cat # GM09237 |
| Human: Fibroblast | Coriell | Cat # AG06103 |
| Human: EBV transformed B-lymphocyte | Coriell | Cat # GM04024 |
| Human: Fibroblast | Coriell | Cat # GM04025 |
| Oligonucleotides | ||
| See Supp Table 7 for list of 5C primers | This paper | N/A |
| GAPDH primer F: 5'-CACTAGGCGCTCACTGTTCT-3' R: 5'-GACCAAATCCGTTGACTCCG-3' |
This paper | N/A |
| FMR1 primer F: TACGGCAAATGTGTGCCAAAG R: GTGCTCGCTTTGAGGTGACT |
This paper | N/A |
| Primers for CTCF peak 1 F: TGTTGGCTCTTGAGGGAAACAA R: GTTGCTACAGTCGATGGATGG |
This paper | N/A |
| Primers for CTCF peak 2 F: TCTTGTCTGGCCTGTATGGTT R: CCATATTGCACAATGCAGCTCT |
This paper | N/A |
| Software and Algorithms | ||
| Bowtie/Bowtie2 | Langmead et al., 2009, Langmead and Salzberg, 2012 | http://bowtie-bio.sourceforge.net/ |
| Python | ||
| MACS | Zhang et al., 2008 | https://github.com/taoliu/MACS |
| BEDTools | Quinlan 2014 | http://code.google.com/p/bedtools/ |
| ICED matrix balancing | Imakaev et al., 2012 | https://github.com/hiclib/iced |
| MEME Suite | Bailey et al, 2009 | http://meme-suite.org |
| Quantile normalization | Bolstad et al., 2003 | https://www.ncbi.nlm.nih.gov/pubmed/12538238 |
| deepTools | Ramirez et al., 2016 | https://github.com/deeptools/deepTools |
Sanger sequencing of key regions
From the CTCF ChIP-seq data, we identified three key peaks where CTCF occupancy was differential around FMR1 between samples from healthy controls and those from patients diagnosed with Fragile X Syndrome. We designed primers to PCR amplify an area of around 500 bps around each peak (See Key Resources) and performed conventional PCR on DNA extracted using the Qiagen DNeasy Blood and Tissue kit following manufacturers protocol precisely for total DNA isolation on 500,000 cells. We then gel extracted the PCR products of interest using a Qiagen Gel Extraction Kit following manufacturer’s protocol and submitted them to Genewiz for Sanger sequencing.
QUANTIFICATION AND STATISTICAL ANALYSES
CTCF ChIP-seq data mapping and processing
Paired-end reads were mapped to the reference human genome (hg19) using bowtie (Table S5 and S6A). Reads were analyzed if they had two or fewer reportable alignments. To facilitate the comparison of ChIPseq libraries across cell types, the mapped reads were filtered to remove optical and PCR duplicates and then downsampled to equivalent read numbers across cellular states. Peaks were identified using Model-based Analysis for ChIP Sequencing v2.0 (MACS2) using default parameters. For CTCF ChIPseq, default parameters were used with a p-value cutoff of p < 1E-8 (number of peaks called in Table S5 and S6A).
5C data mapping and processing
Paired-end reads were mapped to a pseudo-reference genome representing all possible 5C primer ligation junctions as previously described (Beagan et al., 2017; Beagan et al., 2016; Phillips-Cremins et al., 2013) (Table S6B). Counts files were assembled by tallying the number of reads for each 5C primer junction. Raw 5C counts distributions were quantile normalized to address minor sequencing depth differences. Next, ligation-junction resolution counts were converted to restriction fragment resolution counts by averaging the reads from the ligation junctions tallied for each restriction fragment. An NxN matrix of fragment-level 5C counts, where N is the number of fragments in the FMR1 region queried by the double alternating primers, was then binned into 4 kb bins with a 12 kb smoothing window using sum-binning. Finally, restriction fragment biases were normalized by applying matrix balancing as previously reported (Imakaev et al., 2012).
Topologically associating domain (TAD) detection
To identify Mb-scale TADs as previously reported (Dixon et al., 2012), we ran the DI-HMM method using a DI window of 50 as previously described on human ES cell Hi-C data previously published (Dixon et al., 2012). In brief, the DI-HMM method computes a directionality index (DI) for genomic intervals that reflects the degree of upstream or downstream bias. A hidden Markov model (HMM) is used to determine “true” upstream or downstream biased states. A domain is initiated at the beginning of a single downstream biased HMM state and ends at the last of an upstream biased HMM state. TAD calls were obtained using a DI parameter of 50, corresponding to a genomic interval of 2 Mb (50 bins times 40 kb resolution). For human cortical plate fetal tissue, Hi-C reads were obtained from (Won et al., 2016) and DI-HMM applied as with human ES cells.
Identification of the nested hierarchy of TADs/subTADs
To identify the nested hierarchy of TADs and subTADs, we used a combination of the DI+HMM method with DI window 50 to yield Mb-scale TADs (Dixon et al., 2012) and our newly published subTAD calling method 3DNetMod (Norton et al., 2016). For human cortical plate tissue, we concatenated DI+HMM calls for TADs at the DI50 window (Table S4C) with 3DNetMod subTAD calls (Table S4E) to get final calls (Table S4G). Parameters used were: plateau size 3, 6MB regions with 4 MB overlap, chaos filter between 0.85, variance thresholds of 0-400 (0.6415789), 401-800 (15.25789), 801-1600 (3.889474), 1601-3000 (0.2578947), 3001-120000 (0). For human ES cell data, we concatenated DI+HMM calls for TADs at the DI50 window (Table S4B) with 3DNetMod subTAD calls (Table S4D) to get final calls (Table S4F). Parameters used were: plateau size 3, 6MB regions with 4 MB overlap, bad region removal of 0.05% or higher zeros in diagonal or > 3 consecutive zeros, chaos filter between 0.85 and 1.1 and variance thresholds of 0-400 kb (0.626), 401-800 kb (6.836), 801-1600 kb (15.5375), 1601-3000 kb (0.3631) and 3001-120000 kb (0).
Methodology for boundary identification
To account redundant domain calls, we merge overlapping boundaries to create a final, non-redundant, unique boundary list (human cortical plate tissue (Table S4I); human ES cells (Table S4H)). We start with the full list of DI+HMM plus 3DNetMod domain calls and compute boundaries as the edge coordinate of each domain +/− 40kb on either side. All boundaries that overlapped and were the same direction (i.e, upstream or downstream) were then merged into a singular new boundary in which the new genomic coordinates were the midpoint +/− 60kb on either side. Therefore, the final size of all boundaries is 120kb. The 120kb boundary size was chosen to address the resolution limit of the Hi-C assays, 40 kb, used in this study.
Cell type specific TAD boundary identification
TAD boundaries from H1 ES cell (Human H1) and H1 ES cell-derived lineages—mesendoderm (MES), mesenchymal stem cells (MSC), neural progenitor cells (NPC), and trophoblast-like cells (TRO)—were obtained from (Schmitt et al., 2016). We used these published Mb-scale TAD calls in Figure S2 because Ren and colleagues used an independent study and an independent TAD calling method to compare TADs across H1 ES cell (Human H1) and H1 ESC-derived lineages—mesendoderm (MES), mesenchymal stem cells (MSC), neural progenitor cells (NPC), and trophoblast-like cells (TRO).
Germline Hi-C map generation
Contact frequency maps from mouse sperm and early murine development were obtained from (Du et al., 2017), GEO Accession number GSE82185.
Selection of disease-associated STR (daSTR) genes for analysis
A total of 29 genes associated with trinucleotide repeat expansion disorders were initially selected for analysis based on previous reports (Tables S1-S3) (Iyer et al., 2015; La Spada and Taylor, 2010). Of these 29, two (TBP, NOP56) were dropped from our analyses because they were located at the far edges of chromosomes beyond where Hi-C can query domains. One final gene (CSTB) was queried for boundary localization but dropped from all analyses that compared daSTRs to matched, normal-length repeats because there are no other repeats matching its sequence, length, and gene body location requirements in hg19. Thus, we were able to generate contact frequency heatmaps around 27 daSTRs, and use 26 daSTRs for statistical analyses.
Identification of the sequence of disease-associated STRs (daSTRs) and matched repeats
For each daSTR tract analyzed in this manuscript, the location of the longest contiguous stretch of the relevant repeat unit in the reported location within the body of the gene of interest was determined using the hg19 reference genome (Table S2). Coordinates of genes, exons, introns, and UTRs were obtained from UCSC Table Browser based on RefSeq genes downloaded in April 15, 2017. For each daSTR, we identified a set of matched repeats. Matched repeats for each daSTR are repeat tracts in hg19 that share the same repeat unit, are located in the same region within the gene body, and are at least 5 repeat units in length, and do not exceed the maximum length for “normal” for that gene (Tables S1-3).
Classifying disease-associated STR (daSTR) genes into 4 key classes
The 26 daSTR tracts were further subdivided into 4 classes based on the repeat unit and location of the repeat in the gene body (Table S3) so that these classes could be analyzed individually. These groups are motivated by prior literature showing that daSTRs with similar sequence and gene body locations behave similarly with respect to number of repeats required for disease and expansion mechanisms (Iyer et al., 2015). The classes are: (1) Repeat unit CAG in exons and 5’UTRs (9 daSTRs), (2) Repeat unit GCG/CGG in exons and 5’UTRs (8 daSTRs), (3) Unique repeat units in introns (5 daSTRs), and (4) CTG introns in 3’UTRs (3 daSTRs).
Determining repeat localization and distance to boundary
Distance from a repeat to the nearest domain boundary was calculated as the minimum distance from either end of the repeat to its closest boundary. Repeats contained within a boundary are given distance of 0 base pairs (bp). A repeat is classified as ‘boundary localized’ if it overlaps the boundary by one or more base pairs.
Determining CpG island, CTCF, and H3K9me3 content across the genome
We partitioned the hg19 reference genome into sequential 120kb bins using bedtools makewindows. Any bin that overlapped a domain boundary present in either H1 ES cell (Human H1), H1 ES cell-derived lineages (mesendoderm (MES), mesenchymal stem cells (MSC), neural progenitor cells (NPC), and trophoblast-like cells (TRO), or human cortical plate neurons was removed from the list of bins. Bins overlapping centromeres, telomeres, gene deserts (areas of the genome > 2 Mb with no genes) and regions not able to be queried (ie, ends of chromosomes) by Hi-C were also removed. The remaining bins are considered non-boundary. This method ensures that both boundaries and non-boundary bins are the same size, and that non-boundary bins are not dominated by hard to query regions of the genome. The number of CpG islands, CTCF peaks and H3K9me3 peaks per H1 ESC 120kb domain boundary and 120kb non-boundary bin was determined using bedtools intersect. Centromeres and telomeres were obtained from USCS Table Browser. Genes were from the RefSeq gene track on USCS Table Browser in May 2017. CpG islands in hg19 were obtained from USCS Table Browser (group: Regulation, track: CpG Islands, table: cpgIslandExt). H1 ES cell CTCF ChIP-seq peaks were obtained from ENCODE (UCSC Accession wgEncodeEH000085). H1 ES cell H3K9me3 was obtained from GEO Accession GSM605325.
Bootstrapped intervals for boundary localization percentage and CpG island density
Bootstrapped confidence intervals for percent of repeats at boundary and CpG island density were constructed by randomly selecting groups of 26 repeats from both the matched repeat set and the daSTRs 1,000 times with replacement and computing the percent of the randomly chosen repeats at a boundary in each sampling. Each group of n=26 null repeats was drawn proportionally from the matched STRs such that all unique combinations of repeat unit and gene body place of daSTRs were represented in the random draws in equal proportion to what is found in the daSTRs group – for example, because 8 of the 26 daSTRs in the group are composed of CAG repeats in exons, in each draw, 8/26 of the null repeats were forced to also be CAG repeats in exons.
Kolmogorov-Smirnov, Fisher’s Exact, and Cochran–Mantel–Haenszel Tests
Statistical analyses were performed using custom scripts in python. The statistical details, including what test is used, the exact value of n, what n represents, and the dispersion and precision measures, can be found in figure titles and captions. Significance was defined when the test statistic (either Kolmogorov-Smirnov (K-S) test, Fisher exact, or randomization test) had a p-value < 0.05. The K-S test and Fisher’s exact test two-tailed p-values were calculated using the scipy statistics module, (scipy.stats.kstest, scip.stats.fisher_exact) in python. To calculate the Fisher's exact test, we compared the daSTRs group to the group of all matched null repeats in hg19 and determined how many repeats were in versus not in boundaries. The randomization test p-value is described in the “Randomization tests for boundary localization and CpG island density” section above. To ensure that our results from the Fisher’s Exact test (Figure 2B, Figure 4D-F) were not artifacts of using a null repeat set that was not weighted similarly to the daSTRs set with respect to STR type group (Table S3), we also randomly created n=1000 subsets of the null repeat set that were weighted similarly to the daSTRs. We then used the Python StatsModel package implementation of the Cochran–Mantel–Haenszel test on the 1000 subsets to calculate a pooled odds ratio of the empirical distribution.
Randomization tests for boundary localization and CpG island density
The null distribution was created by taking 10,000 draws without replacement of n=26 matched repeats, where each draw is proportionally matched to the daSTR group with respect to repeat unit sequence and gene body location, and computing the test statistic each time. Two test statistics were used: (i) the percent of repeats that were located at a boundary (Figure 2) and (ii) the number of CpG islands present in boundaries containing repeats (Figure 4). The distribution of the draws from the normal-length, matched repeats matched that of the daSTRs such that each unique combination of repeat unit and gene body placement is represented in the null group with the same proportions it is represented in the daSTRs group.
Pileups of CTCF/CpG density around domain boundaries
Pileup plots illustrating the number of CTCF/CpG sites centered on the middle of boundaries were generated by counting the number of CTCF/CpG sites in 120kb genomic bins flanking the center of the boundary and averaging this number by the total number of domain boundaries.
Calculation of DI in 5C datasets
To determine the directional bias of the bins containing FMR1 as well as the control region amongst the 5C datasets, we used the Directionality Index (DI) as described previously (Dixon et al., 2012). Briefly, the directionality index is a weighted ratio between the number of 5C reads that map from a given 40kb bin to the upstream region and the downstream region. In order to perform this calculation within the limit imposed by our 5C region size, we used 600KB upstream and downstream in the calculation (the maximum possible for the control region).
DATA AND SOFTWARE AVAILABILITY
All data generated are publicly available on the Gene Expression Omnibus using accession number GSE111170. Custom code used to identify repeats in hg19 and perform statistical tests is available upon request.
Supplementary Material
Heatmaps of 40-kilobase binned Hi-C data in human embryonic stem cells for daSTR loci co-localized with (A) TAD boundaries called using the DI-HMM method, (B) subTAD boundaries called using 3DNetMod, (C) qualitative boundaries, or (D) not at boundary. Genes (green) containing the daSTR (red) are shown in the tracks below heatmaps. Domain boundaries at the daSTR are demarcated with a black arrow.
5C primers used to generate 5C contact maps provided in this study, Related to Figures 5, 6.
Table S1. Characteristics of disease-associated short tandem repeats (daSTRs) and their associated genes, Related to Figures 1-4.
Table S2. Location and sequence of disease-associated short tandem repeats (daSTRs) in hg19, Related to Figure 2.
Table S3. Properties of four classes of disease-associated STRs (daSTRs), Related to Figures 2, 4.
Table S5. Description of cell lines and tissue samples used for 5C and CTCF ChIP-seq, Related to Figures 5, 6.
(A) For daSTRs at boundaries in H1 human embryonic stem cells, the location of that boundary at four embryonic stem cell-derived lineages, including: mesendoderm (MES), mesenchymal stem cells (MSC), neural progenitor cells (NPC), and trophoblast-like cells (TRO) is shown. A window 100kb from the repeat start and end is shaded in green. (B) Number of cell types for which the boundary is conserved for daSTR loci at TAD boundaries in human embryonic stem cells. Boundary calls used for this analysis were reported in Schmitt et al 2016.
Heatmaps of 40-kilobase binned Hi-C data in mouse germline cells and across early murine development in which daSTR is (A) located and (B) not located at a domain boundary in sperm. Genes (green) containing the daSTR (red) are shown in the tracks left of the sperm heatmaps. Domain boundaries at the daSTR in mouse sperm are demarcated with a green arrow. Neon blue line is drawn to indicate genomic location of repeat across heatmaps. For ATXN3 and ATXN10, line is drawn from midpoint of gene since repeat location was unable to be identified in the mm9 reference genome.
Heatmaps of 40-kilobase binned Hi-C data in human cortical plate neurons for daSTR loci co-localized with(A) subTAD boundaries called using 3DNetMod, (B) qualitative boundaries, or (C) not at boundary. Genes (green) containing the daSTR (red) are shown in the tracks below heatmaps. Domain boundaries at the daSTR are demarcated with a black arrow.
(A) Percent of daSTRs overlapping boundaries compared to a randomly sampled null distribution consisting of normal-length repeats stratified by four major repeat classes (detailed in Table S1 and Methods). (B) Contour density plots depicting number of CTCF sites and CpG islands in boundaries containing specific daSTR classes (Table S1). daSTRs are marked in blue.
(A) Distribution of the number of CTCF sites, CpG islands, and H3K9me3 sites in 120 kilobase (kb) bins that are either at H1 ESC boundaries or not at boundaries across the human genome. (B) Pileups of average number of CTCF sites and CpG islands present in domain boundaries genome-wide. Plots are centered on the midpoint of domain boundaries. (C) CpG island density stratifications as a function of the number of CTCF sites in 120 kb bins representing domain boundaries versus loci not at boundaries across the genome. (D) Contour density plot depicting number of CTCF sites versus number of CpG islands per 120kb bin, where bins represent boundaries or loci not at boundaries. Points are colored according to their density.
(A) 5C contact matrices generated from brain tissue from one unaffected individual (Control 2, age of death 69) and one individuals with FXS (Case 2, age of death 74) and a fold change comparison map. For all panels in this figure, the FMR1 gene is highlighted in green and the repeat with a red vertical line. The log fold change between the diseased and healthy sibling highlights contacts gained (red) and contacts depleted (blue). (B) Zoom-ins on the FMR1 locus denoted by the green box in (A). (C) 5C contact matrices generated from fibroblasts from one individual with FXS (Coriell Catalog ID GM04024) and one unaffected gender-, age-, and race-matched control (Coriell Catalog ID AG06103) and a fold change comparison map. (D) Zoom-ins on the FMR1 locus denoted by the green box in (C). (E) Zoom-ins and fold change comparisons (see Figure 5) on a locus ~3Mb downstream of FMR1 are shown for 5C data generated from B-lymphocytes from one unaffected individual (Coriell Catalog ID GM09236) and from two patients with FXS (Coriell Catalog ID GM09237, Gm04025). (F) Same as (E) but for the 5C data generated from human cerebellum tissue from two unaffected individuals (Control 1, Control 2, age of death 62, 69) and from two individuals with FXS (Case 1, Case 2, age of death 60, 74). (G) Zoom-ins on a differential loop (boxed in green) formed between the FMR1 daSTR and a gene 1.5 MB downstream in human brain tissue from two unaffected individuals (Control 1, Control 2, age of death 62, 69) and from two individuals with FXS (Case 1, Case 2, age of death 60, 74), and in fibroblasts derived from one individual with FXS (Coriell Catalog ID GM04024) and from one unaffected gender-, age-, and race-matched control (Coriell Catalog ID AG06103). (H) 5C contact matrices in B-lymphocytes from a male Fragile X Syndrome patient with ~477 CGG repeats (Coriell Catalog ID GM06897) and his unaffected brother (Coriell Catalog ID GM06890). (I) Zoom in and fold change map comparison of the FMR1 locus and denoted by the blue box in (H). (J) Quantitative RT-PCR analysis of FMR1 expression from samples shown in (H). Error bars, +/− SEM (n=3 independent experiments). (K) A metric quantifying boundary strength, directionality index, is plotted at the FMR1 daSTR boundary for both samples.
Genomic coordinates of all TADs, nested subTADs, and domain boundaries generated from read count data, Related to Figures 1-4.
Summary of new ChIP-seq (Sheet A) and 5C (Sheet B) datasets provided in this study, Related to Figures 5, 6.
Disease-associated short tandem repeats co-localize with TAD/subTAD boundaries
Short tandem repeat-localized boundaries exhibit high CpG island density
Boundary co-localized with FMR1 is structurally disrupted in Fragile X Syndrome
Boundary disruption correlates with FMR1 silencing and lost CTCF occupancy
Short tandem repeats associated with human diseases such as Fragile X localize to topological boundaries and affect 3D chromatin structure
Acknowledgements
Jennifer E. Phillips-Cremins is a New York Stem Cell Foundation – Robertson Investigator, an Alfred P. Sloan Foundation Fellow and a primary member of the Epigenetics Institute at the University of Pennsylvania. This research was supported by The New York Stem Cell Foundation (J.E.P.C), the Alfred P. Sloan Foundation (J.E.P.C), the NIH Director’s New Innovator Award from the National Institute of Mental Health (1DP2MH11024701; J.E.P.C), an NIH R01 (GM113929; F.T.)., and a joint NSF-NIGMS grant to support research at the interface of the biological and mathematical sciences (1562665; J.E.P.C).
Footnotes
Declaration of Interests
The authors declare no competing interests.
Publisher's Disclaimer: This is a PDF file of an unedited manuscript that has been accepted for publication. As a service to our customers we are providing this early version of the manuscript. The manuscript will undergo copyediting, typesetting, and review of the resulting proof before it is published in its final citable form. Please note that during the production process errors may be discovered which could affect the content, and all legal disclaimers that apply to the journal pertain.
References
- Bailey TL, Boden M, Buske FA, Frith M, Grant CE, Clementi L, Ren J, Li WW, and Noble WS (2009). MEME SUITE: tools for motif discovery and searching. Nucleic Acids Res. 37, W202–W208. [DOI] [PMC free article] [PubMed] [Google Scholar]
- Bolstad BM, Irizarry RA, Astrand M, and Speed TP (2003). A comparison of normalization methods for high density oligonucleotide array data based on variance and bias. Bioinforma. Oxf. Engl 19, 185–193. [DOI] [PubMed] [Google Scholar]
- American Educational Research Journal (University Microfilms). [Google Scholar]
- Beagan JA, Duong MT, Titus KR, zhou L, Cao Z, Ma J, Lachanski CV, Gillis DR, and Phillips-Cremins JE (2017). YY1 and CTCF orchestrate a 3D chromatin looping switch during early neural lineage commitment. Genome Res. [DOI] [PMC free article] [PubMed] [Google Scholar]
- Beagan JA, Gilgenast TG, Kim J, Plona Z, Norton HK, Hu G, Hsu SC, Shields EJ, Lyu X, Apostolou E, et al. (2016). Local Genome Topology Can Exhibit an Incompletely Rewired 3D-Folding State during Somatic Cell Reprogramming. Cell Stem Cell 18, 611–624. [DOI] [PMC free article] [PubMed] [Google Scholar]
- Brock GJ, Anderson NH, and Monckton DG (1999). Cis-acting modifiers of expanded CAG/CTG triplet repeat expandability: associations with flanking GC content and proximity to CpG islands. Hum Mol Genet 8, 1061–1067. [DOI] [PubMed] [Google Scholar]
- Burman RW, Yates PA, Green LD, Jacky PB, Turker MS, and Popovich BW (1999). Hypomethylation of an expanded FMR1 allele is not associated with a global DNA methylation defect. Am J Hum Genet 65, 1375–1386. [DOI] [PMC free article] [PubMed] [Google Scholar]
- Cleary JD, Tome S, Lopez Castel A, Panigrahi GB, Foiry L, Hagerman KA, Sroka H, Chitayat D, Gourdon G, and Pearson CE (2010). Tissue- and age-specific DNA replication patterns at the CTG/CAG-expanded human myotonic dystrophy type 1 locus. Nat Struct Mol Biol 17, 1079–1087. [DOI] [PubMed] [Google Scholar]
- Creyghton MP, Cheng AW, Welstead GG, Kooistra T, Carey BW, Steine EJ, Hanna J, Lodato MA, Frampton GM, Sharp PA, et al. (2010). Histone H3K27ac separates active from poised enhancers and predicts developmental state. Proc Natl Acad Sci U S A 107, 21931–21936. [DOI] [PMC free article] [PubMed] [Google Scholar]
- Dixon JR, Jung I, Selvaraj S, Shen Y, Antosiewicz-Bourget JE, Lee AY, Ye Z, Kim A, Rajagopal N, Xie W, et al. (2015). Chromatin architecture reorganization during stem cell differentiation. Nature 518, 331–336. [DOI] [PMC free article] [PubMed] [Google Scholar]
- Dixon JR, Selvaraj S, Yue F, Kim A, Li Y, Shen Y, Hu M, Liu JS, and Ren B (2012). Topological domains in mammalian genomes identified by analysis of chromatin interactions. Nature 485, 376–380. [DOI] [PMC free article] [PubMed] [Google Scholar]
- Dostie J, and Dekker J (2007). Mapping networks of physical interactions between genomic elements using 5C technology. Nat Protoc 2, 988–1002. [DOI] [PubMed] [Google Scholar]
- Dostie J, Richmond TA, Arnaout RA, Selzer RR, Lee WL, Honan TA, Rubio ED, Krumm A, Lamb J, Nusbaum C, et al. (2006). Chromosome Conformation Capture Carbon Copy (5C): a massively parallel solution for mapping interactions between genomic elements. Genome Res 16, 1299–1309. [DOI] [PMC free article] [PubMed] [Google Scholar]
- Dowen JM, Fan ZP, Hnisz D, Ren G, Abraham BJ, Zhang LN, Weintraub AS, Schuijers J, Lee TI, Zhao K, et al. (2014). Control of cell identity genes occurs in insulated neighborhoods in mammalian chromosomes. Cell 159, 374–387. [DOI] [PMC free article] [PubMed] [Google Scholar]
- Du Z, Zheng H, Huang B, Ma R, Wu J, Zhang X, He J, Xiang Y, Wang Q, Li Y, et al. (2017). Allelic reprogramming of 3D chromatin architecture during early mammalian development. Nature 547, 232–235. [DOI] [PubMed] [Google Scholar]
- Filippova GN, Thienes CP, Penn BH, Cho DH, Hu YJ, Moore JM, Klesert TR, Lobanenkov VV, and Tapscott SJ (2001). CTCF-binding sites flank CTG/CAG repeats and form a methylation-sensitive insulator at the DM1 locus. Nat Genet 28, 335–343. [DOI] [PubMed] [Google Scholar]
- Flavahan WA, Drier Y, Liau BB, Gillespie SM, Venteicher AS, Stemmer-Rachamimov AO, Suva ML, and Bernstein BE (2016). Insulator dysfunction and oncogene activation in IDH mutant gliomas. Nature 529, 110–114. [DOI] [PMC free article] [PubMed] [Google Scholar]
- Genetic Modifiers of Huntington's Disease, C. (2015). Identification of Genetic Factors that Modify Clinical Onset of Huntington's Disease. Cell 162, 516–526. [DOI] [PMC free article] [PubMed] [Google Scholar]
- Gymrek M, and Erlich Y (2013). Profiling short tandem repeats from short reads. Methods Mol Biol 1038, 113–135. [DOI] [PubMed] [Google Scholar]
- Gymrek M, Willems T, Guilmatre A, Zeng H, Markus B, Georgiev S, Daly MJ, Price AL, Pritchard JK, Sharp AJ, et al. (2016). Abundant contribution of short tandem repeats to gene expression variation in humans. Nat Genet 48, 22–29. [DOI] [PMC free article] [PubMed] [Google Scholar]
- Hnisz D, Weintraub AS, Day DS, Valton AL, Bak RO, Li CH, Goldmann J, Lajoie BR, Fan ZP, Sigova AA, et al. (2016). Activation of proto-oncogenes by disruption of chromosome neighborhoods. Science 351, 1454–1458. [DOI] [PMC free article] [PubMed] [Google Scholar]
- Imakaev M, Fudenberg G, McCord RP, Naumova N, Goloborodko A, Lajoie BR, Dekker J, and Mirny LA (2012). Iterative correction of Hi-C data reveals hallmarks of chromosome organization. Nat Methods 9, 999–1003. [DOI] [PMC free article] [PubMed] [Google Scholar]
- Iyer RR, Pluciennik A, Napierala M, and Wells RD (2015). DNA triplet repeat expansion and mismatch repair. Annu Rev Biochem 84, 199–226. [DOI] [PMC free article] [PubMed] [Google Scholar]
- La Spada AR, and Taylor JP (2010). Repeat expansion disease: progress and puzzles in disease pathogenesis. Nat Rev Genet 11, 247–258. [DOI] [PMC free article] [PubMed] [Google Scholar]
- Leeflang EP, Zhang L, Tavare S, Hubert R, Srinidhi J, MacDonald ME, Myers RH, de Young M, Wexler NS, Gusella JF, et al. (1995). Single sperm analysis of the trinucleotide repeats in the Huntington's disease gene: quantification of the mutation frequency spectrum. Hum Mol Genet 4, 1519–1526. [DOI] [PubMed] [Google Scholar]
- Libby RT, Hagerman KA, Pineda VV, Lau R, Cho DH, Baccam SL, Axford MM, Cleary JD, Moore JM, Sopher BL, et al. (2008). CTCF cis-regulates trinucleotide repeat instability in an epigenetic manner: a novel basis for mutational hot spot determination. PLoS Genet 4, e1000257. [DOI] [PMC free article] [PubMed] [Google Scholar]
- Lupianez DG, Kraft K, Heinrich V, Krawitz P, Brancati F, Klopocki E, Horn D, Kayserili H, Opitz JM, Laxova R, et al. (2015). Disruptions of topological chromatin domains cause pathogenic rewiring of gene-enhancer interactions. Cell 161, 1012–1025. [DOI] [PMC free article] [PubMed] [Google Scholar]
- Malter HE, Iber JC, Willemsen R, de Graaff E, Tarleton JC, Leisti J, Warren ST, and Oostra BA (1997). Characterization of the full fragile X syndrome mutation in fetal gametes. Nat Genet 15, 165–169. [DOI] [PubMed] [Google Scholar]
- McMurray CT (2010). Mechanisms of trinucleotide repeat instability during human development. Nat Rev Genet 11, 786–799. [DOI] [PMC free article] [PubMed] [Google Scholar]
- Mirkin SM (2007). Expandable DNA repeats and human disease. Nature 447, 932–940. [DOI] [PubMed] [Google Scholar]
- Narendra V, Rocha PP, An D, Raviram R, Skok JA, Mazzoni EO, and Reinberg D (2015). Transcription. CTCF establishes discrete functional chromatin domains at the Hox clusters during differentiation. Science 347, 1017–1021. [DOI] [PMC free article] [PubMed] [Google Scholar]
- Nelson DL, Orr HT, and Warren ST (2013). The unstable repeats--three evolving faces of neurological disease. Neuron 77, 825–843. [DOI] [PMC free article] [PubMed] [Google Scholar]
- Nora EP, Lajoie BR, Schulz EG, Giorgetti L, Okamoto I, Servant N, Piolot T, van Berkum NL, Meisig J, Sedat J, et al. (2012). Spatial partitioning of the regulatory landscape of the X-inactivation centre. Nature 485, 381–385. [DOI] [PMC free article] [PubMed] [Google Scholar]
- Norton HK, Emerson DJ, Huang H, Kim J, Titus KR, Gu S, Bassett DS, and Phillips-Cremins JE (2018). Detecting hierarchical genome folding with network modularity. Nat Methods 15, 119–122. [DOI] [PMC free article] [PubMed] [Google Scholar]
- Norton HK, Huang H, Emerson DJ, Kim J, Gu S, Bassett DS, and Phillips-Cremins JE (2016). Detecting hierarchical 3-D genome domain reconfiguration with network modularity. bioRxiv. [DOI] [PMC free article] [PubMed] [Google Scholar]
- Orr HT, and Zoghbi HY (2007). Trinucleotide repeat disorders. Annu Rev Neurosci 30, 575–621. [DOI] [PubMed] [Google Scholar]
- Park CY, Halevy T, Lee DR, Sung JJ, Lee JS, Yanuka O, Benvenisty N, and Kim DW (2015). Reversion of FMR1 Methylation and Silencing by Editing the Triplet Repeats in Fragile X iPSC-Derived Neurons. Cell Rep 13, 234–241. [DOI] [PubMed] [Google Scholar]
- Pearson CE (2003). Slipping while sleeping? Trinucleotide repeat expansions in germ cells. Trends Mol Med 9, 490–495. [DOI] [PubMed] [Google Scholar]
- Pearson CE, Nichol Edamura K, and Cleary JD (2005). Repeat instability: mechanisms of dynamic mutations. Nat Rev Genet 6, 729–742. [DOI] [PubMed] [Google Scholar]
- Phillips-Cremins JE, Sauria ME, Sanyal A, Gerasimova TI, Lajoie BR, Bell JS, Ong CT, Hookway TA, Guo C, Sun Y, et al. (2013). Architectural protein subclasses shape 3D organization of genomes during lineage commitment. Cell 153, 1281–1295. [DOI] [PMC free article] [PubMed] [Google Scholar]
- Rao SS, Huntley MH, Durand NC, Stamenova EK, Bochkov ID, Robinson JT, Sanborn AL, Machol I, Omer AD, Lander ES, et al. (2014). A 3D map of the human genome at kilobase resolution reveals principles of chromatin looping. Cell 159, 1665–1680. [DOI] [PMC free article] [PubMed] [Google Scholar]
- Renda M, Baglivo I, Burgess-Beusse B, Esposito S, Fattorusso R, Felsenfeld G, and Pedone PV (2007). Critical DNA binding interactions of the insulator protein CTCF: a small number of zinc fingers mediate strong binding, and a single finger-DNA interaction controls binding at imprinted loci. J Biol Chem 282, 33336–33345. [DOI] [PubMed] [Google Scholar]
- Robertson KD (2005). DNA methylation and human disease. Nat Rev Genet 6, 597–610. [DOI] [PubMed] [Google Scholar]
- Schmitt AD, Hu M, Jung I, Xu Z, Qiu Y, Tan CL, Li Y, Lin S, Lin Y, Barr CL, et al. (2016). A Compendium of Chromatin Contact Maps Reveals Spatially Active Regions in the Human Genome. Cell Rep 17, 2042–2059. [DOI] [PMC free article] [PubMed] [Google Scholar]
- Sharma S, Kelly TK, and Jones PA (2010). Epigenetics in cancer. Carcinogenesis 31, 27–36. [DOI] [PMC free article] [PubMed] [Google Scholar]
- Sopher BL, Ladd PD, Pineda VV, Libby RT, Sunkin SM, Hurley JB, Thienes CP, Gaasterland T, Filippova GN, and La Spada AR (2011). CTCF regulates ataxin-7 expression through promotion of a convergently transcribed, antisense noncoding RNA. Neuron 70, 1071–1084. [DOI] [PMC free article] [PubMed] [Google Scholar]
- Steinbach P, Glaser D, Vogel W, Wolf M, and Schwemmle S (1998). The DMPK gene of severely affected myotonic dystrophy patients is hypermethylated proximal to the largely expanded CTG repeat. Am J Hum Genet 62, 278–285. [DOI] [PMC free article] [PubMed] [Google Scholar]
- Symmons O, Uslu VV, Tsujimura T, Ruf S, Nassari S, Schwarzer W, Ettwiller L, and Spitz F (2014). Functional and topological characteristics of mammalian regulatory domains. Genome Res 24, 390–400. [DOI] [PMC free article] [PubMed] [Google Scholar]
- Telenius H, Kremer B, Goldberg YP, Theilmann J, Andrew SE, Zeisler J, Adam S, Greenberg C, Ives EJ, Clarke LA, et al. (1994). Somatic and gonadal mosaicism of the Huntington disease gene CAG repeat in brain and sperm. Nat Genet 6, 409–414. [DOI] [PubMed] [Google Scholar]
- Verkerk AJ, Pieretti M, Sutcliffe JS, Fu YH, Kuhl DP, Pizzuti A, Reiner O, Richards S, Victoria MF, Zhang FP, et al. (1991). Identification of a gene (FMR-1) containing a CGG repeat coincident with a breakpoint cluster region exhibiting length variation in fragile X syndrome. Cell 65, 905–914. [DOI] [PubMed] [Google Scholar]
- Willems T, Zielinski D, Yuan J, Gordon A, Gymrek M, and Erlich Y (2017). Genome-wide profiling of heritable and de novo STR variations. Nat Methods 14, 590–592. [DOI] [PMC free article] [PubMed] [Google Scholar]
- Wohrle D, Hennig I, Vogel W, and Steinbach P (1993). Mitotic stability of fragile X mutations in differentiated cells indicates early post-conceptional trinucleotide repeat expansion. Nat Genet 4, 140–142. [DOI] [PubMed] [Google Scholar]
- Wohrle D, Salat U, Glaser D, Mucke J, Meisel-Stosiek M, Schindler D, Vogel W, and Steinbach P (1998). Unusual mutations in high functioning fragile X males: apparent instability of expanded unmethylated CGG repeats. J Med Genet 35, 103–111. [DOI] [PMC free article] [PubMed] [Google Scholar]
- Wohrle D, Salat U, Hameister H, Vogel W, and Steinbach P (2001). Demethylation, reactivation, and destabilization of human fragile X full-mutation alleles in mouse embryocarcinoma cells. Am J Hum Genet 69, 504–515. [DOI] [PMC free article] [PubMed] [Google Scholar]
- Won H, de la Torre-Ubieta L, Stein JL, Parikshak NN, Huang J, Opland CK, Gandal MJ, Sutton GJ, Hormozdiari F, Lu D, et al. (2016). Chromosome conformation elucidates regulatory relationships in developing human brain. Nature 538, 523–527. [DOI] [PMC free article] [PubMed] [Google Scholar]
- Wong LJ, Ashizawa T, Monckton DG, Caskey CT, and Richards CS (1995). Somatic heterogeneity of the CTG repeat in myotonic dystrophy is age and size dependent. Am J Hum Genet 56, 114–122. [PMC free article] [PubMed] [Google Scholar]
- You JS, and Jones PA (2012). Cancer genetics and epigenetics: two sides of the same coin? Cancer Cell 22, 9–20. [DOI] [PMC free article] [PubMed] [Google Scholar]
- Zhang L, Leeflang EP, Yu J, and Arnheim N (1994). Studying human mutations by sperm typing: instability of CAG trinucleotide repeats in the human androgen receptor gene. Nat Genet 7, 531–535. [DOI] [PubMed] [Google Scholar]
Associated Data
This section collects any data citations, data availability statements, or supplementary materials included in this article.
Supplementary Materials
Heatmaps of 40-kilobase binned Hi-C data in human embryonic stem cells for daSTR loci co-localized with (A) TAD boundaries called using the DI-HMM method, (B) subTAD boundaries called using 3DNetMod, (C) qualitative boundaries, or (D) not at boundary. Genes (green) containing the daSTR (red) are shown in the tracks below heatmaps. Domain boundaries at the daSTR are demarcated with a black arrow.
5C primers used to generate 5C contact maps provided in this study, Related to Figures 5, 6.
Table S1. Characteristics of disease-associated short tandem repeats (daSTRs) and their associated genes, Related to Figures 1-4.
Table S2. Location and sequence of disease-associated short tandem repeats (daSTRs) in hg19, Related to Figure 2.
Table S3. Properties of four classes of disease-associated STRs (daSTRs), Related to Figures 2, 4.
Table S5. Description of cell lines and tissue samples used for 5C and CTCF ChIP-seq, Related to Figures 5, 6.
(A) For daSTRs at boundaries in H1 human embryonic stem cells, the location of that boundary at four embryonic stem cell-derived lineages, including: mesendoderm (MES), mesenchymal stem cells (MSC), neural progenitor cells (NPC), and trophoblast-like cells (TRO) is shown. A window 100kb from the repeat start and end is shaded in green. (B) Number of cell types for which the boundary is conserved for daSTR loci at TAD boundaries in human embryonic stem cells. Boundary calls used for this analysis were reported in Schmitt et al 2016.
Heatmaps of 40-kilobase binned Hi-C data in mouse germline cells and across early murine development in which daSTR is (A) located and (B) not located at a domain boundary in sperm. Genes (green) containing the daSTR (red) are shown in the tracks left of the sperm heatmaps. Domain boundaries at the daSTR in mouse sperm are demarcated with a green arrow. Neon blue line is drawn to indicate genomic location of repeat across heatmaps. For ATXN3 and ATXN10, line is drawn from midpoint of gene since repeat location was unable to be identified in the mm9 reference genome.
Heatmaps of 40-kilobase binned Hi-C data in human cortical plate neurons for daSTR loci co-localized with(A) subTAD boundaries called using 3DNetMod, (B) qualitative boundaries, or (C) not at boundary. Genes (green) containing the daSTR (red) are shown in the tracks below heatmaps. Domain boundaries at the daSTR are demarcated with a black arrow.
(A) Percent of daSTRs overlapping boundaries compared to a randomly sampled null distribution consisting of normal-length repeats stratified by four major repeat classes (detailed in Table S1 and Methods). (B) Contour density plots depicting number of CTCF sites and CpG islands in boundaries containing specific daSTR classes (Table S1). daSTRs are marked in blue.
(A) Distribution of the number of CTCF sites, CpG islands, and H3K9me3 sites in 120 kilobase (kb) bins that are either at H1 ESC boundaries or not at boundaries across the human genome. (B) Pileups of average number of CTCF sites and CpG islands present in domain boundaries genome-wide. Plots are centered on the midpoint of domain boundaries. (C) CpG island density stratifications as a function of the number of CTCF sites in 120 kb bins representing domain boundaries versus loci not at boundaries across the genome. (D) Contour density plot depicting number of CTCF sites versus number of CpG islands per 120kb bin, where bins represent boundaries or loci not at boundaries. Points are colored according to their density.
(A) 5C contact matrices generated from brain tissue from one unaffected individual (Control 2, age of death 69) and one individuals with FXS (Case 2, age of death 74) and a fold change comparison map. For all panels in this figure, the FMR1 gene is highlighted in green and the repeat with a red vertical line. The log fold change between the diseased and healthy sibling highlights contacts gained (red) and contacts depleted (blue). (B) Zoom-ins on the FMR1 locus denoted by the green box in (A). (C) 5C contact matrices generated from fibroblasts from one individual with FXS (Coriell Catalog ID GM04024) and one unaffected gender-, age-, and race-matched control (Coriell Catalog ID AG06103) and a fold change comparison map. (D) Zoom-ins on the FMR1 locus denoted by the green box in (C). (E) Zoom-ins and fold change comparisons (see Figure 5) on a locus ~3Mb downstream of FMR1 are shown for 5C data generated from B-lymphocytes from one unaffected individual (Coriell Catalog ID GM09236) and from two patients with FXS (Coriell Catalog ID GM09237, Gm04025). (F) Same as (E) but for the 5C data generated from human cerebellum tissue from two unaffected individuals (Control 1, Control 2, age of death 62, 69) and from two individuals with FXS (Case 1, Case 2, age of death 60, 74). (G) Zoom-ins on a differential loop (boxed in green) formed between the FMR1 daSTR and a gene 1.5 MB downstream in human brain tissue from two unaffected individuals (Control 1, Control 2, age of death 62, 69) and from two individuals with FXS (Case 1, Case 2, age of death 60, 74), and in fibroblasts derived from one individual with FXS (Coriell Catalog ID GM04024) and from one unaffected gender-, age-, and race-matched control (Coriell Catalog ID AG06103). (H) 5C contact matrices in B-lymphocytes from a male Fragile X Syndrome patient with ~477 CGG repeats (Coriell Catalog ID GM06897) and his unaffected brother (Coriell Catalog ID GM06890). (I) Zoom in and fold change map comparison of the FMR1 locus and denoted by the blue box in (H). (J) Quantitative RT-PCR analysis of FMR1 expression from samples shown in (H). Error bars, +/− SEM (n=3 independent experiments). (K) A metric quantifying boundary strength, directionality index, is plotted at the FMR1 daSTR boundary for both samples.
Genomic coordinates of all TADs, nested subTADs, and domain boundaries generated from read count data, Related to Figures 1-4.
Summary of new ChIP-seq (Sheet A) and 5C (Sheet B) datasets provided in this study, Related to Figures 5, 6.