

Abstract
To explore the correlation between glycosaminoglycan (GAG) levels and mucopolysaccharidosis (MPS) type, we have evaluated the GAG levels in blood of MPS II, III, IVA, and IVB and urine of MPS IVA, IVB, and VI by tandem mass spectrometry. Dermatan sulfate (DS), heparan sulfate (HS), keratan sulfate (KS; mono-sulfated KS, di-sulfated KS), and the ratio of di-sulfated KS in total KS were measured.
Patients with untreated MPS II had higher levels of DS and HS in blood while untreated MPS III had higher levels of HS in blood than age-matched controls. Untreated MPS IVA had higher levels of KS in blood and urine than age-matched controls. The ratio of blood di-sulfated KS/total KS in untreated MPS IVA was constant and higher than that in controls for children up to 10 years of age. The ratio of urine di-sulfated KS/total KS in untreated MPS IVA was also higher than that in age-matched controls, but the ratio in untreated MPS IVB was lower than controls. ERT reduced blood DS and HS in MPS II, and urine KS in MPS IVA patients, although GAGs levels remained higher than the observed in age-matched controls. ERT did not change blood KS levels in MPS IVA. MPS VI under ERT still had an elevation of urine DS level compared to age-matched controls. There was a positive correlation between blood and urine KS in untreated MPS IVA patients but not in MPS IVA patients treated with ERT. Blood and urine KS levels were secondarily elevated in MPS II and VI, respectively.
Overall, measurement of GAG levels in blood and urine is useful for diagnosis of MPS, while urine KS is not a useful biomarker for monitoring therapeutic efficacy in MPS IVA.
Keywords: mucopolysaccharidoses, glycosaminoglycans, LC/MS, chondroitin sulfate, dermatan sulfate, heparan sulfate, keratan sulfate, hyaluronan
1. Introduction
Mucopolysaccharidoses (MPS) are a group of inherited metabolic diseases caused by the deficiency of enzymes required to degrade glycosaminoglycans (GAGs) in the lysosome. GAGs are sulfated polysaccharides comprising repeated disaccharides, uronic acid (or galactose) and hexosamines including chondroitin sulfate (CS), dermatan sulfate (DS), heparan sulfate (HS), and keratan sulfate (KS). Hyaluronan is an exception in the GAG family because it is a non-sulfated polysaccharide. The lysosomal enzymes play an important role in degrading specific GAGs [1]. Seven types of MPS are known due to deficiencies of eleven different enzymes. These MPSs are MPS I (Hurler, Hurler-Scheie, and Scheie syndrome), MPS II (Hunter syndrome), MPS IIIA (Sanfilippo A syndrome), MPS IIIB (Sanfilippo B syndrome), MPS IIIC (Sanfilippo C syndrome), MPS IIID (Sanfilippo D syndrome), MPS IVA (Morquio A syndrome), MPS IVB (Morquio B syndrome), MPS VI (Maroteaux-Lamy syndrome), MPS VII (Sly syndrome), and MPS IX (Natowicz syndrome) [1]. MPS are autosomal recessive disorders except for MPS II, which is an X-linked recessive disorder.
Several qualitative and quantitative methods have been developed for measurement of GAGs and evaluation of its role in the biological process. Dye-spectrometric methods including alcian blue [2], and dimethyl methylene blue (DMMB) [3–8] were developed to measure total urinary GAGs. Thin-layer chromatography (TLC) and electrophoresis [9–14] have been used for identification of each specific GAGs; however, these methods are not adapted to blood or tissue extracts without prior protease, nuclease or hyaluronidase digestion. Sensitivity and specificity of dye-spectrometric or the TLC methods are not sufficient to detect all types of MPS, especially MPS IV. ELISA was established to assay CS, DS, KS, and HS [15–20] in blood and urine with a better resolution between normal control and patients. ELISA is rapid, reproducible, and more sensitive than DMB, but more expensive and less available. Liquid chromatography tandem mass spectrometry (LC-MS/MS) has been developed recently which is sensitive, reproducible, and accurate method to assay each specific GAG (CS, DS, HS, and KS) in blood, urine, cerebrospinal fluid, tissues, and/or dried blood spots (DBS) [21–35]. These include the method with enzyme-based digestion of polysaccharides to disaccharides which are quantified in negative electrospray ionization. The advantage of this method is that it can distinguish the isomers of GAGs which have the same molecular weight and the subclass of CS, HS, and KS, leading to identification of all types of MPS. This method is used for measuring GAGs in blood, urine, CSF, and DBS [22–30, 33, 36]. Another method is an acid-catalyzed chemical process (methanolysis) which has been developed by using methanolic hydrochloric acid aiming at the analysis of individual GAGs by LC/MS/MS. This procedure has been adapted for the analysis of GAGs (CS, DS, HS, and KS) from urine [31, 32] and CSF [35]. Until now there is no report of analysis of blood and DBS samples by methanolysis based method. Limitation of this method is subclasses of GAGs can not be measured.
The LC/MS/MS method applies to not only for clinical indications but also for basic research. It is critical to assess whether these biomarkers can be useful for diagnosis, prognosis, and/or monitoring therapy.
In the present study, we applied a LC-MS/MS method to analyze GAGs in serum/plasma, and urine of MPS patients untreated or under ERT, and compared to age-matched controls.
2. Materials and Methods
2.1. Materials
2.1.1. Standards and enzymes
Disaccharides were produced from polymer GAGs by digestion with chondroitinase B, heparitinase, and keratanase II, resulting in DS (di-0S), HS (diHS-NS, diHS-0S), and KS (mono-sulfated KS, di-sulfated KS). These enzymes were obtained from Seikagaku Corporation (Tokyo, Japan). Chondrosine was used as an internal standard (IS). Unsaturated disaccharides, [ΔDiHS-NS, 2-deoxy-2-sulfamino-4-O-(4-deoxy-a-L-threo-hex-4-enopyranosyluronicacid)-D-glucose; ΔDiHS-0S, 2-acetamido-2-deoxy-4-O-(4-deoxy-a-L-threo-hex-4-enopyranosyluronic acid)-D-glucose; ΔDi-4S (DS), 2-acetamido-2-deoxy-4-O-(4-deoxy-a-L-threo-hex-4-enopyranosyluronic acid)-4-O-sulfo-D-glucose; mono-sulfated KS [Galβ1-4GlcNAc(6S)] and di-sulfated KS [Gal(6S)β1-4GlcNAc(6S)] were obtained from Seikagaku Corporation (Tokyo, Japan) and used to make standard curves. Stock solutions ΔDiHS-NS (100μg/ml), ΔDiHS-0S (100μg/ml), ΔDi-4S (250μg/ml), mono- and di-sulfated KS (1000μg/ml) and IS (5mg/ml) were prepared separately in milliQ water. Standard working solutions of ΔDiHS-NS, ΔDiHS-0S, ΔDi-4S (7.8125, 15.625, 31.25, 62.5, 125, 250, 500, and 1000ng/ml), and mono- and di-sulfated KS (80, 160, 310, 630, 1250, 2500, 5000, and 10000ng/ml) each mixed with IS solution (5μg/ml) were prepared [30, 37–39].
2.1.2. Subjects
Blood specimens (plasma/serum) were collected from 46 patients with MPS II (28 untreated samples, 14 under ERT, and 4 under HSCT), 16 patients with MPS III (6 MPS IIIA and 10 MPS IIIB patients), 42 patients with MPS IVA (36 untreated samples and 6 under ERT), and five patients with MPS IVB, with informed consent. Four patients treated with HSCT were 4.9, 6.5, 11, and 15.5 years old. At the time of sample collection, the patients were 9.5, 12.3, 18.8, and 25 years, indicating 4.6, 5.8, 7.8, and 9.5 years post- HSCT, respectively. All 4 patients had a full engraftment. Urine specimens were collected from 23 patients with MPS IVA (15 untreated samples and 8 under ERT), 5 patients with MPS IVB, and 16 patients with MPS VI (3 untreated and 13 under ERT) with informed consent. Plasma/serum and urine samples were similarly obtained from 279 and 121 healthy controls, respectively. This study was approved by IRBs at local institutes and Nemours/AIDHC.
2.2. Methods
2.2.1. Sample preparations
Ten microliters of each plasma/serum, urine sample or standard and 90μl of 50mM Tris– hydrochloric acid buffer (pH 7.0) was placed in wells of AcroPrep™ Advance 96-Well Filter Plates that have Ultrafiltration Omega 10 K membrane filters (PALL Corporation, NY, USA). A cocktail of 40μl with chondroitinase B (0.5 mU/sample), heparitinase, and keratanase II (both 1 mU/sample), and IS solution (5 μg/ml) followed by 60 μl of 50 mM Tris- hydrochloric acid buffer was added to each well. The filter plate was placed on a receiver 96 wells plate and incubated at 37°C overnight. The plate was centrifuged at 2,200 × g for 15 min. The processed samples were injected to LC-MS/MS [30, 37–42].
2.2.2. Apparatus
The chromatographic system used as described earlier with modification [37–40] in the mobile phases which were 100mM ammonia (A) and 100% acetonitrile (B). The gradient condition was programmed as follows: the initial composition of 100% A was held for 1 min, linearly modified to 30% B to 4 min, maintained at 30% B to 5.5 min, returned to 0% B to 6 min, and maintained at 0% B until 10 min. The flow rate was 0.7 ml/min. Specific precursor and product ions, m/z were used to quantify each disaccharide, respectively (IS, 354.3, 193.1; DS, 378.3, 175.1; mono-sulfated KS, 462, 97; di-sulfated KS, 542, 462; diHS-NS, 416, 138; diHS-0S, 378.3, 175.1) [22, 43–45]. DS was measured as di-0S after digestion of di-4S by a 4S-sulfatase present in the preparation of chondroitinase B. The concentration of each disaccharide was calculated using QQQ Quantitative Analysis software. The levels of GAGs in urine samples were normalized by creatinine, measured with a Creatinine (urinary) Colorimetric Assay Kit (Cayman Chem. MI, USA) [39, 41, 46–48].
2.2.3. Method validation
Intra-day precision evaluated as the coefficient of variation (CV) was determined by replicate analyses (n=5) of four different control and six different MPS III blood samples. Inter-day precision was determined by replicate analyses (n = 5) of four different control and six different MPS III blood samples on three separate days. The precision values/coefficient of variation (CV) was satisfactory for all disaccharides (DS, HS, and KS) and described in the result section (supplementary tables 1-5).
2.2.4. Pearson’s correlation coefficient
Pearson’s correlation coefficient was evaluated between blood and urine KS of MPS IVA. Mono-sulfated KS and di-sulfated KS in untreated and ERT treated patients were analyzed.
2.2.5. Statistical Analysis
Patients were grouped by ages as follows: 0 ≤ χ <3years, 3 ≤ χ <5 years, 5 ≤ χ <10 years, 10 ≤ χ <15 years, 15 ≤ χ <20 years, and 20 years and above. Serum/plasma GAGs were expressed as ng/ml. Urine GAGs were expressed as ng/mg creatinine. Data were summarized using mean and standard deviation (SD). Each serum/plasma MPS (II, III, IVA, and IVB) was compared to age-matched controls using t-test. P < 0.05 was considered significant.
3. Results
3.1. Measurement of GAGs in blood
GAGs were measured in blood samples from controls, MPS II, MPS III, MPS IVA, and MPS IVB patients.
3.1.1. Precision
Results of intra- and inter-assay precision for di-4S, diHS-NS, diHS-0S, mono-sulfated KS, and di-sulfated KS in control and MPS III blood samples were as follows. The intra-assay precision values/CV determined from the analysis of di-4S, diHS-NS, diHS-0S, mono-sulfated KS, and di-sulfated KS in control blood samples were less than 13.7, 14, 12, 13.8, and 13.5%, respectively. The intra-assay precision values/CVs for these disaccharides in MPS III blood samples were less than 12.9, 13.1, 8.5, 9.9, and 12.9%, respectively (supplementary tables 1-5). The inter-assay precision values/CVs for these disaccharides in control blood samples were less than 12.3, 14.2, 13.4, 12.4, and 13.8%, respectively. The inter-assay precision values/CVs for these disaccharides in MPS III blood samples were less than 12.9, 14.4, 7.9, 9.9, and 12.9%, respectively (supplementary tables 1-5). These results demonstrated the reproducibility and precision of the method.
3.1.2. Control
A total 279 control samples (average age; 6.24, range; 0-62 years) were used to quantify di- 4S, diHS-NS, diHS-0S, mono-sulfated KS, and di-sulfated KS. The level of each disaccharide was the highest in newborns and decreased gradually with age as showed in table1. The proportion of di-sulfated KS to total KS was increased in control samples in an age-dependent manner.
Table 1.
Serum/plasma GAG level in control and MPS MPS type Age Number GAGs (ng/ml)
| MPS type | Age | Number | GAGs (ng/m) | |||||
|---|---|---|---|---|---|---|---|---|
|
| ||||||||
| di 4S | di-HS-NS | di-HS-OS | mono-sulfated KS | di-sulfated KS | ratio of di-sulfated KS/total KS | |||
| MPS II | 0-2.9 | N/A | ||||||
| Untreated | 3-4.9 | 3 | 191 ± 28*** | 71 ± 15*** | 182±39*** | 1241 ± 136** | 232 ± 40 | 15.9 ± 3.3 |
| 5-9.9 | 10 | 156 ± 111*** | 57.5 ± 33*** | 191± 118*** | 1467 ± 418*** | 393 ±143*** | 21 ± 3 | |
| 10-14.9 | 6 | 150 ± 137*** | 69 ± 36*** | 159 ± 101*** | 1262 ± 685*** | 309 ± 125*** | 20.6 ± 3.2 | |
| 15- 19.9 | 4 | 40.5 ± 13* | 53 ± 27** | 54 ± 12 | 960 ± 271*** | 251 ± 70** | 21 ± 1.5 | |
| 20 and > | 5 | 20 ± 9.5 | 66 ± 22*** | 86 ± 78 | 834 ± 329*** | 214.5 ± 82*** | 21 ± 3 | |
| MPS II | 0-2.9 | N/A | ||||||
| Treated | 3-4.9 | 3 | 71 ± 58*** | 46 ± 16*** | 92.5 ± 25$$ | 1293 ± 514** | 252 ± 131* | 16 ± 1.6 |
| 5-9.9 | 7 | 91 ± 59*** | 43 ± 16*** | 127 ± 48*** | 1432 ± 494*** | 386 ± 122*** | 21.4 ± 1.2 | |
| 10-14.9 | 3 | 38 ± 11** | 36 ± 30*** | 65 ± 9 | 916 ± 271** | 259 ± 105* | 21.5 ± 3.2 | |
| 15- 19.9 | 3 | 46± 14* | 43 ± 31* | 93 ± 65 | 644 ± 432 | 180.5 ± 103 | 22.6 ± 3.7 | |
| 20 and > | 2 | 28 ± 3 | 38 ± 36 | 32 ± 7 | 522 ± 37 | 154 ± 13 | 22.8 ± 2.7 | |
|
| ||||||||
| MPS III | 0-2.9 | N/A | ||||||
| Untreated | 3-4.9 | 2 | 30 ± 8 | 80 ± 38 | 258 ± 98 | 776 ± 105 | 192 ± 41 | 19.7 ± 1.3 |
| 5-9.9 | 7 | 23 ± 8 | 44 ± 17*** | 142 ± 49*** | 488 ± 190 | 134 ± 54 | 21.5 ± 0.7 | |
| 10-14.9 | 2 | 22 ± 0.8 | 46 ± 26 | 153 ± 84 | 665 ± 373 | 191 ± 79 | 23 ± 2.9 | |
| 15- 19.9 | 2 | 17 ± 7 | 30 ± 5 | 108 ± 12 | 327± 118 | 86 ± 62 | 19.4 ± 6.4 | |
| 20 and > | 3 | 19 ± 7 | 41 ± 13*** | 152±73*** | 301± 118 | 72 ± 19 | 20 ± 5.8 | |
|
| ||||||||
| MPS IVA | 0-2.9 | N/A | ||||||
| Untreated | 3-4.9 | 3 | 2 ± 0.8** | 8 ± 6.2 | 40 ± 25 | 849 ± 261 | 252±83* | 23 ± 3 |
| 5-9.9 | 10 | 8 ± 7*** | 38 ± 19** | 90 ± 26 | 918± 501* | 291 ± 182*** | 22 ± 7 | |
| 10-14.9 | 8 | 4 ± 4*** | 13 ± 12 | 45 ± 40 | 632 ± 338 | 174 ± 81 | 22.5 ± 6 | |
| 15- 19.9 | 10 | 7.4 ± 7* | 12 ± 3 | 36 ± 6 | 707 ± 289** | 166 ± 64* | 20 ± 3 | |
| 20 and > | 5 | 8 ± 7* | 7 ± 4 | 24 ± 13 | 309± 182 | 95 ± 83 | 23 ±7 | |
| MPS IVA | 0-2.9 | N/A | ||||||
| Treated | 3-4.9 | N/A | ||||||
| 5-9.9 | 5 | 2.6 ± 0.4 | 4 ± 0.8 | 19 ± 5 | 957 ± 354* | 203 ± 56 | 18.1 ± 2.9 | |
| 10-14.9 | N/A | |||||||
| 15- 19.9 | 1 | 3 | 6 | 32 | 1161 | 233 | 17 | |
| 20 and > | N/A | |||||||
| MPS IVB | 0-2.9 | N/A | ||||||
| Untreated | 3-4.9 | N/A | ||||||
| 5-9.9 | N/A | |||||||
| 10-14.9 | 2 | 2 ± 0.15 | 6 ± 2 | 26 ± 5 | 904 ± 88 | 197 ± 45 | 18 ± 2 | |
| 15- 19.9 | 3 | 2.7 ± 1 | 4.5 ± 2 | 16 ± 2 | 387±96$ | 77 ± 19 | 17 ± 3 | |
| 20 and > | N/A | |||||||
|
| ||||||||
| Control | ||||||||
| 0-2.9 | 146 | 22 5 ± 9 6 | 13 2 ± 8 7 | 88 ± 37 | 745 ± 237 | 139 ± 56 | 16 6 ± 5 7 | |
| 3-4.9 | 32 | 19.8 ± 8.5 | 9.2 ± 5.7 | 64 ± 24.7 | 743 ± 240 | 167 ± 63 | 19 ± 6.7 | |
| 5-9.9 | 50 | 20 ± 6.8 | 8.7 ± 3.8 | 63.8 ± 21 | 717.5 ± 189 | 169 ± 56 | 20 ± 6 | |
| 10-14.9 | 28 | 19.8 ± 8.4 | 9.6 ± 4.6 | 63.5 ± 20 | 560 ± 186 | 152 ± 72 | 22 ± 10 | |
| 15- 19.9 | 8 | 19 1 ± 12 5 | 8 4 ± 4 6 | 53 ± 21 6 | 330 ± 93 | 99 ± 66 | 23 ± 10 | |
| 20 and > | 15 | 31.1 ± 22 | 7.4 ± 2.7 | 52.5 ± 17.5 | 314±113 | 86 ± 44 | 21.4 ± 8 | |
p<0.05,
p<0.01,
p<0.001 compared with age matched control
p<0.05,
p<0.01 age matched untreated versus treated
3.1.3. MPS II
GAG analyses were performed in 46 MPS II patients. These samples were grouped as untreated and ERT/HSCT-treated. Twenty-eight samples (average age; 12.78 years, range; 3.8 to 35 years) were untreated, and 18 samples were under ERT/HSCT (average age; 10.78 years, range; 3.8 to 25 years). Out of 18 treated samples, 4 samples at ages, 9.5, 12.3, 18.8, and 25 years were under HSCT for the duration of 4.9, 6.5, 11, and 15.5 years, respectively. Five samples at ages 3.8, 9, 10, 13.1, and 20.5 years were under ERT for the duration of 0.2, 8.28, 8.03, 0.1, and 0.1 years, respectively. Nine samples at ages, 4, 4, 5, 5, 6, 7, 7, 15 and 19 years old were also under ERT, but information on duration of treatment was not available. Untreated patients had significantly higher levels of DS (up to ages of 20 years) and HS (diHS-NS in all age groups and diHS-0S in ages up to 15 years) than age-matched controls. Mono-sulfated and di-sulfated KS levels were higher than those in age-matched controls (Table 1). The level of DS declined with age. The level of diHS-NS remained constant at all ages. The levels of diHS-0S and mono- and di-sulfated KS declined with age.
Patients under ERT or HSCT still had higher levels of DS (up to 20 years of age) and diHS-NS (in all age groups), compared to those in age-matched controls. Treated patients also had higher levels of diHS-0S (up to 10 years of age) and mono-sulfated and di-sulfated KS levels (up to 15 years of age) compared to age-matched controls. However, patients under ERT had 60, 32, 51, 32 and 24% reduced blood DS, diHS-NS, diHS-0S, and mono-sulfated and di-sulfated KS, respectively, when compared to untreated patients. The ratio of di-sulfated KS/total KS in blood of both untreated and treated MPS II was lower than in age-matched controls in children under 5 years of age but was similar in older age groups.
3.1.4. MPS III
We analyzed samples from 6 MPS IIIA and 10 MPS IIIB patients with an average age of 12.5 years (range; 4.5 to 27 years). Levels of both diHS-NS and diHS-0S were significantly higher in all age groups, compared to those in age-matched controls (Table 1). Level of DS was higher than that in age-matched controls up to age of 15 years, and then the level declined with age. Mono-sulfated and di-sulfated KS and the ratio of di-sulfated KS/total KS were similar to those in age-matched controls in all age groups.
3.1.5. MPS IVA
GAG analysis was carried out in 42 MPS IVA samples. Six samples were under ERT (average age; 10.03 years, range; 8.4 to 16 years), and 36 samples were without any treatment (average age; 14.83 years, range; 3.4 to 56 years). The ERT group for six samples at ages, 8.4, 8.4, 8.9, 9.2, 9.3, and 16 years had been treated for 38, 39, 25, 37, 64, and 38 weeks, respectively. Untreated MPS IVA patients had higher levels of mono-sulfated and di-sulfated KS up to 20 years of age, compared to age-matched controls (Table 1). The ratio of blood di-sulfated KS/total KS in untreated MPS IVA was higher than in age-matched controls up to 10 years of age but was similar in older age groups. The ratio was relatively constant for all ages in MPS IVA.
MPS IVA patients treated with ERT had higher levels of mono- and di-sulfated KS than age-matched controls and levels of mono-sulfated KS were similar or higher than those of untreated patients. However, relative levels of di-sulfated KS were lower in treated patients than untreated patients, and thus the ratio of di-sulfated KS/total KS in treated patients was lower than in age-matched untreated patients.
In this study, we found that MPS IVA patients at all ages had lower levels of DS than age-matched controls. Untreated MPS IVA aged between 5 and 10 years old had significantly higher levels of diHS-NS, compared to age-matched controls. MPS IVA patients treated with ERT had lower levels of DS, diHS-NS, and di-HS-0S, compared to age-matched controls.
3.1.6. MPS IVB
Five untreated MPS IVB samples (average age; 15.8 years, range; 12.7 to 18.3 years) were analyzed (no specific therapy is available for this condition). Although low numbers of patients preclude statistical analyses, mono-sulfated and di-sulfated KS levels were higher, and the ratio of di-sulfated KS/total KS was lower in MPS IVB patients than in untreated MPS IVA patients and controls. MPS IVB patients also had lower levels of DS and HS (diHS-NS and diHS-0S) than age-matched controls (Table 1).
3.2. Measurement of GAGs in urine
GAGs were measured in urine samples from controls, MPS IVA, MPS IVB and MPS VI patients.
3.2.1. Control
GAG analysis was performed in a total 121 control urine samples (average age; 1.03 years, range; 0-50 years) to quantify di-0S, diHS-NS, diHS-0S, mono-sulfated KS, and di-sulfated KS. The level of each disaccharide was the highest in newborns and decreased gradually with age (Table 2). The proportion of di-sulfated KS to total KS was increased in control samples as an age-dependent manner (Table 2, Fig. 1F) and was higher than in control blood samples (Table 1).
Table 2.
GAGs in urine samples MPS type Age Number GAGs (ng/mg creatinine)
| MPS type | Age | Number | GAGs (ng/mg creatinine) | |||||
|---|---|---|---|---|---|---|---|---|
|
| ||||||||
| di 4S | di-HS-NS | di-HS-0S | mono-sulfated KS | di-sulfated KS | ratio of di-sulfated KS/total KS | |||
| MPS IVA | 0-2.9 | N/A | ||||||
| Untreated | 3-4.9 | 1 | 1716 | 684 | 1755 | 36113 | 25674 | 42 |
| 5-9.9 | 6 | 557±303** | 453 ± 153 | 1446 ± 490* | 22574 ± 10396*** | 18123 ±10345*** | 43 ± 3*** | |
| 10-14.9 | 5 | 352 ± 143* | 290 ± 95 | 883 ± 113** | 11016 ± 6606*** | 6694 ± 4562*** | 38 ± 7 | |
| 15- 19.9 | 3 | 211 ± 78* | 243 ± 14* | 764 ± 125 | 7125 ± 6232 | 5774 ± 5365 | 44 ± 2 | |
| 20 and > | N/A | |||||||
| MPS IVA | 0-2.9 | N/A | ||||||
| Treated | 3-4.9 | N/A | ||||||
| 5-9.9 | 6 | 435 ± 224** | 443± 108 | 1367 ± 516 | 12859±1685*** | 9414 ± 4042*** | 41 ± 11*** | |
| 10-14.9 | N/A | |||||||
| 15- 19.9 | 2 | 332 ± 175 | 374 ± 8 | 826 ± 123 | 5273 ± 2096 | 3215 ± 1010 | 38 ± 2 | |
| 20 and > | N/A | |||||||
|
|
||||||||
| MPS IVB | 0-2.9 | N/A | ||||||
| Untreated | 3-4.9 | N/A | ||||||
| 5-9.9 | N/A | |||||||
| 10-14.9 | 2 | 220 ± 118 | 301 ± 85 | 1233 ± 158 | 3999 ± 93 | 1199 ± 199 | 23 ± 3 | |
| 15- 19.9 | 3 | 265 ± 259 | 810 ± 285 | 2198 ± 1120 | 4873 ± 2888 | 976 ± 529 | 17 ± 2 | |
| 20 and > | N/A | |||||||
|
| ||||||||
| MPS VI | 0-2.9 | 2 | 1303 ± 336 | 305 ± 81 | 932 ± 159 | 1330 ± 1012 | 493 ± 250 | 29 ± 7 |
| Untreated | 20 and > | 1 | 2134 | 296 | 1191 | 5514 | 1065 | 16.2 |
|
|
||||||||
| 0-2.9 | N/A | |||||||
| MPS VI | 3-4.9 | N/A | ||||||
| Treated | 5-9.9 | 3 | 7851±6323** | 435 ± 241 | 1373 ± 795 | 2722 ± 1846 | 1098 ± 759* | 28 ± 2 |
| 10-14.9 | 3 | 3854±1011*** | 399±150* | 1372±311*** | 3560 ± 456*** | 1145±398*** | 29 ± 4 | |
| 15- 19.9 | 6 | 4812±732 | 499 ± 286 | 1579 ± 1114 | 3227 ± 1646* | 805 ± 638 | 24 ± 11 | |
| 20 and > | 1 | 4838 | 614 | 1650 | 1955 | 1044 | 34.8 | |
|
| ||||||||
| Control | ||||||||
| 0-2.9 | 75 | 847 ± 553 | 637 ± 325 | 2270 ± 1090 | 3930 ± 2135 | 737 ± 386 | 16 ± 6 | |
| 3-4.9 | 12 | 398 ± 255 | 304 ± 48 | 1018 ± 147 | 2168 ± 477 | 609 ± 187 | 23 ± 4.4 | |
| 5-9.9 | 13 | 222 ± 125 | 355 ± 98 | 1009±318 | 1699 ± 649 | 576 ± 251 | 25 ± 3 | |
| 10-14.9 | 12 | 184 ± 106 | 238 ± 97 | 623 ± 150 | 837 ± 493 | 337 ± 138 | 32 ± 6 | |
| 15- 19.9 | 3 | 56 ± 21 | 134 ± 37 | 400 ± 49 | 228 ± 88 | 115 ± 27 | 35 ± 4 | |
| 20 and > | 6 | 56 ± 35 | 191 ± 120 | 479 ± 276 | 163 ± 59 | 98 ± 50 | 36 ± 8 | |
Values ± SD;
p<0.05,
P<0.01,
p<0.001 compaired with age match controls
Figure 1.
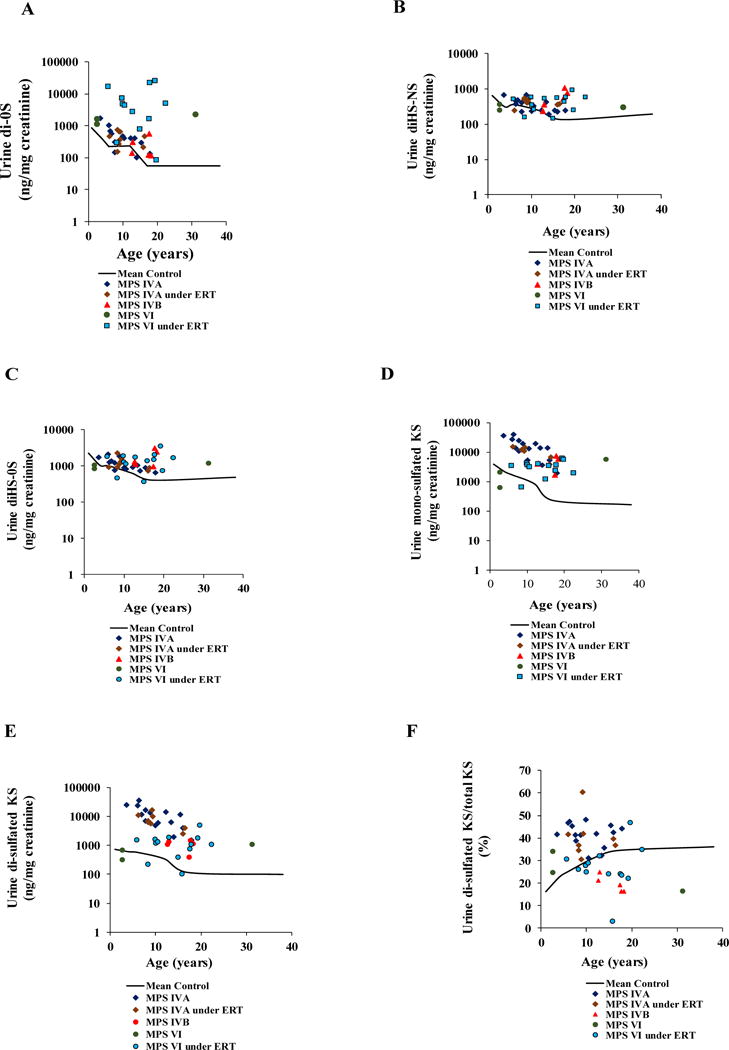
Age-dependent DS (A), diHS-NS (B), diHS-0S (C), mono-sulfated KS (D), di- sulfated KS (E) and % of di-sulfated KS in total KS, in the urine of untreated or ERT MPS IVA, untreated MPS IVB, and untreated or ERT MPS VI patients.
3.2.2. MPS IVA
GAG analysis was performed in 23 MPS IVA urine samples. Eight samples were from the patients treated with ERT (average age; 10.5 years, range; 6.1 to 16.4 years), and 15 samples were from untreated patients (average age; 10.44 years, range; 3.6 to 17.9 years). The ERT patients had been treated for 25–72 weeks.
Urine from untreated MPS IVA patients had much higher levels of mono-sulfated and di-sulfated KS at all ages compared to age-matched controls (Table 2). The ratio of di-sulfated KS/total KS was also higher than in controls, and the ratio did not change with age as seen in controls.
Levels of mono- and di-sulfated KS were lower (34 and 46%, respectively) in patients treated with ERT than in age-matched untreated patients but remained much higher than in age-matched controls (Table 2). The ratio of di-sulfated KS/total KS in patients was not reduced by ERT remained high compared to that in age-matched controls.
The levels of DS, diHS-NS, and diHS-0S in MPS IVA patients were also higher than in age-matched controls and remained higher after ERT.
3.2.3. MPS IVB
Five MPS IVB samples (average age; 15.8 years, range; 12.7 to 18.3 years) were analyzed. Both mono-sulfated KS and di-sulfated KS levels were higher than those in age-matched controls. Levels of DS, diHS-NS, and diHS-0S were also higher at all ages compared to age-matched controls (Table 2). However, levels were not as high as seen for MPS IVA and the ratio of di-sulfated KS/total KS in MPS IVB was similar to that seen in controls.
3.2.4. Correlation between blood and urine KS for MPS IVA
There was a strong positive correlation between blood and urine mono-sulfated KS in untreated MPS IVA samples (Fig. 2A). Pearson’s correlation coefficient was 0.56289 (p = 0.056). However, a weak negative correlation was found between blood and urine mono-sulfated KS in MPS IVA patients under ERT (Fig. 2A). Pearson’s correlation coefficient was −0.42779 (p=0.3976). Similarly, the strong positive correlation was found between blood and urine di-sulfated KS in untreated MPS IVA samples (Fig. 2B). Pearson’s correlation coefficient was 0.636 (p=0.026). However, a weak negative correlation between blood and urine di-sulfated KS was found in treated MPS IVA patients (Fig. 2B). Pearson’s correlation coefficient was −0.338674 (p=0.51151).
Figure 2.
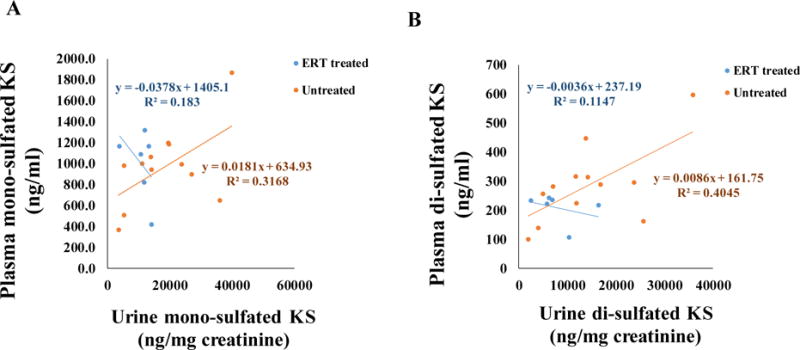
Pearson’s correlation between plasma and urine mono-sulfated KS of treated and untreated MPS IVA patients (A), correlation between plasma and urine di-sulfated KS of treated and untreated MPS IVA patients (B).
3.2.5. MPS VI
GAG assay was performed using 16 MPS VI urine samples. Out of 16 samples, only three samples (average age; 12.23 years, range; 2.7 to 31.3 years) were from untreated patients, with the remaining 13 samples from patients treated with ERT (average age; 14.26 years, range; 5.8 to 22.4 years).Information on duration of ERT was not available. For the untreated patients, DS levels were higher than in age-matched controls, and the untreated 22-year-old had an elevation of all GAGs in urine.
More significantly, patients treated with ERT had much higher levels of DS than age-matched controls and also had higher levels of diHS-NS, diHS-0S, mono-sulfated KS, and di-sulfated KS in urine.
4. Discussion
In this study, we have demonstrated that 1) MPS II, III, IVA, IVB, and VI patients can be distinguished from age-matched controls, based on the degree of elevation of disaccharides in blood and/or urine, 2) there is a secondary elevation of KS in blood and urine in patients with MPS II and VI, 3) there is a strong positive correlation between blood and urine for levels of mono- and di-sulfated KS in untreated MPS IVA samples, 4) there is a weak negative correlation between blood and urine for levels of mono- and di-sulfated KS in ERT-treated MPS IVA patients, and 5) urine KS can differentiate MPS IVA from other forms of MPSs, but it is not useful to indicate a responte to ERT in MPS IVA.
MPS II results from a deficiency of iduronate-2-sulfatase, leading to primary accumulation of DS and HS. In this study, DS, diHS-0S, and diHS-NS levels were higher in blood of untreated patients than in the control groups, confirming data from previous studies using LC-MS/MS methods [22, 29, 30, 37, 38, 48–50]. MPS II patients receiving ERT or HSCT showed a substantial decline in DS (60%) and HS levels (diHS-NS, 34%; diHS-0S, 51%), compared to age-matched untreated samples. However, DS and HS in treated patients remained higher than in age-matched controls. This finding is consistent with our previous study showing that ERT did not normalize DS and HS levels in MPS II patients [51]. Since conventional ERT typically does not deliver enzyme across the blood brain barrier and has poor uptake by bone, DS and HS derived from brain and bone will remain elevated in blood. A secondary elevation of both mono- and di-sulfated KS levels was found in untreated and MPS II patients under ERT or HSCT [18, 39]. Rowan et al. [52] showed that HS (but neither CS nor DS) inhibited the activity of the N-acetylgalactosamine-6-sulfate sulfatase (GALNS) enzyme in mice, indicating that the secondary elevation of KS levels seen in MPS II patients could be caused by inhibition of the GALNS enzyme by the elevated HS.
MPS III is characterized by four types; MPS IIIA, IIIB, IIIC, and IIID due to lack of heparan-N-sulfatase (SGHS), α-N-acetylglucosaminidase (NAGLU), α-glucosaminidase acetyltransferase (HGSNAT), and N-acetyl-glucosamine 6-sulfatase (GNS), respectively. A defect in any of the four enzymes compromises the degradation of HS. In this study, we combined data from MPS IIIA and IIIB patients into different age groups. The levels of diHS-0S and diHS-NS in MPS III patients were significantly higher than those in age-matched controls, consistent with previous studies [22, 29, 53]. Tomatsu et al. [17] previously showed that the magnitude of elevation of blood HS in MPS patients correlates with clinical severity (MPS I, II, III, and VII).
MPS IVA and IVB are caused by the deficiency of GALNS and β-galactosidase, respectively, that directly involve in KS catabolism, leading to accumulation of undegraded KS in cartilage tissues. The resulting accumulation of undegraded KS damages the cartilage and increases KS levels in the body fluids. The extent of elevated KS in blood and urine in MPS IVA correlates positively with clinical severity [19]. In this study, the levels of both mono-sulfated and di-sulfated KS in blood were higher in MPS IVA patients than those in age-matched controls. Mono-sulfated KS level was also higher in MPS IVB patients than that in age-matched controls as previously reported [18].
Urine mono-sulfated and di-sulfated KS levels were higher in MPS IVA and IVB patients than those in age-matched controls. Levels of KS in urine were significantly higher in MPS IVA patients than in MPS IVB patients, indicating that urine KS, but not blood KS, may be more helpful as a biomarker to differentiate between MPS VIA and IVB.
The proportion of di-sulfated KS to total KS in urine of MPS IVA was higher than that in age-matched controls, especially during younger age, and unlike the increase in controls, the ratio of di-sulfated KS to total KS in blood and urine of MPS IVA patients did not change with age. Sulfation patterns of KS depend on the tissue, species, specimen analyzed, and age. It is noteworthy that the ratio of di-sulfated KS to total KS in urine is much higher than that in blood, indicating that the source and character of blood and urine KS are different in nature as seen in other GAGs [54, 55]. Blood KS is directly related to turnover of proteoglycans in cartilage, the primary tissue where KS is synthesized, caused by tissue remodeling during growth and disruption and/or repair of cartilage. Meanwhile, urinary KS derives from the kidney or is filtered through the kidney. Only selected smaller molecules are excreted into urine, and consequently, urinary KS does not measure all forms of undigested KS present in blood and tissue [46, 56].
MPS IVA patients treated with ERT had lower levels of urinary KS than age-matched untreated patients although still higher KS levels than age-matched controls. In contrast, blood KS levels in patients with ERT remained unchanged. We have demonstrated a strong correlation between blood and urine in both mono-sulfated and di-sulfated KS levels in untreated MPS IVA patients. However, negative correlation between blood and urine of patients with ERT was present in both mono-sulfated and di-sulfated KS levels (Fig. 2). It is notable that patients with MPS IVA in this study did not show improvement of any skeletal features during ERT, indicating that urine KS is not a good biomarker for monitoring therapeutic efficacy.
Since the most critical manifestations in MPS IVA are due to skeletal dysplasia caused by malfunction of vacuolated chondrocytes and successive abnormal ECM formation, it is critical to determine whether a measured biomarker correlates with improvement of abnormal skeletal features by a given therapy.
MPS VI is caused by a deficiency of N-acetylgalactosamine 4-sulfatase (arylsulfatase B, ASB). This enzyme is required for the degradation of DS. In the absence of ASB enzyme, DS is accumulated in cells and excreted in large quantities in urine. DS level in the urine of MPS VI patients was significantly higher than that in age-matched controls. In addition, the levels of mono-sulfated and di-sulfated KS were significantly higher than that in age-matched controls as described earlier [57].
The mechanism by which KS is elevated in other types of MPS beyond MPS IV remains unclear although several hypotheses responsible for the secondary elevation were proposed [18, 38, 39, 41, 51, 52, 58]. Assessment of bone pathology by micro-CT and KS levels in mouse models with MPS I, III, IVA, and VII indicated that KS levels correlate the extent of severity of skeletal dysplasia [52]. Analysis of blood by LC-MS/MS is useful to define all types of MPS as it can simultaneously identify DS, HS, and KS. Urine KS is also useful to differentiate MPS IVA from other MPS but not for monitoring therapeutic effect. Thus, the appropriate application of LC-MS/MS in blood and urine is emerging as a valuable method in diagnosis, prognosis, and/or assessment of therapeutic efficacy in MPS patients although we need to consider the age of the patient, use of therapy, and duration of treatment.
5. Conclusions
LC-MS/MS is an important tool to simultaneously identify DS, HS, and KS in blood and urine of MPS and control subjects. We can identify patients with several (potentially all) types of MPS based on the elevation of specific disaccharides. The advantage of the use of LC-MS/MS is that GAGs with the same molecular weight can be separated, leading to accuracy and specificity of the differential diagnosis.
Highlights.
ERT for MPS II, IVA, and VI does not normalize GAG levels.
MPS IVA and IVB are distinguishable by assaying blood and urine KS.
Positive correlation between blood and urine mono- and di-sulfated KS in untreated MPS IVA samples is present.
Negative correlation between blood and urine levels of mono- and di-sulfated KS in MPS IVA patients treated with ERT is present.
Urine KS is valuable for diagnosis of MPS IVA but not for monitoring therapeutic effect of ERT
Acknowledgments
This work was supported by grants from The Carol Ann Foundation, Angelo R. Cali & Mary V. Cali Family Foundation, Inc., The Vain and Harry Fish Foundation, Inc., The Bennett Foundation, Jacob Randall Foundation, Austrian and Japanese MPS societies, and Nemours Funds. This work was supported by the project for baby and infant in research of health and development to Adolescent and young adult from Japan Agency for Medical Research and development, AMED, under grant number JP18gk0110017. R.W.M. and S.T. were supported by an Institutional Development Award (IDeA) from the National Institute of General Medical Sciences of National Institutes of Health (NIH) under grant number P30GM114736. The content of the article has not been influenced by the sponsors.
Abbreviations
- MPS
mucopolysaccharidoses
- GAGs
glycosaminoglycans
- CS
chondroitin sulfate
- DS
dermatan sulfate
- HS
heparan sulfate
- KS
keratan sulfate
- DMMB
dimethylmethylene blue
- TLC
thin-layer chromatography
- MS/MS
tandem mass spectrometry
- DBS
dried blood spots
- ERT
enzyme replacement therapy
- HSCT
hematopoietic stem cell transplantation
Footnotes
Publisher's Disclaimer: This is a PDF file of an unedited manuscript that has been accepted for publication. As a service to our customers we are providing this early version of the manuscript. The manuscript will undergo copyediting, typesetting, and review of the resulting proof before it is published in its final citable form. Please note that during the production process errors may be discovered which could affect the content, and all legal disclaimers that apply to the journal pertain.
Conflict of interest
All the authors contributed to this Article and had no conflict of interest with any other party. Shaukat A Khan, Robert W. Mason, Roberto Giugliani, Kenji Orii, Toshiyuki Fukao, Seiji Yamaguchi, Hironori Kobayashi, Tadao Orii, and Shunji Tomatsu declare that they have no conflict of interests.
Contributions to the project:
Shaukat A Khan has contributed to the concept and planning of the project, collection of data, data analysis, the draft of the manuscript, and reporting of the work described as the primary author.
Robert W. Mason has contributed to the concept and planning of the project, collection of data, data analysis, the draft of the manuscript, and reporting of the work described.
Roberto Giugliani has contributed to the concept and planning of the project, collection of samples and data, and reporting of the work described.
Kenji Orii has contributed to the concept and planning of the project, collection of samples and data, and reporting of the work described.
Toshiyuki Fukao has contributed to the concept and planning of the project, collection of samples and data, and reporting of the work described.
Yasuyuki Suzuki has contributed to the concept and planning of the project, collection of samples and data, and reporting of the work described.
Seiji Yamaguchi has contributed to the concept and planning of the project, collection of samples and data, and reporting of the work described.
Hironori Kobayashi has contributed to the concept and planning of the project, collection of samples and data, and reporting of the work described.
Tadao Orii has contributed to the concept and planning of the project, collection of samples, and reporting of the work described.
Shunji Tomatsu is a Principal Investigator for this project and has contributed to the concept and planning of the project, analysis of data, and reporting of the work described.
References
- 1.Neufeld MJ. The Metabolic and Molecular Bases of Inherited Disease. In: Scriver CBASWVD, editor. The mucopolysaccharidoses. McGraw-Hill; New York: 2001. pp. 3421–3452. [Google Scholar]
- 2.Bjornsson S. Quantitation of proteoglycans as glycosaminoglycans in biological fluids using an alcian blue dot blot analysis. Analytical biochemistry. 1998;256:229–237. doi: 10.1006/abio.1997.2494. [DOI] [PubMed] [Google Scholar]
- 3.de Jong JG, Hasselman JJ, van Landeghem AA, Vader HL, Wevers RA. The spot test is not a reliable screening procedure for mucopolysaccharidoses. Clinical chemistry. 1991;37:572–575. [PubMed] [Google Scholar]
- 4.de Jong JG, Wevers RA, Laarakkers C, Poorthuis BJ. Dimethylmethylene blue-based spectrophotometry of glycosaminoglycans in untreated urine: a rapid screening procedure for mucopolysaccharidoses. Clinical chemistry. 1989;35:1472–1477. [PubMed] [Google Scholar]
- 5.Iwata S, Sukegawa K, Kokuryu M, Tomatsu S, Kondo N, Iwasa S, Orii T. Glycosaminoglycans in neonatal urine Archives of disease in childhood. Fetal and neonatal edition. 2000;82:F78. doi: 10.1136/fn.82.1.F78. [DOI] [PMC free article] [PubMed] [Google Scholar]
- 6.Iwata S, Sukegawa K, Sasaki T, Kokuryu M, Yamasita S, Noma A, Iwasa S, Kondo N, Orii T. Mass screening test for mucopolysaccharidoses using the 1,9-dimethylmethylene blue method: positive interference from paper diapers. Clinica chimica acta; international journal of clinical chemistry. 1997;264:245–250. doi: 10.1016/s0009-8981(97)00084-3. [DOI] [PubMed] [Google Scholar]
- 7.Whitley CB, Draper KA, Dutton CM, Brown PA, Severson SL, France LA. Diagnostic test for mucopolysaccharidosis. II. Rapid quantification of glycosaminoglycan in urine samples collected on a paper matrix. Clinical chemistry. 1989;35:2074–2081. [PubMed] [Google Scholar]
- 8.Whitley CB, Ridnour MD, Draper KA, Dutton CM, Neglia JP. Diagnostic test for mucopolysaccharidosis. I. Direct method for quantifying excessive urinary glycosaminoglycan excretion. Clinical chemistry. 1989;35:374–379. [PubMed] [Google Scholar]
- 9.Humbel R, Chamoles NA. Sequential thin layer chromatography of urinary acidic glycosaminglycans. Clinica chimica acta; international journal of clinical chemistry. 1972;40:290–293. doi: 10.1016/0009-8981(72)90287-2. [DOI] [PubMed] [Google Scholar]
- 10.Lippiello L, Mankin HJ. Thin-layer chromatographic separation of the isomeric chondroitin sulfates, dermatan sulfate, and keratan sulfate. Analytical biochemistry. 1971;39:54–58. doi: 10.1016/0003-2697(71)90460-x. [DOI] [PubMed] [Google Scholar]
- 11.Saamanen AM, Tammi M. Determination of unsaturated glycosaminoglycan disaccharides by spectrophotometry on thin-layer chromatographic plates. Analytical biochemistry. 1984;140:354–359. doi: 10.1016/0003-2697(84)90177-5. [DOI] [PubMed] [Google Scholar]
- 12.Teller WM, Ziemann A. Thin layer chromatography of urinary acid glycosaminoglycans as screening procedure for mucopolysaccharidoses. Hormone and metabolic research = Hormon- und Stoffwechselforschung = Hormones et metabolisme. 1969;1:32–35. doi: 10.1055/s-0028-1095171. [DOI] [PubMed] [Google Scholar]
- 13.Wusteman FS, Lloyd AG, Dodgson KS. Thin-layer chromatography and the rapid identification of common acidic glycosaminoglycans. Journal of chromatography. 1966;21:32–39. doi: 10.1016/s0021-9673(01)91257-9. [DOI] [PubMed] [Google Scholar]
- 14.Zhang Z, Xie J, Zhang F, Linhardt RJ. Thin-layer chromatography for the analysis of glycosaminoglycan oligosaccharides. Analytical biochemistry. 2007;371:118–120. doi: 10.1016/j.ab.2007.07.003. [DOI] [PMC free article] [PubMed] [Google Scholar]
- 15.Moller HJ, Larsen FS, Ingemann-Hansen T, Poulsen JH. ELISA for the core protein of the cartilage large aggregating proteoglycan, aggrecan: comparison with the concentrations of immunogenic keratan sulphate in synovial fluid, serum and urine. Clinica chimica acta; international journal of clinical chemistry. 1994;225:43–55. doi: 10.1016/0009-8981(94)90026-4. [DOI] [PubMed] [Google Scholar]
- 16.Najjam S, Gibbs RV, Gordon MY, Rider CC. Characterization of human recombinant interleukin 2 binding to heparin and heparan sulfate using an ELISA approach. Cytokine. 1997;9:1013–1022. doi: 10.1006/cyto.1997.0246. [DOI] [PubMed] [Google Scholar]
- 17.Tomatsu S, Gutierrez MA, Ishimaru T, Pena OM, Montano AM, Maeda H, Velez-Castrillon S, Nishioka T, Fachel AA, Cooper A, Thornley M, Wraith E, Barrera LA, Laybauer LS, Giugliani R, Schwartz IV, Frenking GS, Beck M, Kircher SG, Paschke E, Yamaguchi S, Ullrich K, Isogai K, Suzuki Y, Orii T, Noguchi A. Heparan sulfate levels in mucopolysaccharidoses and mucolipidoses. Journal of inherited metabolic disease. 2005;28:743–757. doi: 10.1007/s10545-005-0069-y. [DOI] [PubMed] [Google Scholar]
- 18.Tomatsu S, Okamura K, Maeda H, Taketani T, Castrillon SV, Gutierrez MA, Nishioka T, Fachel AA, Orii KO, Grubb JH, Cooper A, Thornley M, Wraith E, Barrera LA, Laybauer LS, Giugliani R, Schwartz IV, Frenking GS, Beck M, Kircher SG, Paschke E, Yamaguchi S, Ullrich K, Haskins M, Isogai K, Suzuki Y, Orii T, Kondo N, Creer M, Okuyama T, Tanaka A, Noguchi A. Keratan sulphate levels in mucopolysaccharidoses and mucolipidoses. Journal of inherited metabolic disease. 2005;28:187–202. doi: 10.1007/s10545-005-5673-3. [DOI] [PubMed] [Google Scholar]
- 19.Tomatsu S, Okamura K, Taketani T, Orii KO, Nishioka T, Gutierrez MA, Velez-Castrillon S, Fachel AA, Grubb JH, Cooper A, Thornley M, Wraith E, Barrera LA, Giugliani R, Schwartz IV, Frenking GS, Beck M, Kircher SG, Paschke E, Yamaguchi S, Ullrich K, Isogai K, Suzuki Y, Orii T, Kondo N, Creer M, Noguchi A. Development and testing of new screening method for keratan sulfate in mucopolysaccharidosis IVA. Pediatric research. 2004;55:592–597. doi: 10.1203/01.PDR.0000113767.60140.E9. [DOI] [PubMed] [Google Scholar]
- 20.Yang JA, Kim ES, Kwon JH, Kim H, Shin JH, Yun SH, Choi KY, Hahn SK. Transdermal delivery of hyaluronic acid – human growth hormone conjugate. Biomaterials. 2012;33:5947–5954. doi: 10.1016/j.biomaterials.2012.05.003. [DOI] [PubMed] [Google Scholar]
- 21.Kailemia MJ, Park M, Kaplan DA, Venot A, Boons GJ, Li L, Linhardt RJ, Amster IJ. High-field asymmetric-waveform ion mobility spectrometry and electron detachment dissociation of isobaric mixtures of glycosaminoglycans. Journal of the American Society for Mass Spectrometry. 2014;25:258–268. doi: 10.1007/s13361-013-0771-1. [DOI] [PMC free article] [PubMed] [Google Scholar]
- 22.Oguma T, Tomatsu S, Montano AM, Okazaki O. Analytical method for the determination of disaccharides derived from keratan, heparan, and dermatan sulfates in human serum and plasma by high-performance liquid chromatography/turbo ionspray ionization tandem mass spectrometry. Analytical biochemistry. 2007;368:79–86. doi: 10.1016/j.ab.2007.05.016. [DOI] [PubMed] [Google Scholar]
- 23.Oguma T, Tomatsu S, Okazaki O. Analytical method for determination of disaccharides derived from keratan sulfates in human serum and plasma by high-performance liquid chromatography/turbo-ionspray ionization tandem mass spectrometry. Biomedical chromatography: BMC. 2007;21:356–362. doi: 10.1002/bmc.760. [DOI] [PubMed] [Google Scholar]
- 24.Oguma T, Toyoda H, Toida T, Imanari T. Analytical method of heparan sulfates using high-performance liquid chromatography turbo-ionspray ionization tandem mass spectrometry. Journal of chromatography. B. Biomedical sciences and applications. 2001;754:153–159. doi: 10.1016/s0378-4347(00)00601-0. [DOI] [PubMed] [Google Scholar]
- 25.Oguma T, Toyoda H, Toida T, Imanari T. Analytical method for keratan sulfates by high-performance liquid chromatography/turbo-ionspray tandem mass spectrometry. Analytical biochemistry. 2001;290:68–73. doi: 10.1006/abio.2000.4940. [DOI] [PubMed] [Google Scholar]
- 26.Oguma T, Toyoda H, Toida T, Imanari T. Analytical method of chondroitin/dermatan sulfates using high performance liquid chromatography/turbo ionspray ionization mass spectrometry: application to analyses of the tumor tissue sections on glass slides. Biomedical chromatography: BMC. 2001;15:356–362. doi: 10.1002/bmc.74. [DOI] [PubMed] [Google Scholar]
- 27.Tomatsu S, Fujii T, Fukushi M, Oguma T, Shimada T, Maeda M, Kida K, Shibata Y, Futatsumori H, Montano AM, Mason RW, Yamaguchi S, Suzuki Y, Orii T. Newborn screening and diagnosis of mucopolysaccharidoses. Molecular genetics and metabolism. 2013;110:42–53. doi: 10.1016/j.ymgme.2013.06.007. [DOI] [PMC free article] [PubMed] [Google Scholar]
- 28.Tomatsu S, Montano AM, Oguma T, Dung VC, Oikawa H, de Carvalho TG, Gutierrez ML, Yamaguchi S, Suzuki Y, Fukushi M, Sakura N, Barrera L, Kida K, Kubota M, Orii T. Dermatan sulfate and heparan sulfate as a biomarker for mucopolysaccharidosis I. Journal of inherited metabolic disease. 2010;33:141–150. doi: 10.1007/s10545-009-9036-3. [DOI] [PubMed] [Google Scholar]
- 29.Tomatsu S, Montano AM, Oguma T, Dung VC, Oikawa H, Gutierrez ML, Yamaguchi S, Suzuki Y, Fukushi M, Barrera LA, Kida K, Kubota M, Orii T. Validation of disaccharide compositions derived from dermatan sulfate and heparan sulfate in mucopolysaccharidoses and mucolipidoses II and III by tandem mass spectrometry. Molecular genetics and metabolism. 2010;99:124–131. doi: 10.1016/j.ymgme.2009.10.001. [DOI] [PubMed] [Google Scholar]
- 30.Tomatsu S, Shimada T, Mason RW, Kelly J, LaMarr WA, Yasuda E, Shibata Y, Futatsumori H, Montano AM, Yamaguchi S, Suzuki Y, Orii T. Assay for Glycosaminoglycans by Tandem Mass Spectrometry and its. Applications Journal of analytical & bioanalytical techniques. 2014;2014:006. doi: 10.4172/2155-9872.S2-006. [DOI] [PMC free article] [PubMed] [Google Scholar]
- 31.Zhu H, Chen X, Zhang X, Liu L, Cong D, Zhao X, Yu G. Acidolysis-based component mapping of glycosaminoglycans by reversed-phase high-performance liquid chromatography with off-line electrospray ionization-tandem mass spectrometry: evidence and tags to distinguish different glycosaminoglycans. Analytical biochemistry. 2014;465:63–69. doi: 10.1016/j.ab.2014.07.021. [DOI] [PubMed] [Google Scholar]
- 32.Auray-Blais C, Bherer P, Gagnon R, Young SP, Zhang HH, An Y, Clarke JT, Millington DS. Efficient analysis of urinary glycosaminoglycans by LC-MS/MS in mucopolysaccharidoses type I, II and VI. Molecular genetics and metabolism. 2011;102:49–56. doi: 10.1016/j.ymgme.2010.09.003. [DOI] [PubMed] [Google Scholar]
- 33.Auray-Blais C, Lavoie P, Maranda B, Boutin M. Evaluation of urinary keratan sulfate disaccharides in MPS IVA patients using UPLC-MS/MS. Bioanalysis. 2016;8:179–191. doi: 10.4155/bio.15.239. [DOI] [PubMed] [Google Scholar]
- 34.Piraud M, Pettazzoni M, Lavoie P, Ruet S, Pagan C, Cheillan D, Latour P, Vianey-Saban C, Auray-Blais C, Froissart R. Contribution of tandem mass spectrometry to the diagnosis of lysosomal storage disorders. Journal of inherited metabolic disease. 2018 doi: 10.1007/s10545-017-0126-3. [DOI] [PubMed] [Google Scholar]
- 35.Zhang H, Young SP, Auray-Blais C, Orchard PJ, Tolar J, Millington DS. Analysis of glycosaminoglycans in cerebrospinal fluid from patients with mucopolysaccharidoses by isotope-dilution ultra-performance liquid chromatography-tandem mass spectrometry. Clinical chemistry. 2011;57:1005–1012. doi: 10.1373/clinchem.2010.161141. [DOI] [PubMed] [Google Scholar]
- 36.Osago H, Shibata T, Hara N, Kuwata S, Kono M, Uchio Y, Tsuchiya M. Quantitative analysis of glycosaminoglycans, chondroitin/dermatan sulfate, hyaluronic acid, heparan sulfate, and keratan sulfate by liquid chromatography-electrospray ionization-tandem mass spectrometry. Analytical biochemistry. 2014;467:62–74. doi: 10.1016/j.ab.2014.08.005. [DOI] [PubMed] [Google Scholar]
- 37.Kubaski F, Mason RW, Nakatomi A, Shintaku H, Xie L, van Vlies NN, Church H, Giugliani R, Kobayashi H, Yamaguchi S, Suzuki Y, Orii T, Fukao T, Montano AM, Tomatsu S. Newborn screening for mucopolysaccharidoses: a pilot study of measurement of glycosaminoglycans by tandem mass spectrometry. Journal of inherited metabolic disease. 2017;40:151–158. doi: 10.1007/s10545-016-9981-6. [DOI] [PMC free article] [PubMed] [Google Scholar]
- 38.Kubaski F, Suzuki Y, Orii K, Giugliani R, Church HJ, Mason RW, Dung VC, Ngoc CT, Yamaguchi S, Kobayashi H, Girisha KM, Fukao T, Orii T, Tomatsu S. Glycosaminoglycan levels in dried blood spots of patients with mucopolysaccharidoses and mucolipidoses. Molecular genetics and metabolism. 2017;120:247–254. doi: 10.1016/j.ymgme.2016.12.010. [DOI] [PMC free article] [PubMed] [Google Scholar]
- 39.Shimada T, Tomatsu S, Mason RW, Yasuda E, Mackenzie WG, Hossain J, Shibata Y, Montano AM, Kubaski F, Giugliani R, Yamaguchi S, Suzuki Y, Orii KE, Fukao T, Orii T. Di-sulfated Keratan Sulfate as a Novel Biomarker for Mucopolysaccharidosis II, IVA, and IVB. JIMD reports. 2015;21:1–13. doi: 10.1007/8904_2014_330. [DOI] [PMC free article] [PubMed] [Google Scholar]
- 40.Shimada T, Tomatsu S, Yasuda E, Mason RW, Mackenzie WG, Shibata Y, Kubaski F, Giugliani R, Yamaguchi S, Suzuki Y, Orii K, Orii T. Chondroitin 6-Sulfate as a Novel Biomarker for Mucopolysaccharidosis IVA and VII. JIMD reports. 2014;16:15–24. doi: 10.1007/8904_2014_311. [DOI] [PMC free article] [PubMed] [Google Scholar]
- 41.Tomatsu S, Shimada T, Mason RW, Montano AM, Kelly J, LaMarr WA, Kubaski F, Giugliani R, Guha A, Yasuda E, Mackenzie W, Yamaguchi S, Suzuki Y, Orii T. Establishment of glycosaminoglycan assays for mucopolysaccharidoses. Metabolites. 2014;4:655–679. doi: 10.3390/metabo4030655. [DOI] [PMC free article] [PubMed] [Google Scholar]
- 42.Tomatsu S, Shimada T, Patel P, Mason R, Mikami T, Kitagawa H, Akama T, Montano AM, Orii T. Chondroitin and Keratan Sulfate. Nova Science. 2015 [Google Scholar]
- 43.Saad OM, Ebel H, Uchimura K, Rosen SD, Bertozzi CR, Leary JA. Compositional profiling of heparin/heparan sulfate using mass spectrometry: assay for specificity of a novel extracellular human endosulfatase. Glycobiology. 2005;15:818–826. doi: 10.1093/glycob/cwi064. [DOI] [PubMed] [Google Scholar]
- 44.Wei W, Ninonuevo MR, Sharma A, Danan-Leon LM, Leary JA. A comprehensive compositional analysis of heparin/heparan sulfate-derived disaccharides from human serum. Analytical chemistry. 2011;83:3703–3708. doi: 10.1021/ac2001077. [DOI] [PMC free article] [PubMed] [Google Scholar]
- 45.Zhang Y, Conrad AH, Tasheva ES, An K, Corpuz LM, Kariya Y, Suzuki K, Conrad GW. Detection and quantification of sulfated disaccharides from keratan sulfate and chondroitin/dermatan sulfate during chick corneal development by ESI-MS/MS. Investigative ophthalmology & visual science. 2005;46:1604–1614. doi: 10.1167/iovs.04-1453. [DOI] [PubMed] [Google Scholar]
- 46.Hintze JP, Tomatsu S, Fujii T, Montano AM, Yamaguchi S, Suzuki Y, Fukushi M, Ishimaru T, Orii T. Comparison of liquid chromatography-tandem mass spectrometry and sandwich ELISA for determination of keratan sulfate in plasma and urine. Biomarker insights. 2011;6:69–78. doi: 10.4137/BMI.S7451. [DOI] [PMC free article] [PubMed] [Google Scholar]
- 47.Martell LA, Cunico RL, Ohh J, Fulkerson W, Furneaux R, Foehr ED. Validation of an LC-MS/MS assay for detecting relevant disaccharides from keratan sulfate as a biomarker for Morquio. A syndrome Bioanalysis. 2011;3:1855–1866. doi: 10.4155/bio.11.172. [DOI] [PubMed] [Google Scholar]
- 48.Tomatsu S, Kubaski F, Sawamoto K, Mason RW, Yasuda E, Shimada T, Montano AM, Yamaguchi S, Suzuki Y, Orii T. Newborn screening and diagnosis of mucopolysaccharidoses: application of tandem mass spectrometry. Nihon Masu Sukuriningu Gakkai shi = Journal of Japanese Society for Mass-Screening. 2014;24:19–37. [PMC free article] [PubMed] [Google Scholar]
- 49.de Ruijter J, de Ru MH, Wagemans T, Ijlst L, Lund AM, Orchard PJ, Schaefer GB, Wijburg FA, van Vlies N. Heparan sulfate and dermatan sulfate derived disaccharides are sensitive markers for newborn screening for mucopolysaccharidoses types I, II and III. Molecular genetics and metabolism. 2012;107:705–710. doi: 10.1016/j.ymgme.2012.09.024. [DOI] [PubMed] [Google Scholar]
- 50.Johnson BA, van Diggelen OP, Dajnoki A, Bodamer OA. Diagnosing lysosomal storage disorders: mucopolysaccharidosis type II. Current protocols in human genetics. 2013;79 doi: 10.1002/0471142905.hg1714s79. Unit 17 14. [DOI] [PubMed] [Google Scholar]
- 51.Tomatsu S, Almeciga-Diaz CJ, Montano AM, Yabe H, Tanaka A, Dung VC, Giugliani R, Kubaski F, Mason RW, Yasuda E, Sawamoto K, Mackenzie W, Suzuki Y, Orii KE, Barrera LA, Sly WS, Orii T. Therapies for the bone in mucopolysaccharidoses. Molecular genetics and metabolism. 2015;114:94–109. doi: 10.1016/j.ymgme.2014.12.001. [DOI] [PMC free article] [PubMed] [Google Scholar]
- 52.Rowan DJ, Tomatsu S, Grubb JH, Montano AM, Sly WS. Assessment of bone dysplasia by micro-CT and glycosaminoglycan levels in mouse models for mucopolysaccharidosis type I, IIIA, IVA, and VII. Journal of inherited metabolic disease. 2013;36:235–246. doi: 10.1007/s10545-012-9522-x. [DOI] [PMC free article] [PubMed] [Google Scholar]
- 53.Shimada T, Kelly J, LaMarr WA, van Vlies N, Yasuda E, Mason RW, Mackenzie W, Kubaski F, Giugliani R, Chinen Y, Yamaguchi S, Suzuki Y, Orii KE, Fukao T, Orii T, Tomatsu S. Novel heparan sulfate assay by using automated high-throughput mass spectrometry: Application to monitoring and screening for mucopolysaccharidoses. Molecular genetics and metabolism. 2014;113:92–99. doi: 10.1016/j.ymgme.2014.07.008. [DOI] [PMC free article] [PubMed] [Google Scholar]
- 54.Erickson RP, Sandman R, Epstein CJ. Lack of relationship between blood and urine levels of glycosaminoglycans and lysomal enzymes. Biochemical medicine. 1975;12:331–339. doi: 10.1016/0006-2944(75)90064-2. [DOI] [PubMed] [Google Scholar]
- 55.Savillea JT. Glycosaminoglycan fragments as a measure of disease burden in the mucopolysaccharidosis type I mouse. Molecular genetics and metabolism. 2017 doi: 10.1016/j.ymgme.2017.12.007. (in press) [DOI] [PubMed] [Google Scholar]
- 56.Khan S, Almeciga-Diaz CJ, Sawamoto K, Mackenzie WG, Theroux MC, Pizarro C, Mason RW, Orii T, Tomatsu S. Mucopolysaccharidosis IVA and glycosaminoglycans. Molecular genetics and metabolism. 2017;120:78–95. doi: 10.1016/j.ymgme.2016.11.007. [DOI] [PMC free article] [PubMed] [Google Scholar]
- 57.Tomatsu S, Montano AM, Oguma T, Dung VC, Oikawa H, de Carvalho TG, Gutierrez ML, Yamaguchi S, Suzuki Y, Fukushi M, Kida K, Kubota M, Barrera L, Orii T. Validation of keratan sulfate level in mucopolysaccharidosis type IVA by liquid chromatography-tandem mass spectrometry. Journal of inherited metabolic disease. 2010;33(Suppl 3):S35–42. doi: 10.1007/s10545-009-9013-x. [DOI] [PubMed] [Google Scholar]
- 58.Auray-Blais C, Lavoie P, Tomatsu S, Valayannopoulos V, Mitchell JJ, Raiman J, Beaudoin M, Maranda B, Clarke JT. UPLC-MS/MS detection of disaccharides derived from glycosaminoglycans as biomarkers of mucopolysaccharidoses. Analytica chimica acta. 2016;936:139–148. doi: 10.1016/j.aca.2016.06.054. [DOI] [PubMed] [Google Scholar]