

Abstract
Water soluble spin-crossover (SCO) iron(II) nanoparticles (NPs) were synthesized by the polyethylene glycol (PEG) coating of [Fe(Htrz)3-3×(NH2trz)3×](BF4)2 (x = 0, 0.1, 0.5 and 1). The NPs with x = 0.1 show gradual SCO behavior over 280–330 K in water. The relaxation times, T1 and T2, were determined and the thermally-responsive T2 values making these NPs a candidate for use as a MRI contrast agent.
Introduction
Magnetic resonance imaging (MRI) is a useful diagnostic medical tool for the non-invasive visualization of internal body parts. For the imaging, the hydrogen nucleus is used because of its abundance in water and fat. The time taken for the protons to fully relax is measured in two ways. The first is the time taken for the magnetic vector to return to its resting state and the second is the time needed for the axial spin to return to its resting state. The first is called T1 relaxation, the second is called T2 relaxation. A MRI contrast agent is normally employed to enhance the MRI image. Commonly, Gd-chelate compounds1 and iron oxide materials2,3 are used as MRI contrast agents. The Gd-chelate compounds are especially effective owing to the large spin quantum number of Gd(III) (S = 7/2). Nevertheless, nephrogenic systemic fibrosis (NSF) is known as a serious kidney disease that can result from the use of such Gd-chelate contrast agents4–6. This provides a motivation for the development of new contrast agents not based on Gd(III).
Recent studies have demonstrated that SCO materials can potentially be employed as MRI contrast agents7,8. Spin crossover (SCO) materials undergo a change in their spin state between high-spin (HS) and low-spin (LS) on exposure to external stimuli, i.e., temperature, pressure, magnetic field, and light irradiation. Such materials have been intensively investigated for use in applications such as information storage, sensor development, and display technologies9–11. SCO iron(II) complexes undergo a spin state change (ΔM in Fig. 1) between LS (S = 0) and HS (S = 2) that is temperature dependent. Generally, tumor cells are more thermally-sensitive than normal cells, and the temperature of tumor cells can be readily increased by means of hyperthermia treatment12,13. In view of this, SCO materials can in principle be employed as MRI contrast agents by using the change of their magnetism with temperature when the temperature of tumor cells is higher than nomal cells.
Figure 1.
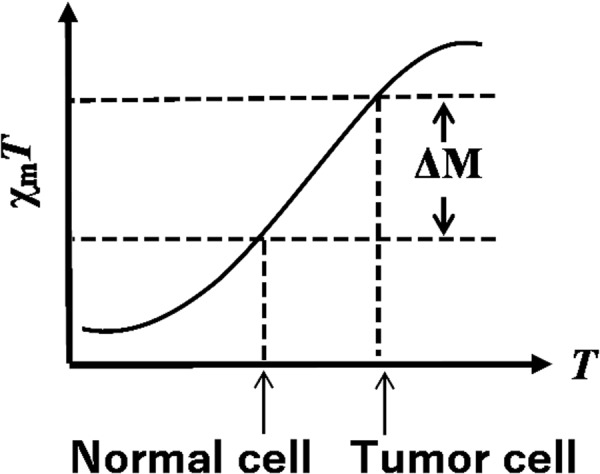
Application of SCO to MRI.
In this work, we focused on the use of iron(II) SCO materials of type [Fe(Htrz)3-3×(NH2trz)3×](BF4)2 (Htrz = 1,2,4-1H-triazole, NH2trz = 4-NH2-1,2,4-triazole, and x = 0, 0.1, 0.5 and 1) as candidates for use as new contrast agents14–16. For practical application in MRI, water dispersion is important and to this end we synthesized the SCO nanoparticles (NPs) with a PEG coating. Here, we report a study of these thermally-responsive MRI contrast agents based on the SCO NPs.
Magnetic susceptibility measurements for the NPs with x = 0, 0.1, 0.5 and 1 in aqueous dispersion were performed by NMR measurements. The χmT values (χm, molar magnetic susceptibility; T, temperature) were estimated by the Evans method employing eq. (1) below (Fig. S5)17–19; the calculation parameters are given in Table S2. All NPs showed gradual SCO behaviour over the temperature range 283–323 K.
| 1 |
: Molar paramagnetic susceptibility in cm3 mol−1.
∆f: Frequency difference between the two peaks of inner and outer tube in Hz.
MP: Molecular weight of the substance in g mol−1.
f: Frequency of NMR instruments in Hz.
m: Mass of the substance in 1 mL of solution in g mL−1.
: Mass susceptibility of the solvent in cm3 mol−1.
: Density of the solvent in g cm−3.
: Density of the solution in g cm−3.
: Diamagnetic correction for the magnetic susceptibility in cm3 mol−1.
Results
Of all the NPs investigated, [Fe(Htrz)2.7(NH2trz)0.3](BF4)2 (1) exhibited the steepest SCO behaviour (Fig. 2; that is, it showed the largest temperature dependence of χmT). Hence, we employed this NP derivative for use in our MRI investigation. The synthesized NPs 1 were dispersed in water and measured by transmission electron microscopy (TEM) to confirm that nanoparticulation had occurred. As estimated by TEM, the particle size was mainly around 20 nm (Fig. 3). The powder X-ray diffraction (PXRD) patterns for compound 1 and its corresponding NPs (NPs 1) were determined at room temperature. The patterns for 1 and its NPs are almost the same, in accord with the NPs being successfully synthesized with the structure of 1 being retained intact (Fig. S2). NPs 1 were dispersed in water and investigated by NMR to obtain the T1 and T2 relaxation times (Figs 4 and 5). In the absence of NPs, water molecules gave a T10 relaxation of 2.94 s at 20 °C. On the other hand, the T1 relaxation time was 2.03 s for the aqueous dispersion of NPs at 20 °C. NMR measurements were also carried out at higher temperatures: 50 °C for water and the aqueous dispersion of NPs. The T10 relaxation time for water was 4.70 s (50 °C), while for the aqueous dispersion of NPs it was T1 = 3.20 s (50 °C). The correlation between T10 and T1 relaxation times vs. temperature is shown in Fig. 4. We observed that the T1 relaxation time of water molecules with or without any contrast agent becomes longer with increasing temperature. The slope of the linear T1 vs T plot for water is 0.1215 (Fig. 4). However, in the case of the aqueous dispersion of NPs, the slope is only 0.0395. This difference between the slopes indicates that the presence of the NPs strongly shortens the T1 relaxation time at higher temperature (50 °C) compared to the lower temperature (20 °C). As such, these results demonstrate that a temperature-dependent shortening effect on the proton relaxation time occurs. The relaxivity (r) of the MRI contrast agent was calculated using equations (2 and 3).
| 2 |
| 3 |
T10: T1 relaxation time for original sample (s).
Figure 2.
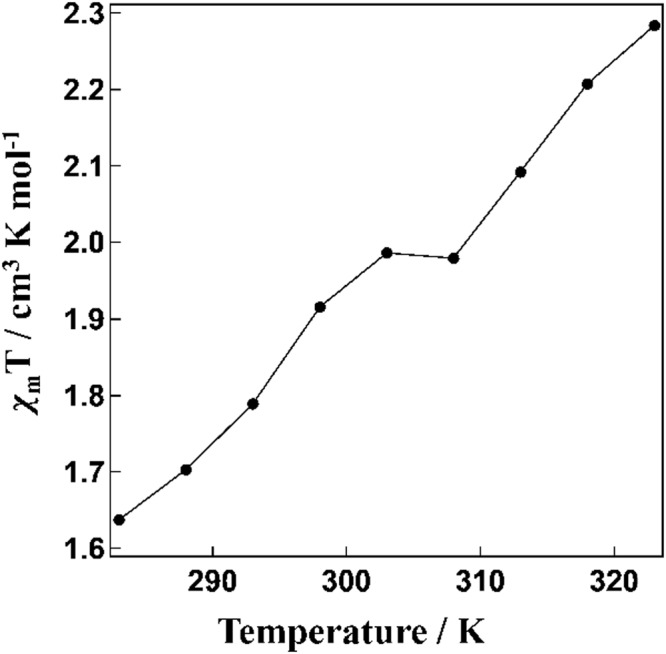
χmT vs T plot for NPs 1 in water.
Figure 3.
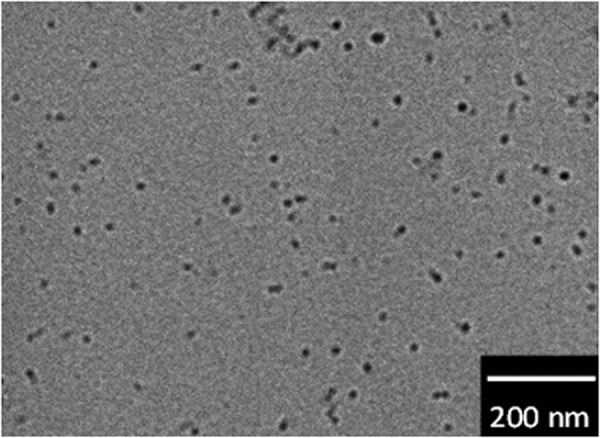
TEM image of NPs 1.
Figure 4.
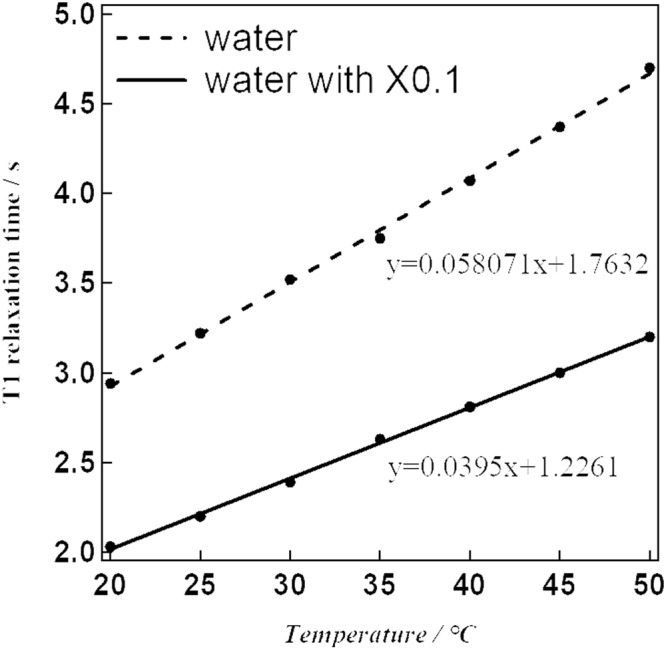
T1 relaxation time vs temperature plot.
Figure 5.
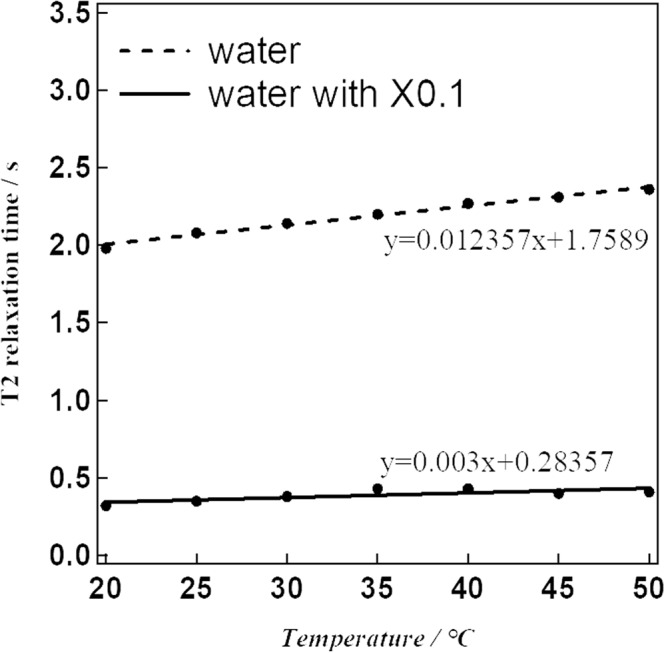
T2 relaxation time vs temperature plot.
T1: T1 relaxation time shortened by contrast agent (s).
r1: Relaxivity for T1 relaxation time (mM−1 s−1).
T20: T2 relaxation time for original sample (s).
T2: T2 relaxation time shortened by contrast agent (s).
r2: Relaxivity for T2 relaxation time (mM−1 s−1).
C: Concentration of contrast agent (mM).
Discussion
The T1 relaxivity (r1) values were 0.16 mM−1 s−1 at 20 °C and 0.10 mM−1 s−1 at 50 °C. The corresponding proton relaxation time of water at 50 °C was calculated using the linear equation given in Fig. 4; the calculation parameters are listed in Table 1. The calculated r1 value is far from that for the commonly used MRI contrast agent, Gd-DTPA20. T2 relaxation times were also obtained by NMR measurements (Fig. 5). At 20 °C, the values were 1.98 for water and 0.32 s for the aqueous dispersion of NPs. In higher temperature experiments, the T2 relaxation times were 2.36 s for water at 50 °C and 0.41 s for the aqueous dispersion of NPs at 50 °C. The slope of the linear plot for the T2 relaxation time of water was 0.003. While for the aqueous dispersion of NPs, the slope was effectively zero. As for the T1 relaxation times, this result shows that the presence of the NPs strongly shortens the T2 proton relaxation time at the higher temperature (50 °C). The calculated T2 relaxivities (r2) were 2.44 mM−1 s−1 at 20 °C and 1.91 mM−1 s−1 at 50 °C, respectively. The calculated parameters are shown in Table 1. The ratio of transverse/longitudinal relaxivity, r2/r1, was found to be 19.1 at 50 °C, which seems an effective value for the use as a negative contrast agent.
Table 1.
Calculation parameters for T1 relaxivity (r1) and T2 relaxivity (r2). Concentration; 1.0 × 10⁻³ M.
| Temperature | T10 | T1 | r 1 | T20 | T2 | r 2 |
|---|---|---|---|---|---|---|
| 20 °C | 2.94 | 2.03 | 0.16 | 1.98 | 0.32 | 2.44 |
| 50 °C | 4.7 | 3.2 | 0.10 | 2.36 | 0.41 | 1.91 |
In conclusion, we have synthesized the iron(II) triazole NPs (1). The NPs showed gradual spin transition around 300 K in aqueous dispersion and temperature-dependent shortened proton relaxation times. The calculated r2/r1 value indicates that NPs is a candidate for use as a thermally-responsive T2 shortening MRI contrast agent.
Methods
Physical measurements
The magnetic susceptibility in the solution was carried out with a JEOL (500-ECX) instrument operating at 500 MHz by the Evens method using D2O. The inner tube was filled with 1% t-BuOH in D2O solution. The NPs were dispersed in D2O solution containing 2% t-BuOH, and the dispersion liquid was added to the outer tube. Transmission electron microscopy (TEM) was performed to determine particle sizes (JEOL, 2000FX, 200 kV). NPs were dispersed in water and deposited on a holey carbon film. Powder X-ray diffract grams were recorded on a Rigaku X-ray diffractometer (RAD-2A with a 2.0 kW CuKα X-ray). The T1 and T2 relaxation times were performed on 1H NMR spectroscopy. The experiments were carried out with a Bruker AvanceIII at 500 MHz. The water sample was measured with the aid of double-walled NMR tube. The water sample was prepared by H2O was put in the inner tube and 99.8% of D2O was added to the outer tube. The NPs were dissolved in mixed solution 97% H2O and 3% D2O at a concentration of 1 mM and measured with single NMR tube. The magnetic susceptibilities in the solid state for NPs and bulk samples were measured between 100 K and 400 K with a superconducting quantum interference device (SQUID) magnetometer (Quantum Design MPMS-XL). Atomic absorption analysis was performed to measure the ratio of SCO complex in the NPs with an atomic absorption spectrometer (PerkinElmer, PinAAcle 500). Each NP sample (10 mg) was dissolved in 100 mL of 0.1 M nitric acid aqueous solution before measurement (Fig. S1 and Table S1).
Electronic supplementary material
Acknowledgements
This work was supported by KAKENHI Grant−in−Aid for Scientific Research (A) JP17H01200.
Author Contributions
S.H. conceived and designed the project; A.T., K.S.M., H.K., H.T., S.Y. and M.T. performed the experiments and analysed the data; A.T., K.S.M., H.K., H.T., S.Y., M.T., L.F.L. and S.H. co-wrote the paper.
Competing Interests
The authors declare no competing interests.
Footnotes
Publisher's note: Springer Nature remains neutral with regard to jurisdictional claims in published maps and institutional affiliations.
Electronic supplementary material
Supplementary information accompanies this paper at 10.1038/s41598-018-33362-6.
References
- 1.Huang Y, et al. Chitosan oligosaccharide based Gd-DTPA complex as a potential bimodal magnetic resonance imaging contrast agent. Magnetic Resonance Imaging. 2016;34:1–7. doi: 10.1016/j.mri.2015.10.006. [DOI] [PubMed] [Google Scholar]
- 2.Basti H, et al. Catechol derivatives-coated Fe3O4 and γ-Fe2O3 nanoparticles as potential MRI contrast agents. J. Colloid. Interface. Sci. 2010;341:248–254. doi: 10.1016/j.jcis.2009.09.043. [DOI] [PubMed] [Google Scholar]
- 3.Thapa B, Diaz-Diestra D, Beltran-Huarac J, Weiner BR, Morell G. Enhanced MRI T 2 Relaxivity in Contrast-Probed Anchor-Free PEGylated Iron Oxide Nanoparticles. Nano. Res. Lett. 2017;12:312–324. doi: 10.1186/s11671-017-2084-y. [DOI] [PMC free article] [PubMed] [Google Scholar]
- 4.Abujudeh HH, et al. Nephrogenic systemic fibrosis after gadopentetate dimeglumine exposure: case series of 36 patients. Radiology. 2009;1:81–89. doi: 10.1148/radiol.2531082160. [DOI] [PubMed] [Google Scholar]
- 5.Hellman RN. Gadolinium-induced nephrogenic systemic fibrosis. Semin. Nephrol. 2011;3:310–316. doi: 10.1016/j.semnephrol.2011.05.010. [DOI] [PubMed] [Google Scholar]
- 6.Abu-Alfa AK. Nephrogenic systemic fibrosis and gadolinium-based contrast agents. Adv. Chronic Kidney Dis. 2011;3:188–198. doi: 10.1053/j.ackd.2011.03.001. [DOI] [PubMed] [Google Scholar]
- 7.Jeon I-R, Park JG, Haney CR, Harris TD. Spin crossover iron(II) complexes as PARACEST MRI thermometers. Chem. Sci. 2014;5:2461–2465. doi: 10.1039/C4SC00396A. [DOI] [Google Scholar]
- 8.Venkataramani S, et al. Magnetic bistability of molecules in homogeneous solution at room temperature. Science. 2011;331:445–448. doi: 10.1126/science.1201180. [DOI] [PubMed] [Google Scholar]
- 9.Sato O, Iyoda T, Fujishima S, Hashimoto K. Photoinduced Magnetization of a Cobalt-Iron Cyanide. Science. 1996;272:704–705. doi: 10.1126/science.272.5262.704. [DOI] [PubMed] [Google Scholar]
- 10.Chastanet G, Gaspar AB, Real JA, Létard J-F. Photo-switching spin pairs—synergy between LIESST effect and magnetic interaction in an iron(II) binuclear spin-crossover compound. Chem. Commun. 2001;0:819–820. doi: 10.1039/b100426n. [DOI] [Google Scholar]
- 11.Hayami S, et al. Photo-Induced Spin Transition of Iron(III) Compounds with π–π Intermolecular Interactions. Chem. Eur. J. 2009;15:3497–3508. doi: 10.1002/chem.200802395. [DOI] [PubMed] [Google Scholar]
- 12.Lawson RN, Chughtai MS. Breast Cancer and BodyTemperature. Canad. Med. Ass. J. 1963;88:68–70. [PMC free article] [PubMed] [Google Scholar]
- 13.Hayashi K, et al. Magnetically Responsive Smart Nanoparticles for Cancer Treatment with a Combination of Magnetic Hyperthermia and Remote-Control Drug Release. Theranostics. 2014;4:834–844. doi: 10.7150/thno.9199. [DOI] [PMC free article] [PubMed] [Google Scholar]
- 14.Krober J, AudiBre J-P, Claude R, Codjovi E, Kahn O. Spin Transitions and Thermal Hysteresis in the Molecular-Based Materials [Fe(Htrz)2(trz)](BF4) and [Fe(Htrz)3](BF4)2.cntdot.H2O (Htrz = 1,2,4-4H-triazole; trz = 1,2,4-triazolato) Chem. Mater. 1994;6:1404–1412. doi: 10.1021/cm00044a044. [DOI] [Google Scholar]
- 15.Kahn O, Krober J, Jay C. Spin Transition Molecular Materials for displays and data recording. Adv. Mater. 1992;4:718–728. doi: 10.1002/adma.19920041103. [DOI] [Google Scholar]
- 16.Kahn O, Martinez CJ. Spin-Transition Polymers: From Molecular Materials Toward Memory Devices. Science. 1998;279:44–48. doi: 10.1126/science.279.5347.44. [DOI] [Google Scholar]
- 17.Schubert EM. Utilizing the Evans Method with a Superconducting NMR Spectrometer in the Undergraduate Laborator. J. Chem. Educ. 1992;69:62. doi: 10.1021/ed069p62.1. [DOI] [Google Scholar]
- 18.Sur SK. Measurement of magnetic susceptibility and magnetic moment of paramagnetic molecules in solution by high-field fourier transform NMR spectroscopy. J. Magn. Reson. 1989;82:169–173. [Google Scholar]
- 19.Bain GA, Berry JF. Diamagnetic Corrections and Pascal’s Constants. J. Chem. Educ. 2008;85:532–536. doi: 10.1021/ed085p532. [DOI] [Google Scholar]
- 20.Zhou X, et al. Dopamine-containing gadolinium complex as magnetic resonance imaging contrast agent. J. Rare Earths. 2012;30:884–889. doi: 10.1016/S1002-0721(12)60150-1. [DOI] [Google Scholar]
Associated Data
This section collects any data citations, data availability statements, or supplementary materials included in this article.