Abstract
Background: OPRM1-A118G polymorphism (A > G, rs1799971) is associated with interindividual variability in both response to postoperative pain and opioid treatment. The aim of this meta-analysis is to identify the predictive strength in the current literature of OPRM1-A118G polymorphism to postoperative anesthetic reactions, including nausea, vomiting, pruritus and dizziness. Methods: PubMed, EMBASE, Cochrane Library, Web of Knowledge, Google Scholar and CNKI database were searched to find gene-association researches exploring the impacts of OPRM1-A118G polymorphism on postoperative side effects (time: up to July 2016). Odd ratios (ORs) with 95% confidence intervals (95% CIs) were estimated in allele model, homozygote model, heterozygote model, dominant model and recessive model. Sensitivity analysis and potential bias were also assessed. Results: 137 articles were retrieved from databases. 17 eligible studies, including 4690 patients were considered in the meta-analysis. The ORs with 95% CIs of postoperative nausea, vomiting, nausea and vomiting (PONV), pruritus and dizziness in the five genetic models mentioned above were determined. Postoperative vomiting was significantly associated with OPRM1-A118G polymorphism in homozygote (OR: 0.422; 95% CI: 0.254, 0.701; P = 0.001), dominant (OR: 0.765; 95% CI: 0.592, 0.987; P = 0.040) and recessive (OR: 0.439; 95% CI: 0.268, 0.717; P = 0.001) models. The 118G allele was associated with a reduced risk of vomiting. No other associations were detected. There was no evidence of publication bias. Conclusions: OPRM1-A118G polymorphism (A > G) is associated with a reduced risk of postoperative vomiting, but not nausea, pruritus and dizziness. The results should be interpreted with caution due to limited sample and possible heterogeneity between the included studies. Well-designed and large-scale studies are necessary to confirm our results.
Keywords: Opioid receptor mu 1, A118G, postoperative, nausea and vomiting, rs1799971
Introduction
Despite identifying risk factors and improving treatments for prevention, postoperative nausea and vomiting (PONV) remains a common occurrence after general anesthesia with estimated rates of PONV as high as 80% in certain high-risk settings [1,2]. Aside from the distress associated with nausea and vomiting, occurrence of PONV can lend significant morbidity [3,4]. Although PONV is often regarded as a necessary circumstance of surgery, efforts have been forged to eliminate its occurrence especially in the highest-risk populations [5,6]. Multimodal approaches to the prevention of PONV have been borne of this collective enterprise, but a great deal of work remains.
The μ-opioid receptor (OPRM1) A118G single nucleotide polymorphism has been a major focus of research for the pharmacogenetics of opioid response [7]. Emerging knowledge regarding the molecular mechanisms regulating pain in animal models has increased the hopes of identifying personalized pain therapies [8]. Many studies also investigated the association between OPRM1-A118G polymorphism and the risks of postoperative reactions to anesthesia, including nausea, vomiting, pruritus and dizziness, but no consensus has been achieved. For example, Tan et al. found that 118G allele was associated with a reduced risk of nausea in spite of higher morphine usage [9]. The AA group had the highest nausea score of 0.033 (SD = 0.006) while the GG group had the lowest at 0.009 (SD = 0.004) [9]. In Sia et al.’s study, however, there was no statistically significant association of OPRM1 118A > G with time-averaged nausea scores or the incidence of vomiting [10]. To further elucidate this relationship, we accumulated data from different case control studies to perform this meta-analysis.
Methods
We conducted this meta-analysis of observational prospective studies in accordance to the recommendations of the Meta-analysis of Observational Studies in Epidemiology (MOOSE) group and the reporting guideline of the PRISMA statement.
Publication search and selection criteria
Two authors independently searched the database of Embase, PubMed, Cochrane Library, Chinese National Knowledge Infrastructure (CNKI), and Web of Knowledge (time: ~ March 1st, 2017) to enroll case control studies studying the correlation between the polymorphism of OPRM1-A118G (rs1799971) and postoperative adverse reactions to anesthesia. Search terms include “postoperative” and “rs1799971 or A118G or OPRM1”. We also reviewed related references to find other potentially eligible studies. The inclusion and exclusion criteria are listed in Table 1. Detailed searching strategies were in Table 2. Reference lists attached in retrieved articles were also collected. Related meeting abstracts were also searched to overcome publication bias. No language restrictions were imposed.
Table 1.
Inclusion criteria for study selection in this meta-analysis
| Number | Inclusion criteria |
|
| |
| 1 | Original observational studies published in full text and those for which we had full access to all original data and protocols |
| 2 | The studies evaluated the associations between OPRM1 A118G polymorphism and postoperative side effects. |
| 3 | The studies included detailed genotyping data (total number of cases and controls, number of cases and controls with A/A, A/G, and G/G genotypes). |
| 4 | Studies focusing on human being. |
| 5 | predefined outcomes: incidence of postoperative nausea, vomiting, nausea and vomiting (PONV), pruritus, dizziness, et al. |
| 6 | No minimal sample size or dosing regimen was required for inclusion. |
|
| |
| Number | Exclusion criteria |
|
| |
| 1 | The report focused exclusively on other topics, such as addiction or sensitivity. |
| 2 | No human data were included. |
| 3 | The human 118A > G variant was not included, or no data were reported for this variant. |
| 4 | The genotype distribution of the control population was not in accordance with the Hardy-Weinberg equilibrium (HWE). |
| 5 | Reviews and duplicated publications. |
Table 2.
Searching strategies and results for different databases
| Database | Database URL | Search strategy | Results | |
|
| ||||
| Pubmed | https://www.ncbi.nlm.nih.gov/pubmed/ | Postoperative [Title/Abstract] AND ((rs1799971 [Title] OR A118G [Title]) OR OPRM1 [Title]) | 30 | |
| Embase | https://www.embase.com/ | rs1799971:ti OR A118G:ti OR OPRM1:ti AND postoperative:ab,ti | 38 | |
| Cochrane Library | http://www.cochranelibrary.com/ | A118G and postoperative:ti,ab,kw (Word variations have been searched) | 4 | |
| Web of Science | http://apps.webofknowledge.com/ | TOPIC: (A118G AND postoperative) Timespan: All years. Indexes: SCI-EXPANDED, SSCI, A&HCI, ESCI. | 59 | |
| CNKI | http://www.cnki.net/ | Search criteria: ((topic = A118G or topic = OPRM1) and (title = postoperative or title = anesthesia)) (exact match), album navigation: all; Database: literature cross-library retrieval method: cross-library retrieval database: literature | 6 | |
|
| ||||
| Searching results and information of relevant academic meeting abstracts | ||||
|
| ||||
| Year | City | Meeting name | Article title | Whether included |
|
| ||||
| 2014 | Chengdu, Sichuan Province, P.R. China | The 14th Academic Annual Conference of Chinese Medical Association Clinical Pharmacy Branch | Genetic-opioid association of the OPRM1 A118G Polymorphism in postoperative pain: systemic review and meta-analysis | No |
Data extraction
According to the inclusion criteria set in Table 1, two independent authors reviewed and extracted the needed data and information from the included articles. We gathered the following data: author name, publication year, country, ethnicity (Asian, Caucasian or others), language, surgery name, genotyping methods, sample size with three or two genotype groups, total number of cases with and without adverse reactions in A/A, A/G and G/G genotype groups, and P value for Hardy-Weinberg equilibrium (HWE). Disagreements between evaluators were resolved by consensus or consultation with a third investigator.
Methodological quality assessment
According to the methodological quality assessment scale (see Table 3), which was adjusted from a previous publication [11], two authors independently estimated the qualities of the included studies. Disagreement would be solved by discussion. In this methodological quality assessment scale, five items, including quality control of genotyping methods, source of controls, sample size, cases representativeness and HWE were carefully checked. The quality scores range between 0~10 with best quality of 10 and worst quality of 0.
Table 3.
Scale for methodological quality assessment
| Criteria | Score |
|---|---|
| Representativeness of cases | |
| RA diagnosed according to acknowledged criteria | 2 |
| Mentioned the diagnosed criteria but not specifically described | 1 |
| Not Mentioned | 0 |
| Source of controls | |
| Population or community based | 3 |
| Hospital-based RA-free controls | 2 |
| Healthy volunteers without total description | 1 |
| RA-free controls with related diseases | 0.5 |
| Not described | 0 |
| Sample size | |
| > 300 | 2 |
| 200-300 | 1 |
| < 200 | 0 |
| Quality control of genotyping methods | |
| Repetition of partial/total tested samples with a different method | 2 |
| Repetition of partial/total tested samples with the same method | 1 |
| Not described | 0 |
| Hardy-Weinberg equilibrium (HWE) | |
| Hardy-Weinberg equilibrium in control subjects | 1 |
| Hardy-Weinberg disequilibrium in control subjects | 0 |
Statistical analysis
This meta-analysis was in accordance with the PRISMA checklists and guidelines [12]. HWE in each study was first assessed, followed by the calculation of ORs with 95% CIs reflecting the correlation strength between OPRM1-A118G polymorphism and the incidence of adverse reactions to anesthesia. The pooled ORs were estimated and used for comparisons respectively in allele model (G vs. A), homozygote model (GG vs. AA), heterozygote model (AG vs. AA), dominant model (AG + GG vs. AA), and recessive model (GG vs. AA + AG). As Caucasian-population-based studies were not sufficient, ethnicity-specific subgroup (Caucasian and Asian) meta-analysis was not performed at this time. The Labbe plot, I2 test and Cochran’s Q-test (Table 4) were all conducted to estimate the heterogeneity among the studies [13]. If no evidence of statistical heterogeneity was detected, we chose to use a fixed-effects model [14]. Otherwise, Laird’s and DerSimonian’s random-effects model would be adopted [14]. To access the stability of the pooled values, we also performed sensitivity analyses (explanation in Table 4) [11]. Using contour-enhanced funnel plots (Table 4), potential publication biases were estimated.
Table 4.
The statistical methods used in this meta-analysis and there explanation
| Statistic means | Goals and Usages | Explanation |
|---|---|---|
| Labbe plot | To evaluate heterogeneity between the included studies | In Labbe figure, if the points basically present as a linear distribution, it can be taken as an evidence of homogeneity. |
| Cochran’s Q test | To evaluate heterogeneity between the included studies | Cochran’s Q test is an extension to the McNemar test for related samples that provides a method for testing for differences between three or more matched sets of frequencies or proportions. Heterogeneity was also considered significant if P < 0.05 using the Cochran’s Q test. |
| I2 index test | To evaluate heterogeneity between the included studies | The I2 index measures the extent of true heterogeneity dividing the difference between the result of the Q test and its degrees of freedom (k-1) by the Q value itself, and multiplied by 100. I2 values of 25%, 50% and 75% were used as evidence of low, moderate and high heterogeneity, respectively. |
| Sensitivity analysis | To examine the stability of the pooled results | A sensitivity analysis was performed using the one-at-a-time method, which involved omitting one study at a time and repeating the meta-analysis. If the omission of one study significantly changed the result, it implied that the result was sensitive to the studies included. |
| Contour-enhanced funnel plot | Publication bias test | Visual inspection of the Contour-enhanced funnel plots was used to assess potential publication bias. Asymmetry in the plots, which may be due to studies missing on the left-hand side of the plot that represents low statistical significance, suggested publication bias. If studies were missing in the high statistical significance areas (on the right-hand side of the plot), the funnel asymmetry was not considered to be due to publication bias |
P < 0.05 was deemed as statistical significance. The statistical analysis was done through Review Manager 5.3 (The Cochrane Collaboration, Oxford, UK) and STATA 12.0 (StataCorp LP, College Station, TX, USA) software.
Results
Search results and characteristics of the studies
A total of 138 studies were identified in search: 30 in Pubmed, 38 in Embase, 4 in Cochrane Library, 59 in Web of Science, 6 in CNKI, and 1 academic meeting reports (Table 2).
Figure 1 showed the literature search process. A total of 17 articles [9,10,15-29] involving 4690 patients were included in the final analysis, 2 studies were performed in on patients of Caucasian backgrounds in France and Denmark (340 cases in total), and 15 were performed on patients of Asian backgroundsin China, Singapore, and Japan (4350 cases in total). The surgeries include orthopedic, gynecologic, abdominal, and thyroid surgeries. In all of the included studies, genotype distributions of OPRM1-A118G polymorphism (A > G) in the controls were consistent with HWE. A variety of genotyping methods were applied including direct sequencing, PCR-RFLP, SNPstream, etc Genomic miRNA was isolated from blood samples in all included studies. Postoperative nausea and postoperative vomiting results were both reported in 9 studies. Six studies reported PONV as a whole. Seven reported postoperative pruritus and 3 reported dizziness. The characteristics and methodological quality assessment of the studies included in this meta-analysis are shown in Table 5.
Figure 1.
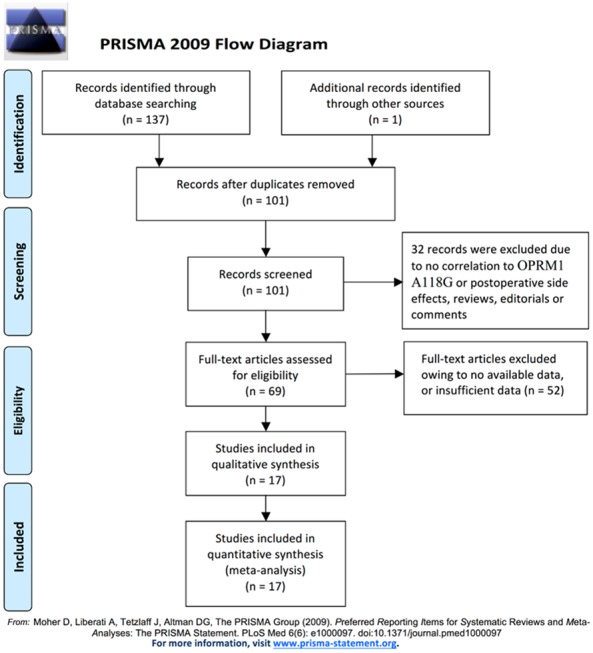
Literature search and selection of articles.
Table 5.
Characteristics of studies included in the meta-analysis
| Author | Year | Country | Ethnicity | Language | Surgery | Side effects | AA | AG | GG | P for HWE | Quality | ||||||
|---|---|---|---|---|---|---|---|---|---|---|---|---|---|---|---|---|---|
|
| |||||||||||||||||
| Total | Event | Normal | Total | Event | Normal | Total | Event | Normal | |||||||||
| Chou et al. | 2006a | China Taiwan | Asian | English | Total knee arthroplasty | Nausea | 74 | 6 | 68 | 33 | 0 | 33 | 13 | 1 | 12 | 0.0164 | 7 |
| Vomiting | 74 | 17 | 57 | 33 | 4 | 29 | 13 | 1 | 12 | 0.0133 | |||||||
| Pruritus | 74 | 3 | 71 | 33 | 0 | 33 | 13 | 0 | 13 | 0.0064 | |||||||
| Chou et al. | 2006b | China Taiwan | Asian | English | Hysterectomy | Vomiting | 43 | 7 | 36 | 19 | 4 | 15 | 18 | 1 | 17 | 0.0000 | 6 |
| Coulbault et al. | 2006 | France | Caucasian | English | Colorectal surgery | PONV | 57 | 17 | 40 | 15 | 6 | 9 | 2 | 0 | 2 | 0.1402 | 8 |
| Sia et al. | 2008 | Singapore | Asian | English | Cesarean section | Nausea | 272 | 6 | 266 | 234 | 3 | 231 | 82 | 1 | 81 | 0.0085 | 7 |
| Pruritus | 272 | 115 | 157 | 234 | 3 | 231 | 82 | 1 | 81 | 0.801 | |||||||
| Chen et al. | 2008 | China | Asian | Chinese | Myomectomy or hysterectomy | Nausea | 82 | 19 | 63 | 38 | 6 | 32 | 4 | 1 | 3 | 0.6586 | 8 |
| Vomiting | 82 | 2 | 80 | 38 | 4 | 34 | 4 | 0 | 4 | 0.8687 | |||||||
| Tan et al. | 2009 | Singapore | Asian | English | Cesarean section | Vomiting | 389 | 54 | 335 | 435 | 51 | 384 | 170 | 7 | 389 | 0.0049 | 7 |
| Zhang et al. | 2009 | China | Asian | Chinese | Myomectomy or hysterectomy | PONV | 94 | 31 | 63 | 76 | 23 | 53 | 24 | 3 | 21 | 0.0874 | 8 |
| Pruritus | 94 | 1 | 93 | 76 | 0 | 76 | 24 | 0 | 24 | 0.1777 | |||||||
| Zhang et al. | 2010 | China | Asian | English | Gynecologic surgery | PONV | 86 | 28 | 58 | 67 | 17 | 50 | 21 | 3 | 18 | 0.1876 | 8 |
| Pruritus | 86 | 1 | 85 | 67 | 0 | 67 | 21 | 0 | 21 | 0.1771 | |||||||
| Zhang et al. | 2011 | China | Asian | English | Gynecologic surgery | Nausea | 80 | 28 | 52 | 63 | 16 | 47 | 22 | 3 | 19 | 0.1402 | 7 |
| Vomiting | 80 | 17 | 63 | 63 | 8 | 55 | 22 | 2 | 20 | 0.1686 | |||||||
| Zwisler et al. | 2012 | Denmark | Caucasian | English | Primarily thyroidectomy | PONV | 219 | 44 | 175 | Total: 47 | Event: 10 | Normal: 37 | NA | 8 | |||
| Pruritus | 219 | 22 | 197 | Total: 47 | Event: 5 | Normal: 42 | NA | ||||||||||
| Dizziness | 219 | 153 | 66 | Total: 47 | Event: 38 | Normal: 9 | NA | ||||||||||
| Zhang et al. | 2013 | China | Asian | Chinese | Radical gastrectomy | Nausea | 54 | 16 | 38 | 53 | 22 | 31 | 21 | 9 | 12 | 0.1869 | 6 |
| Vomiting | 54 | 8 | 46 | 53 | 13 | 40 | 21 | 6 | 15 | 0.2071 | |||||||
| Dizziness | 54 | 14 | 40 | 53 | 22 | 31 | 21 | 7 | 14 | 0.0718 | |||||||
| Sia et al. | 2013 | Singapore | Asian | English | Hysterectomy | Nausea | 354 | 26 | 328 | 474 | 41 | 433 | 145 | 13 | 132 | 0.5733 | 9 |
| Pruritus | 354 | 8 | 346 | 474 | 14 | 460 | 145 | 4 | 141 | 0.5536 | |||||||
| Liu et al. | 2014 | China | Asian | English | Gynecologic surgery | Nausea | 78 | 41 | 37 | Total: 100 | Event: 36 | Normal: 64 | NA | 6 | |||
| Vomiting | 78 | 17 | 61 | Total: 100 | Event: 17 | Normal: 83 | NA | ||||||||||
| Pruritus | 78 | 5 | 73 | Total: 100 | Event: 3 | Normal: 97 | NA | ||||||||||
| Zhu et al. | 2014 | China | Asian | Chinese | Gynecologic surgery | PONV | 127 | 4 | 123 | 62 | 2 | 60 | 11 | 3 | 8 | 0.8417 | 7 |
| Chen et al. | 2015 | China | Asian | Chinese | Hysterectomy | Nausea | 112 | 16 | 96 | 136 | 17 | 119 | 24 | 1 | 23 | 0.1091 | 7 |
| Vomiting | 112 | 14 | 98 | 136 | 16 | 120 | 24 | 0 | 24 | 0.1435 | |||||||
| Zhang et al. | 2015 | China | Asian | Chinese | - | Nausea | 57 | 5 | 52 | 51 | 7 | 44 | 15 | 1 | 14 | 0.3367 | 8 |
| Vomiting | 57 | 3 | 54 | 51 | 4 | 47 | 15 | 1 | 14 | 0.8504 | |||||||
| Dizziness | 57 | 4 | 53 | 51 | 2 | 49 | 15 | 0 | 15 | 0.4914 | |||||||
| Sugino | 2016 | Japan | Asian | English | Abdominal or orthopedic surgery | PONV | 20 | 7 | 13 | 20 | 10 | 10 | 19 | 6 | 13 | 0.0077 | 8 |
Meta-analysis results
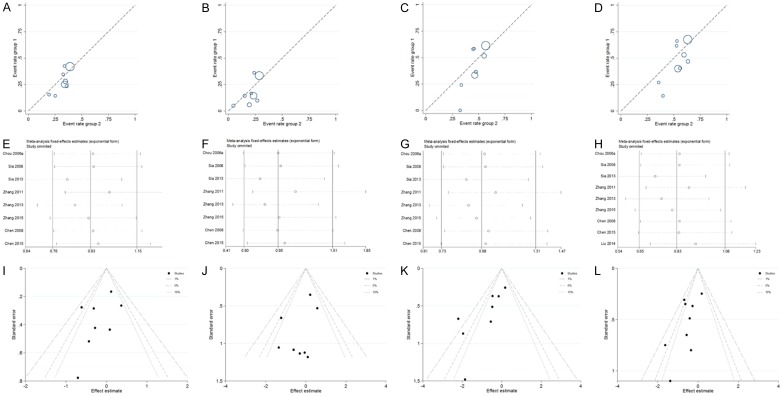
The main results regarding heterogeneity tests, effect models adopted accordingly, and the pooled OR with 95% CI and P value of this meta-analysis were shown in Table 6. The Labbe plots for nausea in allele model, homozygote model, heterozygote model and dominant model were shown in Figure 2A-D. Postoperative vomiting was significantly associated with OPRM1-A118G polymorphism in homozygote (OR: 0.422; 95% CI: 0.254, 0.701; P = 0.001; Figure 4B), dominant (OR: 0.765; 95% CI: 0.592, 0.987; P = 0.040; Figure 4D) and recessive (OR: 0.439; 95% CI: 0.268, 0.717; P = 0.001; Figure 4E) models, but not in the allele model (OR: 0.787; 95% CI: 0.549, 1.128; P = 0.192; Figure 4A) and the heterozygote model (OR: 0.912; 95% CI: 0.686, 1.213; P = 0.528; Figure 4C). The 118G allele was associated with a reduced risk of vomiting. For postoperative nausea, pruritus, dizziness and PONV as a whole based on the available data, the associations were not statistically significant in any of the five genetic models (see Figures 3 and 5, 6 and 7; Table 6). Although ethnicity may have an effect on this association, since there were only two Caucasian-population-based studies, ethnicity-specific subgroup analysis was not performed.
Table 6.
The results of meta-analysis for different postoperative side effects in various genotype models
| Genetic model | Heterogeneity test | Test of Association | Publication bias | |||||||||||
|---|---|---|---|---|---|---|---|---|---|---|---|---|---|---|
|
| ||||||||||||||
| Name | Side effects | Q value | d.f. | I-squared | Tau-squared | P Value | Heterogeneity | Effect model | Pooled OR | 95% CI | Z value | P value | Statistical significance | |
| Allele model (G vs. A) | Nausea | 9.96 | 7 | 29.7% | NA | 0.191 | No | Fixed | 0.922 | [0.753, 1.130] | 0.78 | 0.436 | No | No |
| Vomiting | 14.59 | 7 | 52.0% | 0.1248 | 0.042 | Yes | Random | 0.787 | [0.549, 1.128] | 1.30 | 0.192 | No | ||
| PONV | 10.18 | 4 | 60.7% | 0.1903 | 0.038 | Yes | Random | 0.929 | [0.562, 1.536] | 0.29 | 0.774 | No | ||
| Pruritus | 58.66 | 4 | 93.2% | 6.1569 | 0.000 | Yes | Random | 0.258 | [0.024, 2.830] | 1.11 | 0.268 | No | ||
| Dizziness | 2.24 | 1 | 55.3% | NA | 0.135 | No | Fixed | 1.145 | [0.700, 1.871] | 0.54 | 0.589 | No | ||
| Homozygote model (GG vs. AA) | Nausea | 7.07 | 7 | 1.0% | NA | 0.422 | No | Fixed | 0.865 | [0.553, 1.353] | 0.64 | 0.524 | No | No |
| Vomiting | 12.26 | 7 | 42.9% | NA | 0.092 | No | Fixed | 0.422 | [0.254, 0.701] | 3.33 | 0.001 | Yes | ||
| PONV | 14.36 | 4 | 72.1% | 1.5879 | 0.006 | Yes | Random | 0.854 | [0.225, 3.244] | 0.23 | 0.817 | No | ||
| Pruritus | 20.79 | 4 | 80.8% | 5.5890 | 0.000 | Yes | Random | 0.445 | [0.042, 4.749] | 0.67 | 0.502 | No | ||
| Dizziness | 0.67 | 1 | 0.0% | NA | 0.412 | No | Fixed | 1.152 | [0.426, 3.112] | 0.28 | 0.781 | No | ||
| Heterozygote model (AG vs. AA) | Nausea | 7.44 | 7 | 5.9% | NA | 0.384 | No | Fixed | 0.956 | [0.715, 1.276] | 0.31 | 0.758 | No | No |
| Vomiting | 9.03 | 7 | 22.5% | NA | 0.251 | No | Fixed | 0.912 | [0.686, 1.213] | 0.63 | 0.528 | No | ||
| PONV | 2.50 | 4 | 0.0% | NA | 0.644 | No | Fixed | 0.954 | [0.636, 1.431] | 0.23 | 0.819 | No | ||
| Pruritus | 39.27 | 4 | 89.8% | 6.6836 | 0.000 | Yes | Random | 0.248 | [0.020, 3.040] | 1.09 | 0.276 | No | ||
| Dizziness | 1.82 | 1 | 44.9% | NA | 0.178 | No | Fixed | 1.568 | [0.762, 3.226] | 1.22 | 0.222 | No | ||
| Dominant model (AG + GG vs. AA) | Nausea | 12.63 | 8 | 36.6% | NA | 0.125 | No | Fixed | 0.833 | [0.650, 1.067] | 1.45 | 0.148 | No | No |
| Vomiting | 11.53 | 8 | 30.6% | NA | 0.173 | No | Fixed | 0.765 | [0.592, 0.987] | 2.06 | 0.040 | Yes | ||
| PONV | 4.59 | 5 | 0.0% | NA | 0.468 | No | Fixed | 0.888 | [0.632, 1.248] | 0.68 | 0.494 | No | ||
| Pruritus | 55.12 | 6 | 89.1% | 4.1175 | 0.000 | Yes | Random | 0.308 | [0.057, 1.662] | 1.37 | 0.171 | No | ||
| 2.61 | 2 | 23.3% | NA | 0.271 | No | Fixed | 1.609 | [0.966, 2.681] | 1.83 | 0.068 | No | |||
| Recessive model (GG vs. AA + AG) | Nausea | 5.09 | 7 | 0.0% | NA | 0.648 | No | Fixed | 0.857 | [0.562, 1.306] | 0.72 | 0.473 | No | No |
| Vomiting | 9.31 | 7 | 24.8% | NA | 0.231 | No | Fixed | 0.439 | [0.268, 0.717] | 3.29 | 0.001 | Yes | ||
| PONV | 15.37 | 4 | 74.0% | 1.5419 | 0.004 | Yes | Random | 0.832 | [0.226, 3.062] | 0.28 | 0.782 | No | ||
| Pruritus | 14.09 | 4 | 71.6% | 3.1823 | 0.007 | Yes | Random | 0.653 | [0.096, 4.446] | 0.44 | 0.663 | No | ||
| Dizziness | 0.18 | 1 | 0.0% | NA | 0.673 | No | Fixed | 0.905 | [0.357, 2.293] | 0.21 | 0.833 | No | ||
Figure 2.
Labbe plots, sensitivity analysis plots and contour-enhanced funnel plots of the included studies focusing on the association between OPRM1-A118G Polymorphism and postoperative nausea risks. Labbe plots in allele model (A), homozygote model (B), heterozygote model (C) and dominant model (D). Sensitivity analysis for nausea in allele model (E), homozygote model (F), heterozygote model (G), and dominant model (H). Contour-enhanced funnel plots for nausea in allele model (I), homozygote model (J), heterozygote model (K), and dominant model (L).
Figure 4.
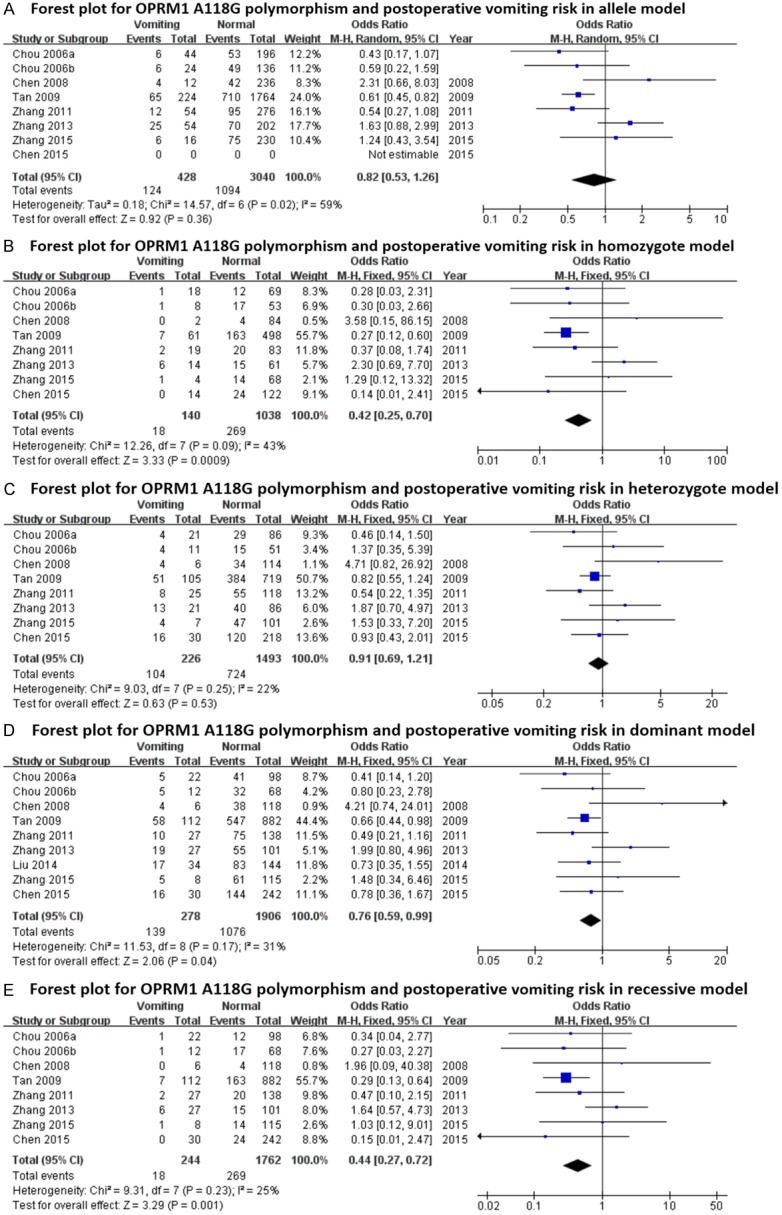
Forest plots (individual and pooled effects with 95% CI) regarding the association between OPRM1-A118G polymorphism and postoperative vomiting in allele model (A), homozygote model (B), heterozygote model (C), dominant model (D) and recessive model (E).
Figure 3.
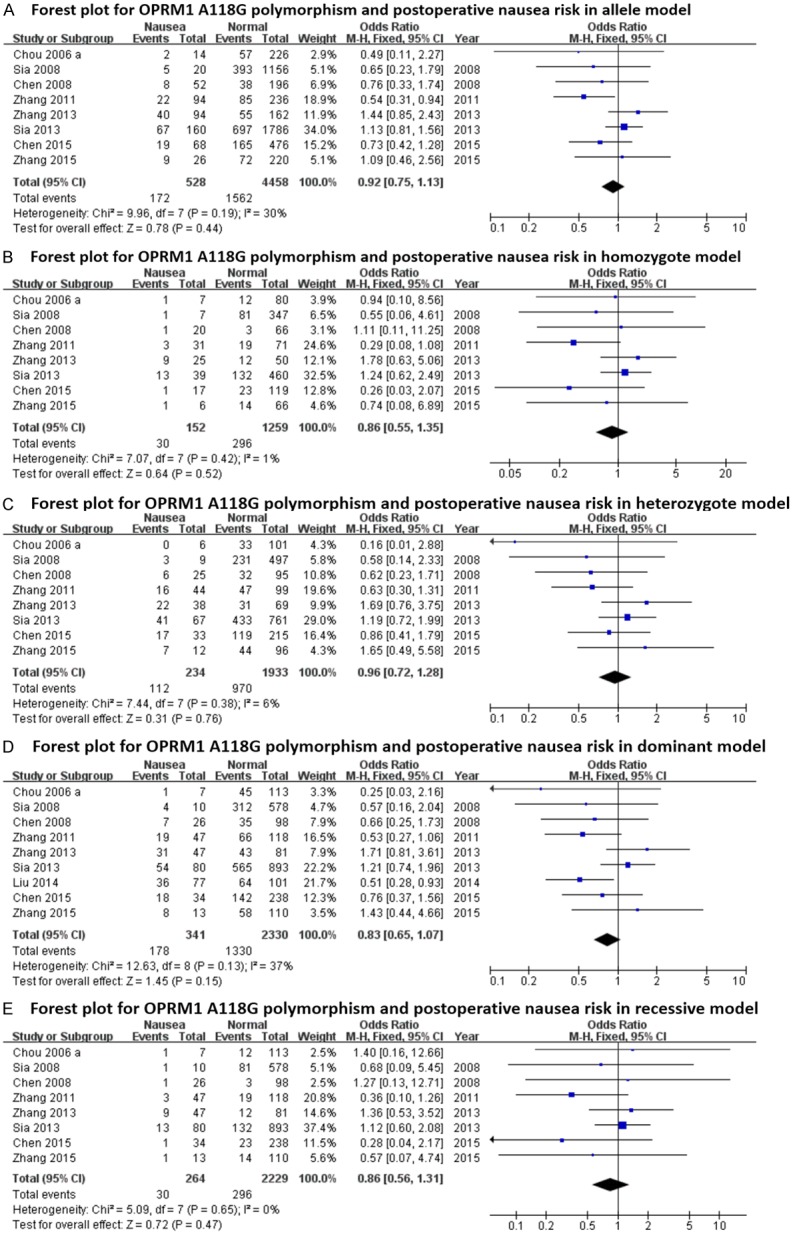
Forest plots (individual and pooled effects with 95% CI) regarding the association between OPRM1-A118G polymorphism and postoperative nausea in allele model (A), homozygote model (B), heterozygote model (C), dominant model (D) and recessive model (E).
Figure 5.
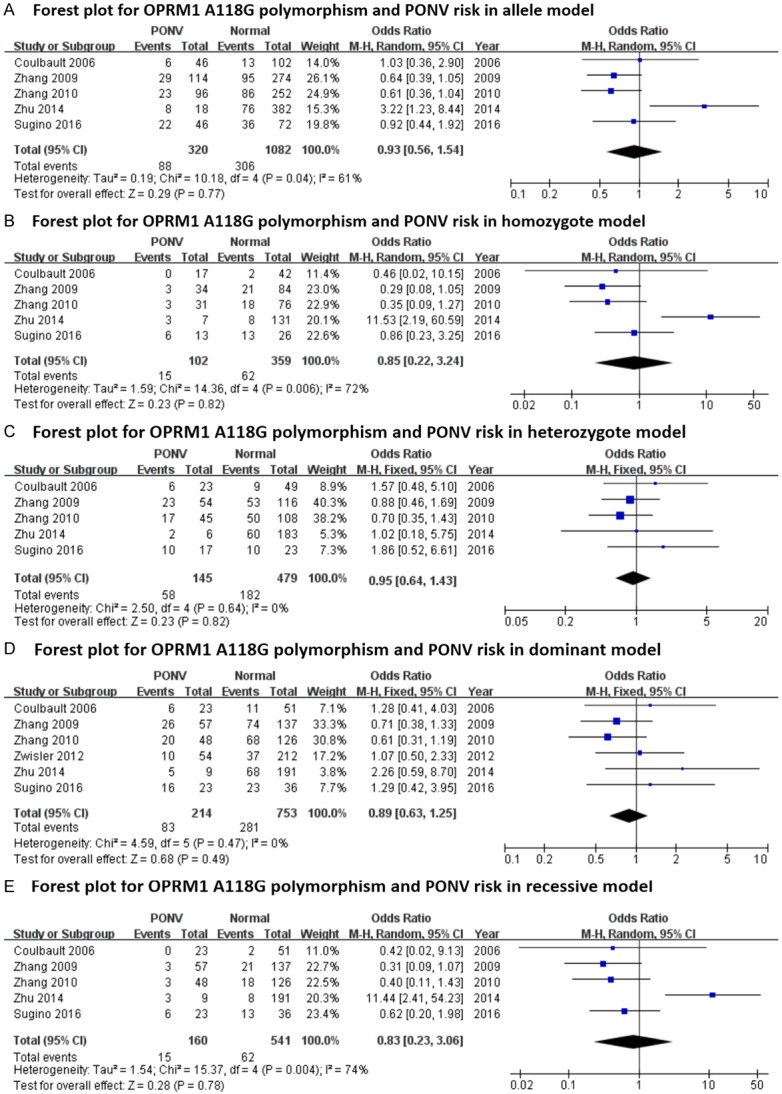
Forest plots (individual and pooled effects with 95% CI) regarding the association between OPRM1-A118G polymorphism and postoperative nausea plus vomiting (PONV) in allele model (A), homozygote model (B), heterozygote model (C), dominant model (D) and recessive model (E).
Figure 6.
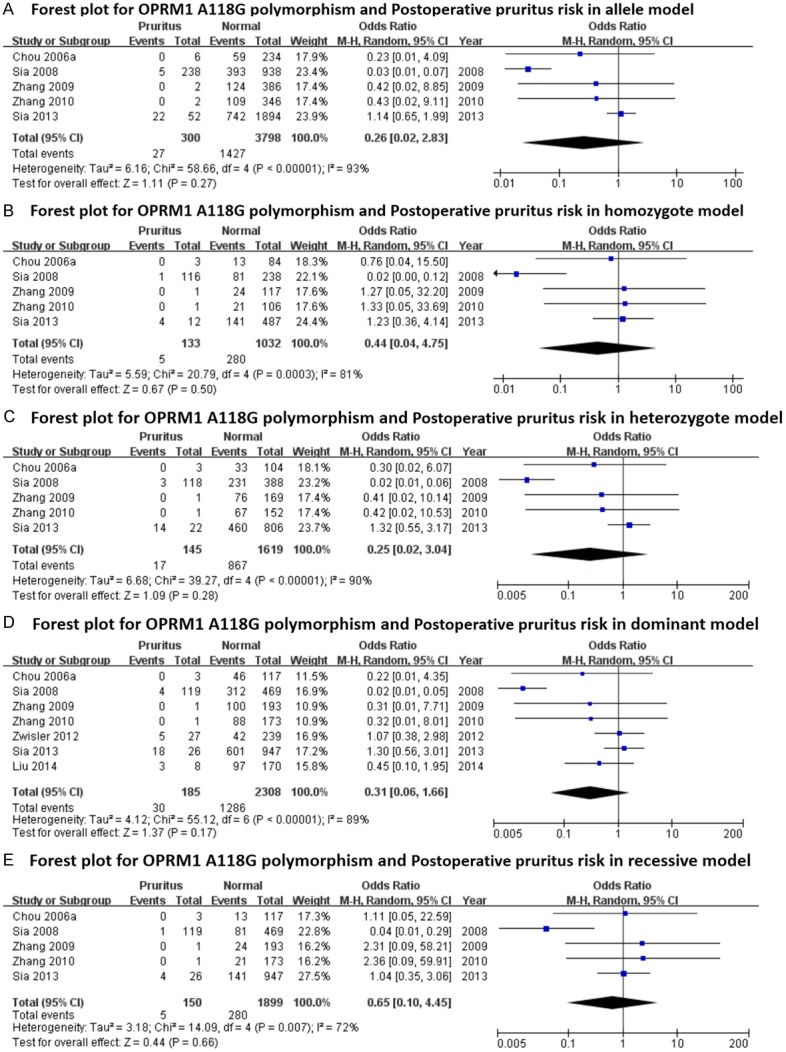
Forest plots (individual and pooled effects with 95% CI) regarding the association between OPRM1-A118G polymorphism and postoperative pruritus in allele model (A), homozygote model (B), heterozygote model (C), dominant model (D) and recessive model (E).
Figure 7.
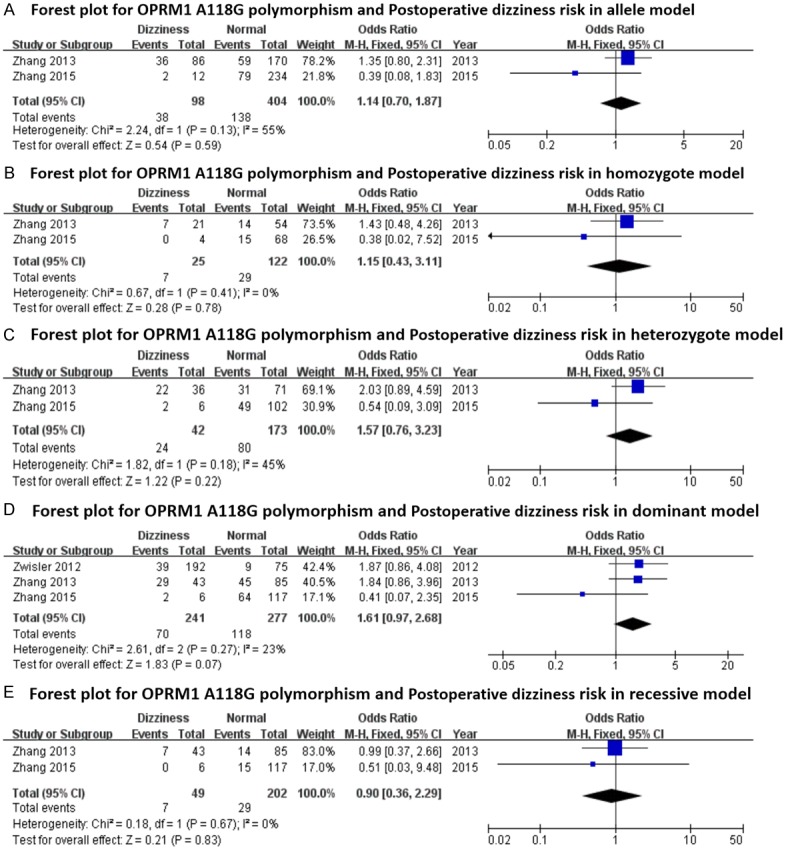
Forest plots (individual and pooled effects with 95% CI) regarding the association between OPRM1-A118G polymorphism and postoperative dizziness in allele model (A), homozygote model (B), heterozygote model (C), dominant model (D) and recessive model (E).
Sensitivity analysis and publication bias
To assess if a single study could affect the final ORs, each individual study was removed one time and the data re-pooled. The analysis results demonstrated that the pooled ORs were not affected by deleting every single study. Figure 2E-H showed Sensitivity analysis results for postoperative nausea in the allele model, homozygote model, heterozygote model and dominant model. The contour-enhanced funnel plots were adopted to estimate potential publication biases, showing that the studies had missing areas for high statistical significance (the right-hand side of the plot), indicating no publication bias in this study (Figure 2I-L for nausea in the first four models).
Discussion
The exon 1 A118G (rs1799971) is located at the coding region of OPRM1, causing an Asn40Asp amino acid substitution. OPRM1-A118G has attracted much attention recently because it is associated with many pathophysiologic process, including opioid response [30], tumorigeness, tumor progression [31-33] and evenauto-immune diseases [34]. The number of studies related to OPRM1-related polymorphisms show a general tendency to increase yearly. A timeline of the literatures is shown as Figure 8.
Figure 8.
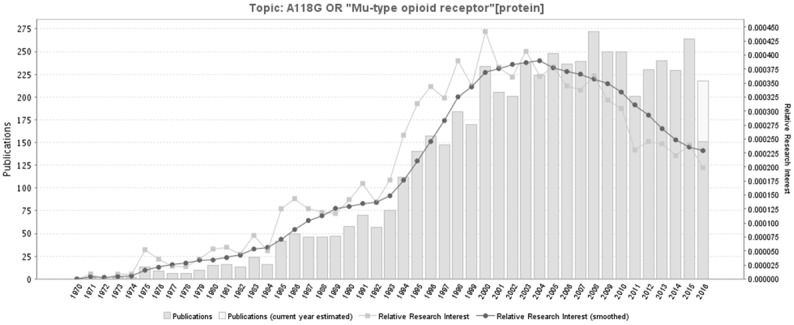
A timeline of the publications related to OPRM1-related polymorphisms. Figure 4 was generated through GoPubMed (website: http://www.gopubmed.com). GoPubMed is a knowledge-based search engine for biomedical texts. The technologies used in GoPubMed are generic and can in general be applied to any kind of texts and any kind of knowledge bases. The system was developed at the Technische Universität Dresden by Michael Schroeder and his team at Transinsight. Creation steps for this timeline: import search items to the Search Box at the home page, then click “Statistics” and download related statistical charts including the timeline and map.
Walter et al.’s review, investigating the influence of OPRM1-A118G polymorphism on pain response suggested that it was premature to integrate pharmacogenetics into the clinic with respect to pain control [35]. Hwang et al. recently in a meta-analysis suggested that The OPRM1-A118G polymorphism was associated with inter-individual variability in postoperative response to opioids [7]. In a subpopulation, identifying OPRM1-A118G polymorphism may provide valuable information regarding the individual analgesic doses that are required to achieve satisfactory pain control [7]. In the studies they reviewed plus subsequent newer studies, some authors did investigate the effects of OPRM1-A118G polymorphism on postoperative adverse reactions to anesthesia as secondary outcomes, mainly PONV. Although there were reports indicating the association between A118G and postoperative side effects, the results among different studies varied widely. Zhang et al. found that the incidence of nausea in the AA, AG and GG groups were 35.0%, 25.4% and 13.6%, respectively. The incidence of vomiting in the AA, AG and GG groups were 21.3%, 12.7% and 9.1%, respectively. There were no statistically significant differences among the genotype groups with respect to nausea or vomiting (P = 0.114 and P = 0.239, respectively) [22]. Liu in 2014 also examined the relationship between OPRM1-A118G polymorphism and incidence of postoperative nausea, vomiting, and pruritus. After Bonferroni correction, there were no significant differences in the postoperative side effects between the A/A genotype group and A/G + G/G genotype group [18].
Some possible reasons for the inconsistent results include ethnic background differences and small sample sizes. After all, a single study cannot confirm the correlation between OPRM1-A118G polymorphism and alcohol dependence risks convincingly. Meta-analysis is a statistical procedure that can create more strengthful assessments of the true effects by combining data from multiple literatures. In light of this, we combined PubMed, EMBASE, Cochrane Library, Web of Knowledge, Google Scholar and CNKI databases to analyze the associations between the risks of postoperative side effects and the OPRM1-A118G polymorphism. In our study, the statistical correlation between OPRM1-A118G polymorphism and reduced postoperative vomiting risks was detected in homozygote (OR: 0.422; 95% CI: 0.254, 0.701; P = 0.001), dominant (OR: 0.765; 95% CI: 0.592, 0.987; P = 0.040) and recessive (OR: 0.439; 95% CI: 0.268, 0.717; P = 0.001) models, but not in the allele model and heterozygote model. For other postoperative side effects, no associations were detected in our meta-analysis. Due to a limited sample and possible heterogeneity, the results should be interpreted with caution. To the best of our knowledge, this analysis is the first evaluation of the correlations between OPRM1-A118G polymorphism and postoperative adverse reactions to anesthesia including nausea, vomiting, pruritus and dizziness.
In contour-enhanced funnel plots, every single circle represents a study. Generally speaking, if studies appear to be missing in areas of low statistical significance (the left part of the plot), then it is very possible that the asymmetry is due to publication bias. Conversely, if the area where studies are perceived to be missing are areas of high statistical significance (the right part of the plot), then publication bias isn’t the cause of funnel asymmetry [36]. In the current meta-analysis, the funnel plot indicated no publication bias.
There may be limitations in our meta-analysis. Firstly, the number of literatures and the sample size for each ethnicity were somewhat small. Thus, type-II error should not be dismissed [37]. Secondly, the effects of gene-environment interactions and gene-gene interactions were not emphasized because not all studies provided this information, or even if they provided, adjusted factors were reported differently among different literatures. Thirdly, more accurate ORs should be adjusted by patient factors such as gender, age, living styles, race, medication consumption and other exposure factors. Fourth, only published articles were included, the unpublished and ongoing studies could convert our result.
Conclusions
In conclusion, our results suggest that Opioid Receptor mu 1 (OPRM1) A118G Polymorphism (rs1799971) may be associated with postoperative vomiting, but not with nausea, pruritus or dizziness. Well-designed studies with large-size sample and more ethnic groups are necessary in the future to validate the risks demonstrated in this present meta-analysis.
Acknowledgements
We would like to thank our colleagues at the Department of Anesthesia, Critical Care and Pain Medicine, Massachusetts General Hospital, Harvard Medical School, Harvard University, 55 Fruit Street, Boston, Massachusetts, 02114-3117, USA. This study was supported by the grants from Beijing Municipal Science and Technology Project (No. Z151100003915109), Capital Public Health Education, Beijing Science and Technology Program (No. Z171100000417028), and Chinese Academy of Medical Sciences Initiative for Innovative Medicine (No. 2017-I2M-3-020). The funders had no role in study design, data collection and analysis, decision to publish, or preparation of the manuscript.
Disclosure of conflict of interest
None.
References
- 1.Apfel CC, Laara E, Koivuranta M, Greim CA, Roewer N. A simplified risk score for predicting postoperative nausea and vomiting: conclusions from cross-validations between two centers. Anesthesiology. 1999;91:693–700. doi: 10.1097/00000542-199909000-00022. [DOI] [PubMed] [Google Scholar]
- 2.Watcha MF, White PF. Postoperative nausea and vomiting. Its etiology, treatment, and prevention. Anesthesiology. 1992;77:162–84. doi: 10.1097/00000542-199207000-00023. [DOI] [PubMed] [Google Scholar]
- 3.Habib AS, Chen YT, Taguchi A, Hu XH, Gan TJ. Postoperative nausea and vomiting following inpatient surgeries in a teaching hospital: a retrospective database analysis. Curr Med Res Opin. 2006;22:1093–9. doi: 10.1185/030079906X104830. [DOI] [PubMed] [Google Scholar]
- 4.Carroll NV, Miederhoff PA, Cox FM, Hirsch JD. Costs incurred by outpatient surgical centers in managing postoperative nausea and vomiting. J Clin Anesth. 1994;6:364–9. doi: 10.1016/s0952-8180(05)80004-2. [DOI] [PubMed] [Google Scholar]
- 5.Gan TJ, Diemunsch P, Habib AS, Kovac A, Kranke P, Meyer TA, Watcha M, Chung F, Angus S, Apfel CC, Bergese SD, Candiotti KA, Chan MT, Davis PJ, Hooper VD, Lagoo-Deenadayalan S, Myles P, Nezat G, Philip BK, Tramèr MR Society for Ambulatory Anesthesia. Consensus guidelines for the management of postoperative nausea and vomiting. Anesth Analg. 2014;118:85–113. doi: 10.1213/ANE.0000000000000002. [DOI] [PubMed] [Google Scholar]
- 6.Chandrakantan A, Glass PS. Multimodal therapies for postoperative nausea and vomiting, and pain. Br J Anaesth. 2011;107(Suppl 1):i27–40. doi: 10.1093/bja/aer358. [DOI] [PubMed] [Google Scholar]
- 7.Hwang IC, Park JY, Myung SK, Ahn HY, Fukuda K, Liao Q. OPRM1 A118G gene variant and postoperative opioid requirement: a systematic review and meta-analysis. Anesthesiology. 2014;121:825–34. doi: 10.1097/ALN.0000000000000405. [DOI] [PubMed] [Google Scholar]
- 8.Bartosova O, Polanecky O, Perlik F, Adamek S, Slanar O. OPRM1 and ABCB1 polymorphisms and their effect on postoperative pain relief with piritramide. Physiol Res. 2015;64(Suppl 4):S521–7. doi: 10.33549/physiolres.933210. [DOI] [PubMed] [Google Scholar]
- 9.Tan EC, Lim EC, Teo YY, Lim Y, Law HY, Sia AT. Ethnicity and OPRM variant independently predict pain perception and patient-controlled analgesia usage for post-operative pain. Mol Pain. 2009;5:32. doi: 10.1186/1744-8069-5-32. [DOI] [PMC free article] [PubMed] [Google Scholar]
- 10.Sia AT, Lim Y, Lim EC, Ocampo CE, Lim WY, Cheong P, Tan EC. Influence of mu-opioid receptor variant on morphine use and self-rated pain following abdominal hysterectomy. J Pain. 2013;14:1045–52. doi: 10.1016/j.jpain.2013.03.008. [DOI] [PubMed] [Google Scholar]
- 11.Copas J, Shi JQ. Meta-analysis, funnel plots and sensitivity analysis. Biostatistics. 2000;1:247–62. doi: 10.1093/biostatistics/1.3.247. [DOI] [PubMed] [Google Scholar]
- 12.Moher D, Liberati A, Tetzlaff J, Altman DG PRISMA Group. Preferred reporting items for systematic reviews and meta-analyses: the PRISMA statement. Ann Intern Med. 2009;151:264–9. W64. doi: 10.7326/0003-4819-151-4-200908180-00135. [DOI] [PubMed] [Google Scholar]
- 13.Higgins JP, Thompson SG. Quantifying heterogeneity in a meta-analysis. Stat Med. 2002;21:1539–58. doi: 10.1002/sim.1186. [DOI] [PubMed] [Google Scholar]
- 14.DerSimonian R, Laird N. Meta-analysis in clinical trials revisited. Contemp Clin Trials. 2015;45:139–45. doi: 10.1016/j.cct.2015.09.002. [DOI] [PMC free article] [PubMed] [Google Scholar]
- 15.Chou WY, Wang CH, Liu PH, Liu CC, Tseng CC, Jawan B. Human opioid receptor A118G polymorphism affects intravenous patient-controlled analgesia morphine consumption after total abdominal hysterectomy. Anesthesiology. 2006;105:334–7. doi: 10.1097/00000542-200608000-00016. [DOI] [PubMed] [Google Scholar]
- 16.Chou WY, Yang LC, Lu HF, Ko JY, Wang CH, Lin SH, Lee TH, Concejero A, Hsu CJ. Association of mu-opioid receptor gene polymorphism (A118G) with variations in morphine consumption for analgesia after total knee arthroplasty. Acta Anaesthesiol Scand. 2006;50:787–92. doi: 10.1111/j.1399-6576.2006.01058.x. [DOI] [PubMed] [Google Scholar]
- 17.Coulbault L, Beaussier M, Verstuyft C, Weickmans H, Dubert L, Tregouet D, Descot C, Parc Y, Lienhart A, Jaillon P, Becquemont L. Environmental and genetic factors associated with morphine response in the postoperative period. Clin Pharmacol Ther. 2006;79:316–24. doi: 10.1016/j.clpt.2006.01.007. [DOI] [PubMed] [Google Scholar]
- 18.Liu J, Hu D, Jiang Y, Xi H, Li W. Association between single nucleotide polymorphisms in the OPRM1 gene and intraoperative remifentanil consumption in northern Chinese women. Pharmacology. 2014;94:273–9. doi: 10.1159/000368082. [DOI] [PubMed] [Google Scholar]
- 19.Sia AT, Lim Y, Lim EC, Goh RW, Law HY, Landau R, Teo YY, Tan EC. A118G single nucleotide polymorphism of human mu-opioid receptor gene influences pain perception and patientcontrolled intravenous morphine consumption after intrathecal morphine for postcesarean analgesia. Anesthesiology. 2008;109:520–6. doi: 10.1097/ALN.0b013e318182af21. [DOI] [PubMed] [Google Scholar]
- 20.Sugino S, Hayase T, Higuchi M, Saito K, Moriya H, Kumeta Y, Kurosawa N, Namiki A, Janicki PK. Association of mu-opioid receptor gene (OPRM1) haplotypes with postoperative nausea and vomiting. Exp Brain Res. 2014;232:2627–35. doi: 10.1007/s00221-014-3987-9. [DOI] [PubMed] [Google Scholar]
- 21.Zhang F, Liao Q, Li L, Wang SY, Hu R, Tang YZ, Ouyang W. The correlation between post-operative fentanyl requirements and mu-opioid receptor gene A118G polymorphism in patients undergoing radical gastrectomy. Exp Ther Med. 2013;5:1147–52. doi: 10.3892/etm.2013.955. [DOI] [PMC free article] [PubMed] [Google Scholar]
- 22.Zhang W, Chang YZ, Kan QC, Zhang LR, Lu H, Chu QJ, Wang ZY, Li ZS, Zhang J. Association of human micro-opioid receptor gene polymorphism A118G with fentanyl analgesia consumption in Chinese gynaecological patients. Anaesthesia. 2010;65:130–5. doi: 10.1111/j.1365-2044.2009.06193.x. [DOI] [PubMed] [Google Scholar]
- 23.Zhang W, Yuan JJ, Kan QC, Zhang LR, Chang YZ, Wang ZY. Study of the OPRM1 A118G genetic polymorphism associated with postoperative nausea and vomiting induced by fentanyl intravenous analgesia. Minerva Anestesiol. 2011;77:33–9. [PubMed] [Google Scholar]
- 24.Zwisler ST, Enggaard TP, Mikkelsen S, Verstuyft C, Becquemont L, Sindrup SH, Brosen K. Lack of association of OPRM1 and ABCB1 singlenucleotide polymorphisms to oxycodone response in postoperative pain. J Clin Pharmacol. 2012;52:234–42. doi: 10.1177/0091270010397729. [DOI] [PubMed] [Google Scholar]
- 25.Chen J. Association of μ-opioid receptor gene polymorphism (A118G) with variations in sufentanil consumption for analgesia after abdominal surgery. Master Dissertation. 2008 [Google Scholar]
- 26.Chen Q. Association of OPRM1 A118G gene polymorphisms with sufentanil analgesic effect. Master Dissertation. 2015 [Google Scholar]
- 27.Zhu GF, Shangguan WN, Zhang GJ. Association between OPRM1 gene polymorphisms and effect of sufentanil in postoperative patient-controlled analgesia. Zhejiang Medical Journal. 2014;36:1997–9. [Google Scholar]
- 28.Zhang W. Association of OPRM1 A118G and CYP3A gene polymorphisms with fentanyl analgesic effect. Doctoral Dissertation. 2009 [Google Scholar]
- 29.Zhang Q, Wang SX, Huang GC, Fu HJ, Chen LB. The effect of OPRM1 gene polymorphism on analgesic potency of transdermal fentanyl. Oncology Progress. 2015;13:614–7. [Google Scholar]
- 30.Mura E, Govoni S, Racchi M, Carossa V, Ranzani GN, Allegri M, van Schaik RH. Consequences of the 118A > G polymorphism in the OPRM1 gene: translation from bench to bedside? J Pain Res. 2013;6:331–53. doi: 10.2147/JPR.S42040. [DOI] [PMC free article] [PubMed] [Google Scholar]
- 31.Cieslinska A, Sienkiewicz-Szlapka E, Kostyra E, Fiedorowicz E, Snarska J, Wronski K, Tenderenda M, Jarmolowska B, Matysiewicz M. mu-Opioid receptor gene (OPRM1) polymorphism in patients with breast cancer. Tumour Biol. 2015;36:4655–60. doi: 10.1007/s13277-015-3113-z. [DOI] [PMC free article] [PubMed] [Google Scholar]
- 32.De Gregori M, Diatchenko L, Belfer I, Allegri M. OPRM1 receptor as new biomarker to help the prediction of post mastectomy pain and recurrence in breast cancer. Minerva Anestesiol. 2015;81:894–900. [PubMed] [Google Scholar]
- 33.Yao P, Ding YY, Wang ZB, Ma JM, Hong T, Pan SN. Effect of gene polymorphism of COMT and OPRM1 on the preoperative pain sensitivity in patients with cancer. Int J Clin Exp Med. 2015;8:10036–9. [PMC free article] [PubMed] [Google Scholar]
- 34.Roy S, Charboneau RG, Barke RA, Loh HH. Role of mu-opioid receptor in immune function. Adv Exp Med Biol. 2001;493:117–26. doi: 10.1007/0-306-47611-8_14. [DOI] [PubMed] [Google Scholar]
- 35.Walter C, Lotsch J. Meta-analysis of the relevance of the OPRM1 118A > G genetic variant for pain treatment. Pain. 2009;146:270–5. doi: 10.1016/j.pain.2009.07.013. [DOI] [PubMed] [Google Scholar]
- 36.Peters JL, Sutton AJ, Jones DR, Abrams KR, Rushton L. Contour-enhanced meta-analysis funnel plots help distinguish publication bias from other causes of asymmetry. J Clin Epidemiol. 2008;61:991–6. doi: 10.1016/j.jclinepi.2007.11.010. [DOI] [PubMed] [Google Scholar]
- 37.Resch KL, Ernst E. The ethical type II error. Lancet. 1996;347:62–3. doi: 10.1016/s0140-6736(96)91598-6. [DOI] [PubMed] [Google Scholar]


