

Abstract
Renal cell carcinoma (RCC) is the most common renal carcinoma in the human kidney. To date, to the best of our knowledge, there are no biomarkers for the early monitoring and diagnosis of RCC patients. The present study aimed to develop deeper insight into the molecular mechanisms of microRNAs (miRNAs/miRs) in the regulation of RCC development and to reveal candidate miRNA biomarkers in human RCC. A meta-analysis was used to integrate the published and independent RCC miRNA expression profiling investigations that compared the miRNA expression profiles in RCC samples with control samples. The meta-signature miRNA target genes were then predicted in TargetScan. The predicted targets were further analyzed using Gene Ontology and pathway enrichment analysis with the Database for Annotation, Visualization and Integrated Discovery online tool, and then the transcription factors of meta-signature miRNA target genes were identified in Tfacts. A total of 7 publicly available and independent RCC miRNA expression profiling datasets were collected, and 2 upregulated (hsa-miR-155-5p and hsa-miR-210-5p) and 6 downregulated (hsa-miR-138-5p, hsa-miR-141-5p, hsa-miR-200c-5p, hsa-miR-362-5p, hsa-miR-363-5p and hsa-miR-429) meta-signature miRNAs in renal carcinoma were identified. The targeted gene enrichment analysis indicated that the meta-signature miRNAs may influence several pathways that participate in cancerogenesis, including the ‘rap1 signaling pathway’, ‘renal cell carcinoma’ and ‘microRNAs in cancer’. Overall, the present meta-analysis identified 2 upregulated and 6 downregulated meta-signature miRNAs from 7 renal carcinoma datasets, the dysregulated miRNAs that may contribute to kidney carcinoma development. This research may reveal candidate miRNA biomarkers in human RCC.
Keywords: renal cell carcinoma, microRNAs, meta-analysis, pathway, transcription factor
Introduction
Renal cell carcinoma (RCC) is the most common urological cancer, representing ~90% of adult human kidney cancer cases (1). RCC accounts for just under 3% of all adult neoplasms. The incidence of RCC has increased progressively in the last few decades. Even though the mortality rate of RCC is sustained at a high level, it is a remediable disease when metastasis does not occur. Clinically, it has been shown that RCC is commonly resistant to chemotherapy and radiation therapy, and that tumor resection remains the only definitive treatment for curative therapy (2). Nearly 55% of patients with RCC survive following curative nephrectomy. However, 20–40% of RCC patients develop postoperative metastasis (3). Thus far, no early diagnostic biomarkers for RCC have been identified, resulting in the late detection of the disease and a poor therapeutic effect. Therefore, the identification of RCC biomarkers that can improve the early diagnosis and prognosis of RCC patients is an important focus of cancer therapy.
miRNAs are ~22-nucleotide, single-stranded, small non-coding RNAs with expression at the post-transcriptional level in diverse biological processes (4). The differences in the miRNA expression profiles between RCC and normal tissues show that miRNAs participate in the cancer genesis of kidney carcinoma, suggesting roles as cancer suppressors and oncogenes (5–7). Thus, miRNAs may be able to function as prognostic and diagnostic biomarkers in RCC. Previous studies have researched the role of miRNAs in RCC using miRNA expression profiling and revealed that the miRNAs provided a novel post-transcriptional mechanism for controlling the expression of specific pathways and genes associated with RCC (8–10). Revealing the biological functions of miRNAs and their roles in kidney tumorigenesis may improve the early detection and effective treatment of RCC.
Recently, mechanism-based and integrative profiling research has revealed the functions of miRNAs in RCC. To a certain extent, this research is beneficial to improve our understanding of the molecular mechanisms of kidney cancer genesis. Previous studies have reported the miRNA expression profiling and functions in RCC, such as for miR-133b (9), miR-135a (9), miR-205 (10), miR-372 (11), miR-204 (12) and miR-1258 (13). However, due to the difference in sequencing platforms, sample selection and filter conditions, the miRNA expression profiling displays inconsistent results between different studies (5,6,8).
Thus, to minimize the limitations found in these studies, a meta-analysis was performed in the present study using the robust rank aggregation method (14), followed by the target prediction of identified meta-signature miRNAs and pathway enrichment analysis, to identify miRNA dysregulation in RCC and the pathways that may be controlled by these miRNAs. The transcription factors of meta-signature miRNA target genes were then identified. The present meta-analysis is important for developing deeper insight into miRNAs in the regulation of RCC development.
Materials and methods
Selection of studies and datasets
RCC miRNA expression profiling studies were found via PubMed (www.ncbi.nlm.nih.gov/pubmed) using the search terms ‘microRNAs,’ ‘miRNAs,’ ‘renal cell carcinoma’ and their combinations. The last search was performed on March 2017. Article titles and abstracts were screened. The full texts of articles were evaluated. Articles that were original experimental studies, were published in English and analyzed the miRNA expression profiling between human RCC samples and control samples were included. Studies were excluded if they met the following selection criteria: i) Non-English studies; ii) studies using only cell lines; iii) studies of individual preselected candidate miRNAs or genes; iv) case reports and review articles; and v) studies that did not include non-cancerous control samples. Lists of statistically significantly upregulated and downregulated miRNAs were extracted from the publications. A total of 7 publicly available and independent miRNA datasets of RCC were included in this analysis. The occurrence of upregulated and downregulated miRNAs was recorded, respectively. Differentially expressed miRNAs were required to be present in at least 4 databases as a filtering condition. All miRNA names were standardized on the basis of miRBase version 21 (http://www.mirbase.org/).
Meta-analysis
The ranked lists of gene sets for each analysis obtained from the 7 datasets were integrated for analysis. Based on statistical test P-values performed with independent Student's t-tests using SPSS 19.0 (IBM Corp., Armonk, NY, USA), where P<0.05 was considered significant, the lists of extracted miRNAs were prioritized by fold-change values. The robust rank aggregation method was used to ensure that the extracted miRNAs could be ranked reliably (14).
Prediction of meta-signature miRNA target genes
The nucleotide sequences of meta-signature miRNAs were retrieved using miRBase version 21 (http://www.mirbase.org/) (15) and organized into FASTA files. The genes targeted by these miRNAs were then predicted using TargetScan (16). Other parameters were default parameters.
Pathway enrichment analysis
To predict the potential functions of target genes, Gene Ontology (GO) analysis (www.geneontology.org/) was performed (17). The Kyoto Encyclopedia of Genes and Genomes (KEGG) was used to identify molecular functions (18). Using the Database for Annotation, Visualization and Integrated Discovery (DAVID) online tool, GO and KEGG pathway enrichment analyses were performed for the differentially expressed miRNA target genes (19). The filtering criterion was P<0.05.
Transcription factor analysis of meta-signature miRNA target genes
The transcription factor analysis of upregulated and downregulated miRNA target genes was performed in Tfacts (http://www.tfacts.org/). The indices, including P-value, q-value, E-value and false discovery rate were used to select reliable transcription factors. The quantitative values of all the indices should be <0.05.
Results
Study selection
According to the selection criteria, 7 publicly available and independent RCC miRNA expression profiling datasets were collected in this analysis. The research strategy in this study is shown in Fig. 1. These datasets were performed with different populations and platforms. The main characteristics of these studies and the acronyms by which the studies are made reference to are presented in Table I. The 7 datasets were as follows: i) MR (20); ii) XW (21); iii) SO (22); iv) CN (23); v) HH (13); vi) LW (24); and vii) FG (25). The 2 earliest studies were published in 2007 and 2008, respectively, while the remaining 5 were published between 2010 and 2012. Using the Scalable Vector Graphics module of Perl (https://metacpan.org/pod/SVG) to analyze the distribution of differentially expressed miRNAs, it was found that the differentially expressed miRNAs were markedly different between these 7 datasets (Fig. 2).
Figure 1.
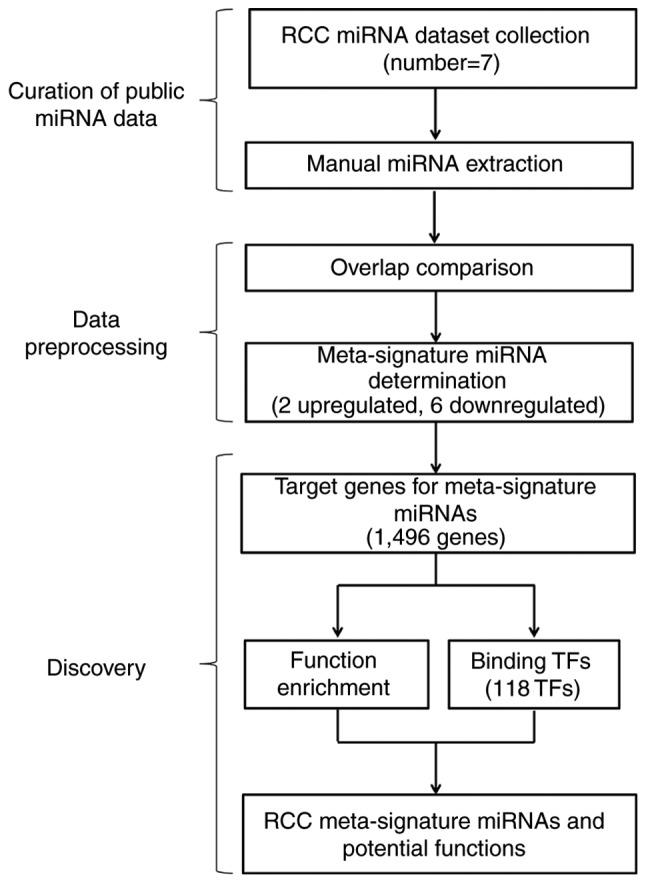
Research strategy. A total of 7 RCC miRNA expression profiling datasets were used according to the selection criteria. A meta-analysis approach was used to identify 2 upregulated and 6 downregulated meta-signature miRNAs. Target genes for meta-signature miRNAs were predicted. The functions of predicted targets were analyzed and then transcription factors of these predicted target were identified. RCC, renal cell carcinoma; miRNA, microRNA; TF, transcription factor.
Table I.
Characteristics of analyzed datasets.
| Dataset first author | Acronym | Samples | Assay/sequencing type | method | (Refs.) |
|---|---|---|---|---|---|
| Redova et al | MR | Blood serum of 15 RCC patients and 12 matched healthy controls | TaqMan Low Density Arrays | RT-qPCR | (20) |
| Wu et al | XW | A set of benign kidney specimens (n=10) and a 28-sample ccRCC training cohort, including localized (pT1; n=13) and metastatic (M1; n=15) tumor samples | Agilenta Human miRNA Microarray V2 | RT-PCR | (21) |
| Osanto et al | SO | 11 fresh frozen ccRCC and adjacent non-tumoral renal cortex pairs | Small RNA sequencing | Stem-loop PCR | (22) |
| Nakada et al | CN | 26 individuals, representing 16 CCCs, 4 ChCCs and 6 normal kidneys | Agilenta G4470A Human miRNA Microarray | RT-qPCR | (23) |
| Hidaka et al | HH | 10 cancer tissues and 5 adjacent non-cancerous tissues | TaqMan LDA Human MicroRNA Panel v2.0 | RT-qPCR | (13) |
| Weng et al | LW | Paired frozen and FFPE benign kidney (n=3 each) and ccRCC (n=3) specimens | Small RNA sequencing and MicroRNA Human Version 2 Microarray | RT-PCR | (24) |
| Gottardo et al | FG | 27 kidney specimens (20 carcinomas, 4 benign renal tumors and 3 normal parenchyma) | MicroRNA oligonucleotide microchips | – | (25) |
Agilent Technologies GmbH, Waldbronn, Germany. CCC, clear cell carcinomas; ChCC, chromophobe renal cell carcinomas; ccRCC, clear cell renal cell carcinoma; FFPE, formalin-fixed paraffin-embedded; RT-qPCR, reverse transcription-quantitative polymerase chain reaction.
Figure 2.

Distribution of differentially expressed miRNAs in RCC, as reported in selected datasets. A total of 172 differentially expressed miRNAs were found in 7 miRNA expression profiling datasets. Blue and red vertical bars indicate downregulated and upregulated miRNAs, respectively. The differentially expressed miRNAs show marked differences between these 7 datasets. The positions of RCC meta-signature miRNAs are shown. RCC, renal cell carcinoma; miR/miRNA, microRNA.
A total of 172 differentially expressed miRNAs were revealed in the 7 miRNA expression profiling datasets. However, the differentially expressed miRNA number for each dataset was clearly different (Figs. 2 and 3). Although differences existed between each miRNA dataset, the final lists of the deregulated miRNAs corresponded. In total, 3 miRNA expression profiling datasets included >50 differentially expressed miRNAs. The LW, SO and XW datasets included 73, 72 and 56 differentially expressed miRNAs, respectively. The XW and SO datasets contained the most upregulated differentially expressed miRNAs, with 29 found. The LW dataset contained 27 upregulated miRNAs, while the HH dataset did not contain any. The LW and SO datasets included 46 and 43 downregulated miRNAs, respectively. However, the FG dataset did not include any downregulated miRNAs.
Figure 3.
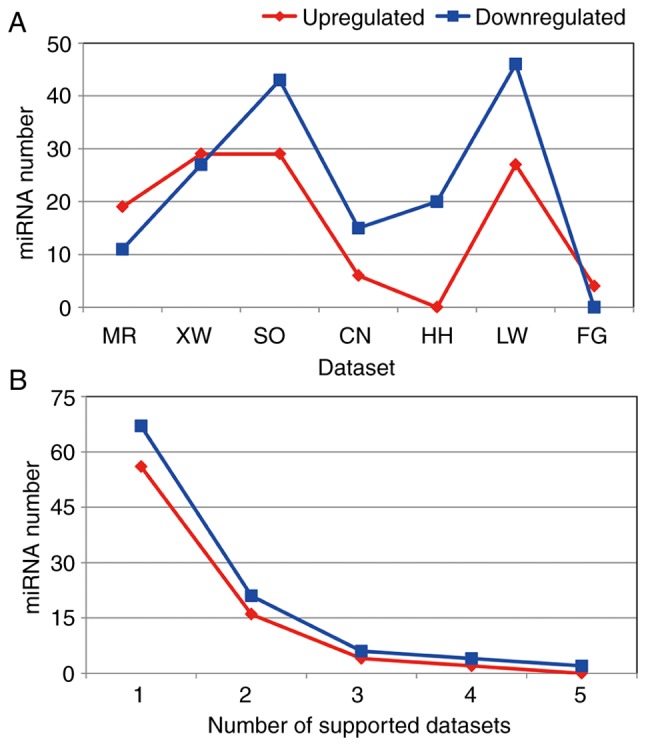
Number of differentially expressed miRNAs in the datasets and the number of supported datasets for differentially expressed miRNAs. (A) The number of upregulated and downregulated miRNAs of RCC in 7 independent datasets. Blue and red lines indicate downregulated and upregulated miRNAs, respectively. (B) The number of supported datasets for upregulated and downregulated miRNAs of RCC. Each differentially expressed miRNA was included in 1–5 datasets. RCC, renal cell carcinoma; miR/miRNA, microRNA.
RCC miRNA meta-signature
Using robust rank aggregation, a total of 8 significant meta-signature miRNAs were determined, including 2 upregulated and 6 downregulated miRNAs, from 7 RCC datasets according to the permutation P-value (Fig. 2). All of the 8 meta-signature miRNAs that attained statistical significance following Bonferroni's correction were present in at least 4 datasets. The upregulated miRNAs were hsa-miR-155-5p and hsa-miR-210-5p. The downregulated miRNAs were hsa-miR-138-5p, hsa-miR-141-5p, hsa-miR-200c-5p, hsa-miR-362-5p, hsa-miR-363-5p and hsa-miR-429.
The detailed location information of the 8 meta-signature miRNAs was extracted from the miRBase database (Table II). The meta-signature miRNA host genes were decentralized at different chromosomal locations, with the exception of the hsa-miR-141-5p and hsa-miR-200c-5p genes, and the hsa-miR-362-5p and hsa-miR-363-5p genes, which were located on chr12 and chrX, respectively. hsa-miR-429, hsa-miR-210-5p, hsa-miR-138-5p and hsa-miR-155-5p were included in chr1, chr11, chr16 and chr21, respectively.
Table II.
Renal cell carcinoma meta-signature miRNAs.
| miRNA | Chromosome | Beginning | End | Strand | Support datasets | Sequence |
|---|---|---|---|---|---|---|
| Upregulated | ||||||
| hsa-miR-155-5p | chr21 | 25573983 | 25574005 | + | 4 | UUAAUGCUAAUCGUGAUAGGGGU |
| hsa-miR-210-5p | chr11 | 568150 | 568171 | – | 4 | AGCCCCUGCCCACCGCACACUG |
| Downregulated | ||||||
| hsa-miR-138-5p | chr16 | 56858527 | 56858549 | + | 4 | AGCUGGUGUUGUGAAUCAGGCCG |
| hsa-miR-141-5p | chr12 | 6964113 | 6964134 | + | 5 | CAUCUUCCAGUACAGUGUUGGA |
| hsa-miR-200c-5p | chr12 | 6963703 | 6963724 | + | 5 | CGUCUUACCCAGCAGUGUUUGG |
| hsa-miR-362-5p | chrX | 50008968 | 50008991 | + | 4 | AAUCCUUGGAACCUAGGUGUGAGU |
| hsa-miR-363-5p | chrX | 134169425 | 134169446 | – | 4 | CGGGUGGAUCACGAUGCAAUUU |
| hsa-miR-429 | chr1 | 1169055 | 1169076 | + | 4 | UAAUACUGUCUGGUAAAACCGU |
miR/miRNA, microRNA.
Target prediction for meta-signature miRNAs
TargetScan was used to gain predicted target genes for the 8 meta-signature miRNAs. A total of 185 target genes were obtained for hsa-miR-362-5p and >200 target genes for the other 7 meta-signature miRNAs.
Functional and pathway enrichment analysis
The functions of the target genes were analyzed using the DAVID online tool, GO analysis and KEGG pathway enrichment analyses. The enriched GO functions for the target genes are presented in Fig. 4A and Table III. The predicted targets of upregulated miRNAs were found to be significantly over-represented in terms of the ‘transcriptional process’, ‘cell proliferation’ and ‘differentiation’. However, the downregulated miRNAs target genes were mainly relevant to the ‘transcriptional process’, ‘cellular immunity’, ‘neuronal differentiation’ and apoptosis. The enriched KEGG outputs for several miRNA target sets mainly showed associations with ‘cellular immunity’ (T cell receptor signaling pathway, B cell receptor signaling pathway and Rap1 signaling pathway), ‘neuronal development’ (serotonergic synapse and Axon guidance), ‘cell mobility’ (regulation of actin cytoskeleton) and ‘cancer’ (renal cell carcinoma and microRNAs in cancer). The target gene of hsa-miR-141-5p was not shown since it lacked KEGG enrichment outputs.
Figure 4.

GO processes and pathways most strongly enriched by meta-signature miRNA targets. (A) GO analyses for meta-signature miRNA targets. (B) Pathway analyses for meta-signature miRNA targets in the Kyoto Encyclopedia of Genes and Genomes database. GO, Gene Ontology; miR/miRNA, microRNA.
Table III.
KEGG terms for the GO/KEGG terms of meta-signature miRNAs.
| Meta miRNA | Category | Term | Count | % | P-value | List total | Pop hits | Pop total | Fold enrichment | FDR |
|---|---|---|---|---|---|---|---|---|---|---|
| hsa-miR-138-5p | KEGG_PATHWAY | hsa03013:RNA transport | 7 | 0.022856 | 7.15×10⁻³ | 70 | 172 | 6910 | 4.02 | 8.04 |
| hsa-miR-138-5p | KEGG_PATHWAY | hsa03018:RNA degradation | 4 | 0.013061 | 4.13×10⁻² | 70 | 77 | 6910 | 5.13 | 38.86 |
| hsa-miR-155-5p | KEGG_PATHWAY | hsa04660:T cell receptor signaling pathway | 9 | 0.028164 | 2.90×10⁻⁵ | 84 | 103 | 6910 | 7.19 | 0.04 |
| hsa-miR-155-5p | KEGG_PATHWAY | hsa04380:Osteoclast differentiation | 9 | 0.028164 | 1.61×10⁻⁴ | 84 | 131 | 6910 | 5.65 | 0.20 |
| hsa-miR-155-5p | KEGG_PATHWAY | hsa04662:B cell receptor signaling pathway | 7 | 0.021905 | 1.64×10⁻⁴ | 84 | 69 | 6910 | 8.35 | 0.20 |
| hsa-miR-155-5p | KEGG_PATHWAY | hsa04917:Prolactin signaling pathway | 7 | 0.021905 | 1.92×10⁻⁴ | 84 | 71 | 6910 | 8.11 | 0.24 |
| hsa-miR-155-5p | KEGG_PATHWAY | hsa05221:Acute myeloid leukemia | 6 | 0.018776 | 5.23×10⁻⁴ | 84 | 56 | 6910 | 8.81 | 0.64 |
| hsa-miR-200c-5p | KEGG_PATHWAY | hsa05034:Alcoholism | 6 | 0.02374 | 7.99×10⁻³ | 50 | 177 | 6910 | 4.68 | 8.86 |
| hsa-miR-200c-5p | KEGG_PATHWAY | hsa04726:Serotonergic synapse | 4 | 0.015827 | 4.36×10⁻² | 50 | 111 | 6910 | 4.98 | 40.28 |
| hsa-miR-210-5p | KEGG_PATHWAY | hsa05014:Amyotrophic lateral sclerosis (ALS) | 4 | 0.016675 | 8.32×10⁻³ | 59 | 50 | 6910 | 9.37 | 9.32 |
| hsa-miR-362-5p | KEGG_PATHWAY | hsa04810:Regulation of actin cytoskeleton | 8 | 0.026455 | 3.78×10⁻³ | 67 | 211 | 6910 | 3.91 | 4.48 |
| hsa-miR-362-5p | KEGG_PATHWAY | hsa04360:Axon guidance | 6 | 0.019841 | 7.08×10⁻³ | 67 | 127 | 6910 | 4.87 | 8.22 |
| hsa-miR-362-5p | KEGG_PATHWAY | hsa04911:Insulin secretion | 5 | 0.016534 | 8.62×10⁻³ | 67 | 85 | 6910 | 6.07 | 9.92 |
| hsa-miR-362-5p | KEGG_PATHWAY | hsa04012:ErbB signaling pathway | 5 | 0.016534 | 9.34×10⁻³ | 67 | 87 | 6910 | 5.93 | 10.71 |
| hsa-miR-362-5p | KEGG_PATHWAY | hsa04022:cGMP-PKG signaling pathway | 6 | 0.019841 | 2.07×10⁻² | 67 | 166 | 6910 | 3.73 | 22.35 |
| hsa-miR-363-5p | KEGG_PATHWAY | hsa05034:Alcoholism | 6 | 0.024136 | 1.71×10⁻² | 60 | 177 | 6910 | 3.90 | 17.62 |
| hsa-miR-429 | KEGG_PATHWAY | hsa05211:Renal cell carcinoma | 5 | 0.015331 | 2.64×10⁻³ | 63 | 65 | 6910 | 8.44 | 3.09 |
| hsa-miR-429 | KEGG_PATHWAY | hsa04015:Rap1 signaling pathway | 7 | 0.021463 | 1.09×10⁻² | 63 | 210 | 6910 | 3.66 | 12.22 |
| hsa-miR-429 | KEGG_PATHWAY | hsa05206:MicroRNAs in cancer | 8 | 0.024529 | 1.33×10⁻² | 63 | 285 | 6910 | 3.08 | 14.67 |
| hsa-miR-429 | KEGG_PATHWAY | hsa04722:Neurotrophin signaling pathway | 5 | 0.015331 | 2.23×10⁻² | 63 | 120 | 6910 | 4.57 | 23.41 |
| hsa-miR-429 | KEGG_PATHWAY | hsa04611:Platelet activation | 5 | 0.015331 | 2.88×10⁻² | 63 | 130 | 6910 | 4.22 | 29.28 |
miR/miRNA, microRNA; KEGG, Kyoto Encyclopedia of Genes and Genomes; GO, Gene Ontology; FDR, false discovery rate.
Transcription factor analysis of meta-signature miRNA target genes
There were 106 interactions between 59 transcription factors and 41 target genes for upregulated miRNAs, and 326 interactions between 104 transcription factors and 117 target genes for downregulated miRNAs. In total, 45 transcription factors were common to the upregulated and downregulated miRNAs target genes in 118 transcriptional factors (Fig. 5A). The anharmonic ratio of mainly transcription factors for target genes is shown in Fig. 5B (E-value, <0.05). Transcription factor MYC had the highest anharmonic ratio and reached 32%.
Figure 5.
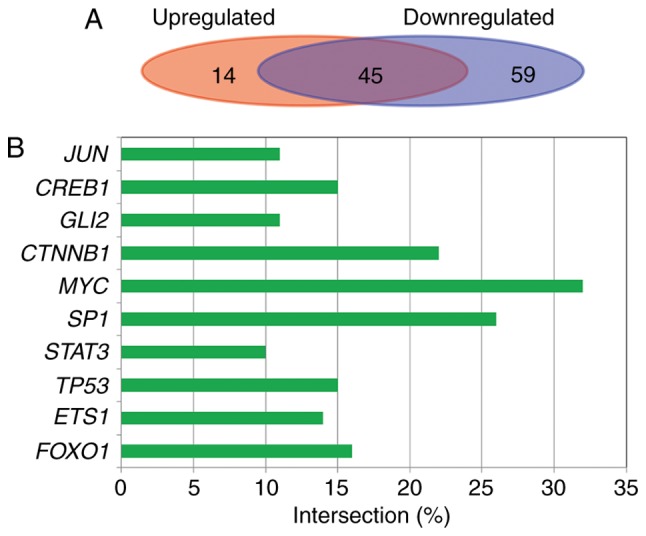
Transcription factor analysis of meta-signature miRNAs target genes. (A) The number of common and specific transcription factors of upregulated and downregulated miRNA target genes. (B) The anharmonic ratio of mainly transcription factors for target genes. miRNA, microRNA.
Discussion
Numerous previous studies have reported associations between miRNA expression and RCC. A number of these studies showed that the differentially expressed miRNAs determined by the different studies did not observe a consistent result in disease samples compared with control samples. Differences among technological platforms, sample size and etiological factors attributed to the lack of uniformity (26). It is better to analyze individual datasets and then analyze the resulting miRNA lists aggregately to overcome these limitations. Therefore, such a comprehensive evaluation of miRNA expression profiles was performed in kidney cancer for the present study. An integrated analysis was performed to identify differentially expressed miRNAs in 7 different profiling datasets for RCC. Only the datasets that were generated from miRNA microarrays or sequencing and further validated by reverse transcription-quantitative polymerase chain reaction (RT-qPCR) or RT-PCR were selected in this study. Using the robust rank aggregation method, 2 upregulated and 6 downregulated meta-signature miRNAs were determined in at least 4 studies. The location of the 8 meta-signature miRNAs on the chromosomes and their nucleotide sequences are shown in Table II. The majority of them have previously been determined as tumor suppressors and oncogenes via oncogenic pathways and are known to be functionally important in kidney carcinogenesis (27). Therefore, the present results may highlight the potential of miRNA to improve clinical prediction for RCC patients.
Numerous previous studies have suggested that a number of miRNAs serve noticeable roles in kidney cancer development. For example, Chen et al (10) showed that miRNA-205 may be a candidate RCC suppressor through targeting zinc finger E-box-binding homeobox 2 (ZEB2). hsa-miR-155-5p and hsa-miR-210-5p were reported to be upregulated in the RCC samples (22), which was also observed in the present study. By contrast, hsa-miR-138-5p and hsa-miR-141-5p were identified for the first time in the present study. miR-205 was markedly upregulated in the non-tumor tissues compared with that in the RCC samples and cell lines. Overexpression of miR-205 suppressed ACHN cell proliferation, migration and invasion, and induced cell apoptosis (10). A study conducted by Zhou et al (9) reported that miRNA-133b and miRNA-135a suppressed cell proliferation and induced apoptosis through the tyrosine-protein kinase JAK2/signal transducer and activator of transcription 3 signaling pathway in RCC. Huang et al (11) demonstrated that miRNA-372 was upregulated in control normal samples compared with that in RCC tissues and cell lines. miRNA-372 overexpression inhibited proliferation and invasion via targeting insulin-like growth factor 2 in RCC cell lines (11). It is noteworthy that the majority of RCC meta-signature miRNAs in the present study have also been demonstrated to serve functionally important roles in kidney cancer genesis. In addition, the targeted gene enrichment analysis suggested effects on several pathways that participate in cancerogenesis, including the rap1 signaling pathway, renal cell carcinoma and microRNAs in cancer (Fig. 4). The majority of the 8 meta-signature miRNAs in the present study were identified to be associated with RCC development. Therefore, these miRNAs may be potential candidates for the development of early detection and diagnosis methods for RCC. The meta-analysis showed that high levels of miR-155-5p and miR-210-5p were associated with RCC. Gao et al (28) reported that miR-155 overexpression decreased transcription factor E2F2 (E2F2) expression, while inhibition elevated E2F2 expression in RCC cell lines, and that miR-155 may function as a cancer-promoting miRNA through targeting E2F2. Nakada et al (29) suggested that the upregulation of miR-210 was associated with hypoxia-inducible factor 1α accumulation in response to hypoxic conditions in renal cancer (30). miR-210 was also associated with a number of biological processes, including mitochondrial metabolism, angiogenesis, cell cycle regulation and apoptosis (30). Furthermore, miR-141-5p, miR-200c-5p and miR-429 are members of the miR-200 family (31). Previous studies have reported that ZEB2, which is a transcriptional repressor for CDH1/E-cadherin, is a hypothetical target of miR-200c and miR-141 in a variety of cancer types (31). miR-141 and miR-200c overexpression decreased ZEB2 expression and increased E-cadherin expression in lung cancer cells and renal carcinoma cell lines (32,33). A study conducted by Liang et al (34) showed that miR-138 was able to induce SN-12 cell senescence by increasing the expression of tumor protein p16 and targeting histone-lysine N-methyltransferase EZH2 (34). In addition, miR-429 was demonstrated to inhibit cell proliferation, migration and invasion of RCC through targeting transcription factor Sp1 (35). miR-363-3p transfection caused a decrease in cyclic AMP-responsive element-binding protein 1 (CREB1) expression and suppressed cell proliferation, migration and apoptosis reduction in human RCC through targeting CREB1 (36).
To the best of our knowledge, only a few meta-analyses of miRNA profiling investigations have been performed specifically for RCC. Tang and Xu (37) identified a statistically significant miRNA meta-signature of two upregulated (hsa-miR-21 and hsa-miR-210) and three downregulated (hsa-miR-141, hsa-miR-200c and hsa-miR-429) miRNAs in patients with RCC. The serum levels of hsa-miR-193a-3p, hsa-miR-362 and hsa-miR-572 in patients with RCC were significantly increased, whereas the levels of hsa-miR-28-5p and hsa-miR-378 were markedly decreased (8). In addition, White et al (6) reported that hsa-miR-122, hsa-miR-155 and hsa-miR-210 had the highest overexpression, and hsa-miR-200c, hsa-miR-335 and hsa-miR-218 had the most downregulation in patients with RCC. In present study, a meta-analysis approach was used to integrate multitudinous and independent miRNA expression profiling datasets for RCC. A meta-signature, composed of 8 differentially expressed miRNAs, including 2 upregulated miRNAs, hsa-miR-155-5p and hsa-miR-210-5p, and 6 downregulated miRNAs, hsa-miR-138-5p, hsa-miR-141-5p, hsa-miR-200c-5p, hsa-miR-362-5p, hsa-miR-363-5p and hsa-miR-429, from 7 different and independent datasets was determined. The subsequent target prediction of meta-signature miRNAs and pathway enrichment analysis identified genes and pathways that may be regulated by these meta-signature miRNAs. Furthermore, the transcription factors of the meta-signature miRNA target genes were identified. One potential limitation of the current study is that the miRNA dataset from blood serum samples was not included, which may have different miRNA expression compared with that of the tumor tissues. The present analysis may be useful in the research into predictive markers for the early detection of RCC and assist in obtaining a promising treatment in anticancer therapy. However, further in vivo validation studies will be required.
Acknowledgements
Not applicable.
Funding
This study was supported by a grant from the Project of Clinical Research Funds of Zhejiang Medical Association (no. 2011ZYC-A62).
Availability of data and materials
The datasets used an/or analyzed during the current study are available from the corresponding author on reasonable request.
Authors' contributions
GY, RW and FW conceived and designed this study. GY, RW, MX, XF, QEH and CZ performed the experiments. GY, RW and FW wrote the manuscript.
Ethics approval and consent to participate
Not applicable.
Patient consent for publication
Not applicable.
Competing interests
The authors declare that they have no competing interests.
References
- 1.Siegel R, Naishadham D, Jemal A. Cancer statistics, 2012. CA Cancer J Clin. 2012;62:10–29. doi: 10.3322/caac.20138. [DOI] [PubMed] [Google Scholar]
- 2.Banumathy G, Cairns P. Signaling pathways in renal cell carcinoma. Cancer Biol Ther. 2010;10:658–664. doi: 10.4161/cbt.10.7.13247. [DOI] [PMC free article] [PubMed] [Google Scholar]
- 3.Pantuck AJ, Zisman A, Belldegrun AS. The changing natural history of renal cell carcinoma. J Urol. 2001;166:1611–1623. doi: 10.1016/S0022-5347(05)65640-6. [DOI] [PubMed] [Google Scholar]
- 4.Bartel D. MicroRNAs: Target recognition and regulatory functions. Cell. 2009;136:215–233. doi: 10.1016/j.cell.2009.01.002. [DOI] [PMC free article] [PubMed] [Google Scholar]
- 5.Yi Z, Fu Y, Zhao S, Zhang X, Ma C. Differential expression of miRNA patterns in renal cell carcinoma and nontumorous tissues. J Cancer Res Clin Oncol. 2010;136:855–862. doi: 10.1007/s00432-009-0726-x. [DOI] [PubMed] [Google Scholar]
- 6.White NM, Bao TT, Grigull J, Youssef YM, Girgis A, Diamandis M, Fatoohi E, Metias M, Honey RJ, Stewart R, et al. miRNA profiling for clear cell renal cell carcinoma: Biomarker discovery and identification of potential controls and consequences of miRNA dysregulation. J Urol. 2011;186:1077–1083. doi: 10.1016/j.juro.2011.04.110. [DOI] [PubMed] [Google Scholar]
- 7.Meng X, Chen X, Chen D, Bing Y, Huang Z. FoxO1: A novel insight into its molecular mechanisms in the regulation of skeletal muscle differentiation and fiber type specification. Oncotarget. 2017;8:10662–10674. doi: 10.18632/oncotarget.12891. [DOI] [PMC free article] [PubMed] [Google Scholar]
- 8.Wang C, Hu J, Lu M, Gu H, Zhou X, Chen X, Zen K, Zhang CY, Zhang T, Ge J, et al. A panel of five serum miRNAs as a potential diagnostic tool for early-stage renal cell carcinoma. Sci Rep. 2015;5:7610. doi: 10.1038/srep07610. [DOI] [PMC free article] [PubMed] [Google Scholar]
- 9.Zhou W, Bi X, Gao G, Sun L. miRNA-133b and miRNA-135a induce apoptosis via the JAK2/STAT3 signaling pathway in human renal carcinoma cells. Biomed Pharmacother. 2016;84:722–729. doi: 10.1016/j.biopha.2016.09.074. [DOI] [PubMed] [Google Scholar]
- 10.Chen Z, Tang ZY, He Y, Liu LF, Li DJ, Chen X. miRNA-205 is a candidate tumor suppressor that targets ZEB2 in renal cell carcinoma. Oncol Res Treat. 2014;37:658. doi: 10.1159/000368792. [DOI] [PubMed] [Google Scholar]
- 11.Huang X, Huang M, Kong L, Li Y. miR-372 suppresses tumour proliferation and invasion by targeting IGF2BP1 in renal cell carcinoma. Cell Prolif. 2015;48:593–599. doi: 10.1111/cpr.12207. [DOI] [PMC free article] [PubMed] [Google Scholar]
- 12.Xiong F, Liu K, Zhang F, Sha K, Wang X, Guo X, Huang N. miR-204 inhibits the proliferation and invasion of renal cell carcinoma by inhibiting RAB22A expression. Oncol Rep. 2016;35:3000–3008. doi: 10.3892/or.2016.4624. [DOI] [PubMed] [Google Scholar]
- 13.Hidaka H, Seki N, Yoshino H, Yamasaki T, Yamada Y, Nohata N, Fuse M, Nakagawa M, Enokida H. Tumor suppressive microRNA-1285 regulates novel molecular targets: Aberrant expression and functional significance in renal cell carcinoma. Oncotarget. 2012;3:44–57. doi: 10.18632/oncotarget.417. [DOI] [PMC free article] [PubMed] [Google Scholar]
- 14.Kolde R, Laur S, Adler P, Vilo J. Robust rank aggregation for gene list integration and meta-analysis. Bioinformatics. 2012;28:573–580. doi: 10.1093/bioinformatics/btr709. [DOI] [PMC free article] [PubMed] [Google Scholar]
- 15.Griffiths-Jones S, Saini HK, van Dongen S, Enright AJ. miRBase: Tools for microRNA genomics. Nucleic Acids Res. 2008;36:D154–D158. doi: 10.1093/nar/gkm952. [DOI] [PMC free article] [PubMed] [Google Scholar]
- 16.Lewis BP, Burge CB, Bartel DP. Conserved seed pairing, often flanked by adenosines, indicates that thousands of human genes are MicroRNA targets. Cell. 2005;120:15–20. doi: 10.1016/j.cell.2004.12.035. [DOI] [PubMed] [Google Scholar]
- 17.Tweedie S, Ashburner M, Falls K, Leyland P, McQuilton P, Marygold S, Millburn G, Osumi-Sutherland D, Schroeder A, Seal R, Zhang H. FlyBase Consortium: FlyBase: Enhancing Drosophila gene ontology annotations. Nucleic Acids Res. 2009;37:D555–D559. doi: 10.1093/nar/gkn788. [DOI] [PMC free article] [PubMed] [Google Scholar]
- 18.Rédei GP. Kyoto Encyclopedia of Genes and Genomes. John Wiley and Sons, Inc.; Hoboken, NJ: 2012. [Google Scholar]
- 19.Huang DW, Sherman BT, Lempicki RA. Systematic and integrative analysis of large gene lists using DAVID bioinformatics resources. Nat Protoc. 2009;4:44–57. doi: 10.1038/nprot.2008.211. [DOI] [PubMed] [Google Scholar]
- 20.Redova M, Poprach A, Nekvindova J, Iliev R, Radova L, Lakomy R, Svoboda M, Vyzula R, Slaby O. Circulating miR-378 and miR-451 in serum are potential biomarkers for renal cell carcinoma. J Transl Med. 2012;10:55. doi: 10.1186/1479-5876-10-55. [DOI] [PMC free article] [PubMed] [Google Scholar]
- 21.Wu X, Weng L, Li X, Guo C, Pal SK, Jin JM, Li Y, Nelson RA, Mu B, Onami SH, et al. Identification of a 4-microRNA signature for clear cell renal cell carcinoma metastasis and prognosis. PLoS One. 2012;7:e35661. doi: 10.1371/journal.pone.0035661. [DOI] [PMC free article] [PubMed] [Google Scholar]
- 22.Osanto S, Qin Y, Buermans HP, Berkers J, Lerut E, Goeman JJ, van Poppel H. Genome-wide microRNA expression analysis of clear cell renal cell carcinoma by next generation deep sequencing. PLoS One. 2012;7:e38298. doi: 10.1371/journal.pone.0038298. [DOI] [PMC free article] [PubMed] [Google Scholar]
- 23.Nakada C, Matsuura K, Tsukamoto Y, Tanigawa M, Yoshimoto T, Narimatsu T, Nguyen LT, Hijiya N, Uchida T, Sato F, et al. Genome-wide microRNA expression profiling in renal cell carcinoma: significant down-regulation of miR-141 and miR-200c. J Pathol. 2008;216:418–427. doi: 10.1002/path.2437. [DOI] [PubMed] [Google Scholar]
- 24.Weng L, Wu X, Gao H, Mu B, Li X, Wang JH, Guo C, Jin JM, Chen Z, Covarrubias M, et al. MicroRNA profiling of clear cell renal cell carcinoma by whole-genome small RNA deep sequencing of paired frozen and formalin-fixed, paraffin-embedded tissue specimens. J Pathol. 2010;222:41–51. doi: 10.1002/path.2736. [DOI] [PubMed] [Google Scholar]
- 25.Gottardo F, Liu CG, Ferracin M, Calin GA, Fassan M, Bassi P, Sevignani C, Byrne D, Negrini M, Pagano F, et al. Micro-RNA profiling in kidney and bladder cancers. Urol Oncol. 2007;25:387–392. doi: 10.1016/j.urolonc.2007.01.019. [DOI] [PubMed] [Google Scholar]
- 26.Diaz G, Melis M, Tice A, Kleiner DE, Mishra L, Zamboni F, Farci P. Identification of microRNAs specifically expressed in hepatitis C virus-associated hepatocellular carcinoma. Int J Cancer. 2013;133:816–824. doi: 10.1002/ijc.28075. [DOI] [PMC free article] [PubMed] [Google Scholar]
- 27.Ortholan C, Puissegur MP, Ilie M, Barbry P, Mari B, Hofman P. MicroRNAs and lung cancer: New oncogenes and tumor suppressors, new prognostic factors and potential therapeutic targets. Curr Med Chem. 2009;16:1047–1061. doi: 10.2174/092986709787581833. [DOI] [PubMed] [Google Scholar]
- 28.Gao Y, Ma X, Yao Y, Li H, Fan Y, Zhang Y, Zhao C, Wang L, Ma M, Lei Z, Zhang X. miR-155 regulates the proliferation and invasion of clear cell renal cell carcinoma cells by targeting E2F2. Oncotarget. 2016;7:20324–20337. doi: 10.18632/oncotarget.7951. [DOI] [PMC free article] [PubMed] [Google Scholar]
- 29.Nakada C, Tsukamoto Y, Matsuura K, Nguyen TL, Hijiya N, Uchida T, Sato F, Mimata H, Seto M, Moriyama M. Overexpression of miR-210, a downstream target of HIF1α, causes centrosome amplification in renal carcinoma cells. J Pathol. 2011;224:280–288. doi: 10.1002/path.2860. [DOI] [PubMed] [Google Scholar]
- 30.Liu TY, Zhang H, Du SM, Li J, Wen XH. Expression of microRNA-210 in tissue and serum of renal carcinoma patients and its effect on renal carcinoma cell proliferation, apoptosis, and invasion. Genet Mol Res. 2016;15:15017746. doi: 10.4238/gmr.15017746. [DOI] [PubMed] [Google Scholar]
- 31.Song F, Yang D, Liu B, Guo Y, Zheng H, Li L, Wang T, Yu J, Zhao Y, Niu R, et al. Integrated microRNA network analyses identify a poor-prognosis subtype of gastric cancer characterized by the miR-200 family. Clin Cancer Res. 2014;20:878–889. doi: 10.1158/1078-0432.CCR-13-1844. [DOI] [PubMed] [Google Scholar]
- 32.Dhayat SA, Mardin WA, Köhler G, Bahde R, Vowinkel T, Wolters H, Senninger N, Haier J, Mees ST. The microRNA-200 family-a potential diagnostic marker in hepatocellular carcinoma? J Surg Oncol. 2014;110:430–438. doi: 10.1002/jso.23668. [DOI] [PubMed] [Google Scholar]
- 33.Hurteau GJ, Carlson JA, Spivack SD, Brock GJ. Overexpression of the microRNA hsa-miR-200c leads to reduced expression of transcription factor 8 and increased expression of E-cadherin. Cancer Res. 2007;67:7972–7976. doi: 10.1158/0008-5472.CAN-07-1058. [DOI] [PubMed] [Google Scholar]
- 34.Liang J, Zhang Y, Jiang G, Liu Z, Xiang W, Chen X, Chen Z, Zhao J. MiR-138 induces renal carcinoma cell senescence by targeting EZH2 and is downregulated in human clear cell renal cell carcinoma. Oncol Res. 2013;21:83–91. doi: 10.3727/096504013X13775486749218. [DOI] [PubMed] [Google Scholar]
- 35.Wu D, Niu X, Pan H, Zhou Y, Zhang Z, Qu P, Zhou J. Tumor-suppressing effects of microRNA-429 in human renal cell carcinoma via the downregulation of Sp1. Oncol Lett. 2016;12:2906–2911. doi: 10.3892/ol.2016.4953. [DOI] [PMC free article] [PubMed] [Google Scholar]
- 36.Li Y, Chen D, Li Y, Jin L, Liu J, Su Z, Qi Z, Shi M, Jiang Z, Ni L, et al. Oncogenic cAMP responsive element binding protein 1 is overexpressed upon loss of tumor suppressive miR-10b-5p and miR-363-3p in renal cancer. Oncol Rep. 2016;35:1967–1978. doi: 10.3892/or.2016.4579. [DOI] [PubMed] [Google Scholar]
- 37.Tang K, Xu H. Prognostic value of meta-signature miRNAs in renal cell carcinoma: An integrated miRNA expression profiling analysis. Sci Rep. 2015;5:10272. doi: 10.1038/srep10272. [DOI] [PMC free article] [PubMed] [Google Scholar]
Associated Data
This section collects any data citations, data availability statements, or supplementary materials included in this article.
Data Availability Statement
The datasets used an/or analyzed during the current study are available from the corresponding author on reasonable request.