Abstract
Ratiometric quantitation is used in mass spectrometry to account for variations in ionization efficiencies due to heterogenous sample matrixes. Isotopes are most commonly used to achieve ratiometric quantitation because of their ability to co-elute chromatographically with each other and to have similar ionization efficiencies. In the work presented here, a new non-isotopic quantitative tagging approach is presented which allows chromatographic co-elution and similar ionization efficiencies. Using two variations of maleimide tags, t-butyl and cyclohexyl maleimide, thiols are quantified with a high degree of linearity up to five-fold concentration differences. Because these two tags have similar hydrophobcities, they elute simultaneously which allows them to be used for ratiometric quantitation. Beyond the five-fold linear range, signal compression is observed. This technique was able to quantify thiol changes in both in vitro pharmacological treatments as well as in vivo diabetic tissue.
Graphical Abstract
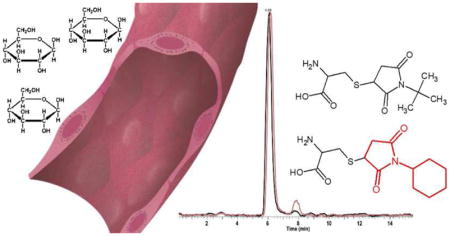
1. Introduction
Quantitation in electrospray ionization mass spectrometry (ESI-MS) is complicated by competing ionization, adduct formation and overall variability in the ESI process.[1, 2] MS most often uses stable isotope dilution or stable isotope chemical tagging to account for signal variability[3–9]. The use of stable isotopes for ratiometric quantitation is possible because the heavy and light isotopes create a mass shift detectable by the MS but do not create differential ionization.[10] For optimal benefit, the heavy isotopes need to be ionized at the same time as the light isotopes. For direct infusion, co-ionization is not an issue, but for condensed phase separations, the need for co-elution may be a complicating factor. While most stable isotopes (13C, 15N, 18O), do not affect liquid phase separations (LC), deuterium does cause a chromatographic shift under reverse phase (RP) conditions and is therefore often deemed undesirable despite its lower cost.[1, 11]
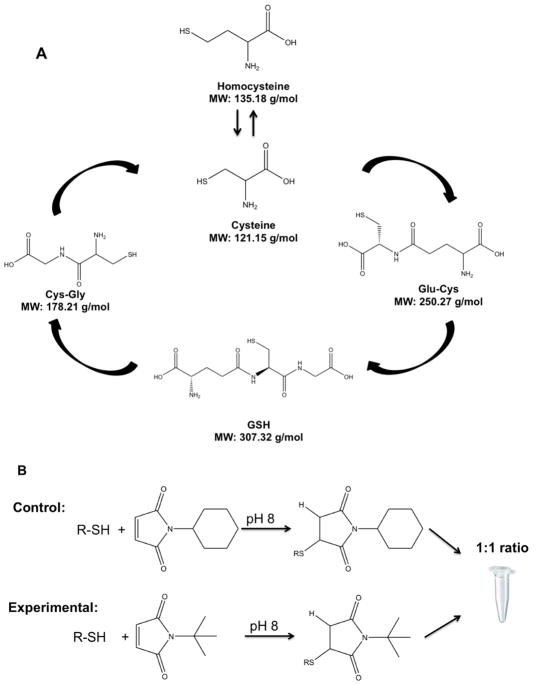
Use of stable isotopes to quantitate thiol metabolites has previously been successfully undertaken.[1, 11] Thiol metabolism is of great interest to many disease states (e.g. diabetes) given the involvement in oxidative stress.[12, 13] Glutathione (GSH) is an endogenous antioxidant thiol peptide formed through the sulfur metabolic pathway (FIGURE 1).[14, 15] The sulfur metabolic pathway involves homocysteine, cysteine, γ-glutamyl-cystine (Glu-Cys), Cysteine-glycine (Cys-Gly), and GSH.[15] Detection of this pathway has often used electrochemistry[16, 17], fluorescence[18] or MS coupled to RPLC detection[11]. For MS analysis, chemical tagging of the thiols is has been used due the ion-suppressive effects inherent in thiols. Tagging of thiols for MS detection uses either a maleimide based tag or iodoacetate group. In comparing these tags, maleimide kinetics are generally quicker (5–30 min reaction vs. 12h for iodoacetate) but less selective (primarily thiols, but crossover with primary amines).[19] Both types of tags have been used to enhance thiol MS sensitivity and as such to improve quantitation. In these previous studies, use of isotope coded affinity tagging (ICAT) was superior to direct signal intensity measurements. Despite the positive results from ICAT, reagent costs were high and less expensive reagents are desirable.[11]
Figure 1. Sulfur Metabolism and Tagging Regime.
A. Structure and molecular weight of thiols that participate in the sulfur metabolic pathway. B. Alkyl maleimides are reacted with reduced thiol in 80% acetonitrile solution with 5 mM ammonium formate at pH 8. Tagged thiols were combined at 1:1 ratio and analyzed by HILIC-MS/MS. The mass tags yield differing molecular weights but identical retention times by HILIC separation.
In the work presented here, a non-isotope encoded tagging procedure is established for ratiometric quantitation based on mass and structurally different tags rather than isotopes for thiol analysis. By using two non-isotope based maleimide tags with similar hydrophobicities but different masses, ratiometric measurements can be made. Critical to this system was the use of hydrophilic interaction LC (HILIC), which allowed for co-elution of both sets of tagged thiols.[15, 20] Using this system, differences in thiol metabolism can be seen in endothelial cells incubated with and without a pharmacological agent as well as diseased and non-diseased human tissue.
2. Materials and methods
2.1 Chemicals and Reagents
Glutathione was purchased from Alfa Aesar (Ward Hill, MA USA). Cysteine, ammonium formate, and 2,3-dimethoxy-5-methyl-1,4-benzoquinone (BQ) were obtained from Acros Organic (Geel, Belgium). Homocysteine, penicillamine, cys-gly, γ-glu-cys, N-cyclohexylmaleimide and N-tert-butylmaleimide were purchased from Sigma Aldrich (Saint Louis, MO USA). Formic acid and ammonium hydroxide were obtained from Fisher Scientific (Pittsburgh, PA USA). LC-MS grade water and acetonitrile were from Honeywell Burdick and Jackson (Muskegon, MI USA).
2.2 Reaction of thiol standards with alkyl maleimide tags
25 μm thiol standards of cysteine, homocysteine, penicillamine, cys-gly, glu-cys and glutathione, were reacted with 4 mM of two different tags, either N-cyclohexylmaleimide or N-tert-butylmaleimide and mixed in 10:1, 5:1, 2:1, 1:1, 1:2, 1:5, and 1:10 ratios. Reaction were carried out in 80:20 acetonitrile:water with 5mM ammonium formate at pH 8. pH was adjusted using 1M ammonium hydroxide. Standard thiols were reacted with both maleimide tags and found to reach a plateau in 20 minutes (Supplemental Figure S4). The reaction was allowed to proceed at room temperature for 30 minutes according to these data and in agreement with our previous protocol[21]. Thiol standards with alkyl maleimide tags mixed in different ratios were analyzed by LC-ESI-MS.
2.3 Sample Preparation
2.3.1 Cell culture conditions
Bovine aortic endothelial cells (BAEC) were purchased from Cell Applications (San Diego, CA USA) and cultured in Dulbeco’s Modified Eagle’s Medium (DMEM) with 10% fetal bovine serum (FBS). Cells grown in a 5 cm dish for two days. Cell plates separated two groups: one as control, another as experimental that was treated with 20μM 2,3-dimethoxy-5-methyl-1 4-benzoquinone (BQ) for 1 hour.
Cells were rinsed by warm PBS and quenched by 350μL of 80:20 acetonitrile: water. Cells were placed in a dry ice/ethanol bath, and then scrapped, transferred to a microfuge vial and sonicated (Misonix XL-2000, Qsonica, CT USA) with 3s pulses for 10s. After centrifuging at 14,000rpm (20× g) for 5 minutes at 4°C, supernatants were collected and 50μM penicillamine added as the internal standard. The control group reacted with 8mM N-cyclohexyl maleimide tag at 80% acetonitrile solution with 5mM ammonium formate at pH 8, and the BQ experimental group reacted with 8mM N-t-butyl maleimide tag 80% acetonitrile solution with 5mM ammonium formate at pH 8. After the reaction, cell lysates solutions were dried down by vacuum centrifuge and reconstituted in 80% ACN. The mixture was analyzed by HILIC-ESI-MS.
2.3.2. Heart tissue preparation
Fresh human muscle was obtained from human cardiac operations. During sternotomy, a small portion of the sternothyroideus muscle is divided to expose the left innominate vein. Muscle was rapidly flash frozen in liquid nitrogen at the operation location.
Samples were lyophilized in a Labconco Freezon freeze-dryer/lyophilizer (Kansas City, MO USA) for 48 hour. Samples were stored into a −80 °C freezer until future use. Tissue was pulverized in a liquid nitrogen cooled mortar, and weighed and diluted to 2 mg/mL for each tagging reaction. There were 6 muscle heart tissues from three diabetic patients and three nondiabetic patients to be utilized: HbA1c 5., HbA1c 5.2, HbA1c 5.8, HbA1c 7.2, HbA1c 7.4 and HbA1c 11(diabetic HbA1c > 6.5). Samples in 500μL 80% acetonitrile solution containing 5mM ammonium were sonicated (Misonix XL-2000, Qsonica, CT USA) and centrifuged at 14000rpm for 5 minutes at 4°C to obtain the supernatant. Each 2 mg of non-diabetic heart tissue in different HbA1c levels was reacted with N-cyclohexylmaleimide, and each 2mg of diabetic heart tissue in different HbA1c levels reacted with N-tert-butylmaleimide, and 50μM penicillamine spiked in as an internal standard. Each of the three diabetic samples were mixed with each of the non-diabetic samples to create a total of nine samples to analyze. Samples were mixed 1:1, dried and reconstituted in 80% ACN to run by LC-ESI-MS.
2.4 LC-MS Conditions
Samples were reacted with t-butyl maleimide tag and hexyl maleimide tag and mixed in different ratios. All tagged thiol samples were run on Thermo LTQ linear ion trap mass spectrometer (San Jose, CA USA) coupled with Thermo UltiMate 3000 LC system (San Jose, CA USA). Injections were made without dilution with a six port with 5μL sample loop. Positive mode ESI was used with the spray voltage at 5.8kV, sheath gas was 10 arb, and the capillary temperature was set to 275°C. The flowrate was 0.6 mL/min with mobile phases A being water containing 0.1% formic acid, and B was acetonitrile with 0.1% formic acid. The gradient was as follows: 90% solvent B at time 0 min; 5 min linear decrease to 77%B; 5:01 min to 15 min hold at 0% B; 15:01 min till 55 min increase up to 90% solvent B. Separations were performed on a Zorbax SB-CN column (Agilent, Sanat Clara, CA, USA) that was 4.6mm in diameter and 15 cm long with a particle size of 5 μm.
The MS was operated in product ion scan mode. Six sets of thiols were selected for fragmentation. Each N-t-butylmaleimide and N-cyclohexyl maleimide tagged thiol was programmed for full MS/MS analysis (Supplemental S1). Ratios were generated using the base peak of these selected ion chromatograms from each of the tagged thiols.
2.5 Data analysis
All instrument control, data acquisition, and analyses were processed using Xcalibur software (Thermo Scientific, version 2.2 SP1.48). Data were normalized to penicillamine to account for any sample preparation variation. Error bars are mean ± standard deviation.
3 Results and Discussion
3.1 Quantitation of thiol standards
This work examines the use of non-isotope coded tags to achieve ratiometric quantitation of thiols. The thiols of interest (cysteine, homocysteine, Cys-Gly, Glu-Cys and GSH) are involved the sulfur metabolic pathway (Figure 1A). Based on the reactive sulfhydryl group, two different alkyl maleimide tags are reacted with these thiols at alkaline pH. This tagging approach increases thiol ionization in part due to increasing hydrophobicity. Using similar tags with different masses, N-cyclohexylmaleimide and N-tert-butylmaleimide were used to increase hydrophobicity (Figure 1B). For example, cysteine has a log P value of 0.24, and upon tagging is increased to 0.84 for the t-butyl tag and 1.67 for the cyclo-hexyl tag. To develop the targeted control and targeted experimental method, two group thiol standards respectively reacted with different mass alkyl maleimide tags. After 30-minute reaction in 80% acetonitrile buffer solution at pH 8, two group tagging thiol standards needed to be combined with different ratios (Figure 2-1B). For ratiometric quantitation to be achieved from this tagging scheme, metabolites tagged with the cyclohexyl and t-butyl forms need to co-elute from the LC column.
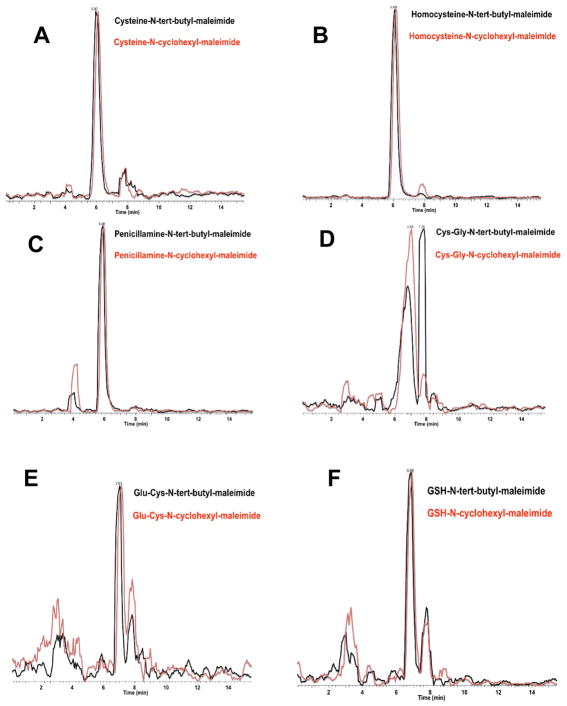
Figure 2. Chromatographic Overlap of t-Butyl and Cyclo-Hexyl Maleimide Tagged Thiol Metabolites.
Reconstructed ion chromatograms of tert-butyl and cyclohexyl maleimide after tagging with A: cysteine, B: homocysteine C: penicillamine, D: Cys-Gly, E: Glu-Cys, and F: GSH. Tagged metabolites were mixed 1:1 (25 μM each) prior to injection.
Because the different tags hold different hydrophobicities, separations based on hydrophobicity (RPLC) would not fulfill the co-elution requirement. Instead, we choose to separate thiol metabolites by HILIC which separates based on hydrophilic functional groups. Figure 2 shows the overlap between all the metabolites. All of the tagged thiols showed near exact chromatographic overlap between the cyclohexyl and t-butyl tags. One issue of concern was the peak splitting that occurred in Cys-Gly (Figure 2D). While peak splitting is not uncommon in tagged thiols run in HILIC11, this complicated the ratio metric quantitation of Cys-Gly. The first peak (7.0 min) had higher signal intensity than the second peak (7.7 min). Both chromatographic peaks were summed and recorded for use in ratiometric analyses. Using this summing method, the linearity dynamic range and linearity of the system is similar to the other five thiols.
To determine the quantitative ability of this system, the linear dynamic range was examined by changing the ratios of each pair of thiols. The signal intensities of thiol standards with t-butyl and hexyl tags in different ratios were then analyzed. Plotting concentration ratio against signal intensity ratio showed slopes between 1.07 and 1.92 (Table). The data demonstrate excellent linearity when ratios are between 1:5 and 5:1. Beyond these values, linearity begins to diminish. This is a result of signal compression which is common in isotope ratio MS analyses.[22, 23]
3.2 Thiol metabolites in mammalian cells
This method was then used to explore the pharmacological effects of 2,3-dimethoxy-5-methyl-1,4-benzoquinone (BQ) on intracellular thiols. BQ can both oxidize and scavenge reduced thiols (Supplemental S2). Both effects will ultimately decrease the levels of intracellular thiols. BQ treatment conditions were optimized to ensure cell viability.[24] Cell viability was explored to ensure that thiol differences were not due to cell death. Calcein AM was added to cells after 20 μM BQ treatment. Viable cells will convert calcein AM into the fluorescent product calcein. By comparing the control and BQ experimental cell cultures, it reported that cells were alive and viable after 20μm BQ reaction under 1 hour (Supplemental S3). This reaction condition was used for all cells subsequent experiments.
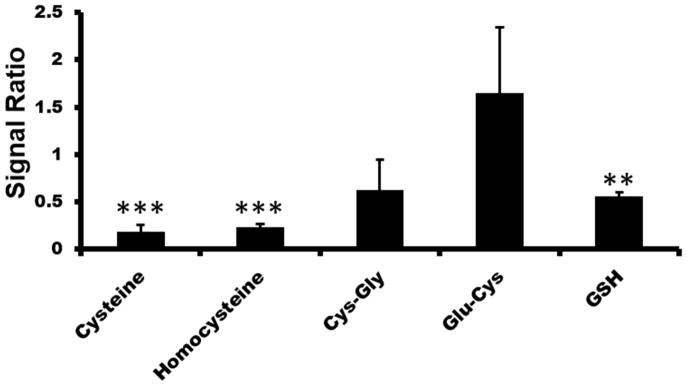
The treatment of BQ on endothelial cells was used to assess the quantitative ability of our system to evaluate pharmacological changes in thiol metabolism. Control and experimental cells were cultured on the same day from the same parent plate. Before extraction of thiols from endothelial cells, the experimental group was treated with 20μm BQ reaction for 1 hour. Both control and experimental cells groups were lysed in 80% acetonitrile with penicillamine spiked in as the internal standard. The internal standard was used to normalize for any variations sample preparation conditions such as sample loss. N-tert-butylmaleimide reacted with experimental group and N-cyclohexylmaleimide reacted with control group in 80% acetonitrile solution. After incubation, control and experimental samples were combined at a 1:1 ratio. Samples were then injected into LC/MS to reveal thiols changes from BQ treatments (Figure 3). The resulting ratios were normalized to each to the penicillamine internal standard. As expected, the reduced thiols showed a decrease under BQ treatment. This indicated that BQ either reacted specifically with the thiols, similar to acetaminophen or that thiol oxidation was induced. Except the Glu-Cys, other thiol metabolites were decreased after adding BQ. Of particular interest is that the thiols with the lowest pKas and thus the most reactive, showed the lowest decrease. This may suggests that the BQ is directly reacting with the thiols.
Figure 3. Effects of 20μm BQ treatment on thiol metabolites from endothelial cells.
Ratio of BQ treatment to control. Ratios <1 indicate decrease of thiol levels in response to BQ treatment. Ratios >1 show an increase of thiol levels in response to BQ treatment. * p<0.05; ** p<0.01; *** p<0.005
3.3 Thiol metabolites in heart tissue
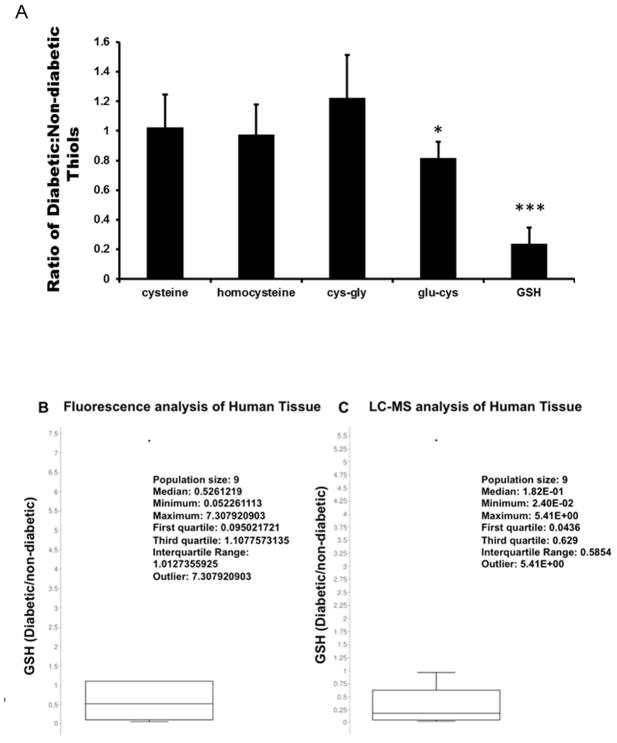
Because this method proved useful for in vitro measurements, analysis of more complex samples was undertaken. This method was applied to the investigation of thiol levels of diabetic muscle tissue from cardiovascular surgery. Previous studies have shown that in diabetes, thiols like GSH, are decreased.[25] Smooth muscle was obtained from Saint Louis University Hospital with different HbA1c levels from non-diabetic patients (HbA1c <6) and diabetic patients (HbA1c >7) who have cardiovascular diseases. There were 6 muscle heart tissues from three non diabetic patients (HbA1c 5.1, HbA1c 5.2 and HbA1c 5.8) and three diabetic patients (HbA1c 7.2, HbA1c 7.4 and HbA1c 11) to be analyzed. Each 2 mg non-diabetic tissue was reacted with N-cyclohexylmaleimide, and each diabetic tissue was reacted with N-tert-butylmaleimide. Tagging reaction was in 80% acetonitrile solution with 50μm penicillamine spiked in as the internal standard. Samples were then run by LC-MS with 1:1 t-butyl tagging thiols in diabetic tissue: hexyl tagging thiols in non diabetic tissue ratio. Signals were normalized to each thiol analyte dividing with signal of internal standard. Signals that have been normalized of t-butyl tagging thiols in diabetic tissue were then divided with the signals that have been normalized of hexyl tagging thiols in non-diabetic tissue (Figure 4A).
Figure 4. Thiol levels in Diabetic Tissue.
A. Ratio of diabetic and non-diabetic thiols. * p<0.05; ** p<0.01; *** p<0.005. B. Ratio of diabetic to non-diabetic tissue thiols using fluorescence. C. Ratio of diabetic to non-diabetic tissue GSH using MS based technique.
Figure 4A shows that GSH levels in diabetic tissue are dramatically decreased to 20% of that of non-diabetic samples. Examination of the other thiol metabolites shows no significant changes. While GSH is the most abundant thiol metabolite, its pKa/reactivity is lower than the cysteine. This calls into question the regulatory mechanism of the sulfur metabolic pathway which are worthy of future investigations.
To confirm the findings of GSH in tissue, the same samples were subjected to a thiol specific fluorescent dye (Thiostar, Arbor Assays, Ann Arbor, MI). These data are shown in Figure 4B and 4C box-whisker plot. Both data show a decrease in GSH levels, with a fluorescent median ratio of 0.52 for fluorescence and a ratio of 0.18 for the LC-MS system. While these systems both show dramatic decreases, it is important to note that the fluorescent dye is thiol specific and relies on the fact that GSH is the predominant thiol in cells/tissue. The existence of alternate thiol metabolites in the tissue (cysteine etc.) is likely a confounding factor between the two techniques. The lack of specificity of the fluorescent assay is one possibility in the differences seen here. Of interest is that both techniques showed the same outlier with similar ratios (7 and 5.4 respectively). These data taken together show similar values can be reached between our new technique and a preexisting technique.
4 Conclusion
Analogous to isotopes overlaps, using similar structures and hydrophobicities but different masses of alkyl maleimide tags can achieve relative quantitation of reduced thiol metabolites without use of isotopes. The selected thiols metabolites can be separated by HILIC and identified by different retention time and MS/MS fragmentation. By comparing the ratio of t-butyl tagging thiols and hexyl tagging thiols in different samples, pharmacological and pathological effects can be seen. This work shows proof of concept for detecting reduced thiol metabolites in cultured cells and heart tissue. While this approach investigated six select thiol metabolites, there is no reason to indicate that more thiol analytes could not be analyzed using the same system. This system was successful because the cyclo-hexyl and t-butyl tags had similar hydrophobicities and the separation system was HILIC. This gave identical retention times and different masses. This opens the possibilities of using a similar approach for tagging different functional groups with non-isotopic mass tags.
Supplementary Material
Table. Analytical Figure of Merit.
Thiols standards (25 μM) were tagged with either t-butyl maleimide or cyclohexyl maleimide and mixed at varying ratios: 10:1, 5:1, 3:1 1:1, 1:3, 1:5 and 1:10.
| Thiol | Sensitivity/Slope (5:1 -1:5 ratio) | R2 (5:1 -1:5 ratio) | Sensitivity/Slope (10:1 -1:10 ratio) | R2 (5:1 -1:5 ratio) |
|---|---|---|---|---|
| Cysteine | 1.60 | 0.999 | 1.05 | 0.915 |
| Homocysteine | 1.78 | 0.986 | 1.19 | 0.918 |
| Penicillamine | 1.92 | 0.979 | 1.35 | 0.937 |
| Cys-Gly | 1.28 | 0.958 | 1.18 | 0.985 |
| Glu-Cys | 1.25 | 0.979 | 0.88 | 0.935 |
| GSH | 1.07 | 0.985 | 0.90 | 0.983 |
Acknowledgments
This work was supported by the National Institutes of Health (1R15 GM113153 01)
Footnotes
Publisher's Disclaimer: This is a PDF file of an unedited manuscript that has been accepted for publication. As a service to our customers we are providing this early version of the manuscript. The manuscript will undergo copyediting, typesetting, and review of the resulting proof before it is published in its final citable form. Please note that during the production process errors may be discovered which could affect the content, and all legal disclaimers that apply to the journal pertain.
References
- 1.Liu P, Huang YQ, Cai WJ, Yuan BF, Feng YQ. Profiling of thiol-containing compounds by stable isotope labeling double precursor ion scan mass spectrometry. Anal Chem. 2014;86:9765–9773. doi: 10.1021/ac5023315. [DOI] [PubMed] [Google Scholar]
- 2.Milne SB, Mathews TP, Myers DS, Ivanova PT, Brown HA. Sum of the parts: mass spectrometry-based metabolomics. Biochemistry. 2013;52:3829–3840. doi: 10.1021/bi400060e. [DOI] [PMC free article] [PubMed] [Google Scholar]
- 3.Guo K, Ji C, Li L. Stable-isotope dimethylation labeling combined with LC-ESI MS for quantification of amine-containing metabolites in biological samples. Anal Chem. 2007;79:8631–8638. doi: 10.1021/ac0704356. [DOI] [PubMed] [Google Scholar]
- 4.Hao L, Johnson J, Lietz CB, Buchberger A, Frost D, Kao WJ, Li L. Mass Defect-Based N, N-Dimethyl Leucine Labels for Quantitative Proteomics and Amine Metabolomics of Pancreatic Cancer Cells. Anal Chem. 2017;89:1138–1146. doi: 10.1021/acs.analchem.6b03482. [DOI] [PMC free article] [PubMed] [Google Scholar]
- 5.Zhang J, Wang Y, Li S. Deuterium isobaric amine-reactive tags for quantitative proteomics. Anal Chem. 2010;82:7588–7595. doi: 10.1021/ac101306x. [DOI] [PubMed] [Google Scholar]
- 6.Filla LA, Yuan W, Feldman EL, Li S, Edwards JL. Global metabolomic and isobaric tagging capillary liquid chromatography-tandem mass spectrometry approaches for uncovering pathway dysfunction in diabetic mouse aorta. J Proteome Res. 2014;13:6121–6134. doi: 10.1021/pr501030e. [DOI] [PMC free article] [PubMed] [Google Scholar]
- 7.Yuan W, Anderson KW, Li S, Edwards JL. Subsecond absolute quantitation of amine metabolites using isobaric tags for discovery of pathway activation in mammalian cells. Anal Chem. 2012;84:2892–2899. doi: 10.1021/ac203453t. [DOI] [PubMed] [Google Scholar]
- 8.Yuan W, Edwards JL, Li S. Global profiling of carbonyl metabolites with a photo-cleavable isobaric labeling affinity tag. Chem Commun (Camb) 2013;49:11080–11082. doi: 10.1039/c3cc45956j. [DOI] [PubMed] [Google Scholar]
- 9.Yuan W, Li S, Edwards JL. Extraction and Quantitation of Ketones and Aldehydes from Mammalian Cells Using Fluorous Tagging and Capillary LC-MS. Anal Chem. 2015;87:7660–7666. doi: 10.1021/acs.analchem.5b01000. [DOI] [PubMed] [Google Scholar]
- 10.Kuehnbaum NL, Britz-McKibbin P. New advances in separation science for metabolomics: resolving chemical diversity in a post-genomic era. Chem Rev. 2013;113:2437–2468. doi: 10.1021/cr300484s. [DOI] [PubMed] [Google Scholar]
- 11.Yuan W, Edwards JL. Thiol metabolomics of endothelial cells using capillary liquid chromatography mass spectrometry with isotope coded affinity tags. J Chromatogr A. 2011;1218:2561–2568. doi: 10.1016/j.chroma.2011.02.063. [DOI] [PubMed] [Google Scholar]
- 12.Brownlee M. Biochemistry and molecular cell biology of diabetic complications. Nature. 2001;414:813–820. doi: 10.1038/414813a. [DOI] [PubMed] [Google Scholar]
- 13.Lui JK, Lipscombe R, Arthur PG. Detecting changes in the thiol redox state of proteins following a decrease in oxygen concentration using a dual labeling technique. J Proteome Res. 2010;9:383–392. doi: 10.1021/pr900702z. [DOI] [PubMed] [Google Scholar]
- 14.Mirzahosseini A, Somlyay M, Noszal B. Species-Specific Thiol-Disulfide Equilibrium Constant: A Tool To Characterize Redox Transitions of Biological Importance. J Phys Chem B. 2015;119:10191–10197. doi: 10.1021/acs.jpcb.5b05708. [DOI] [PubMed] [Google Scholar]
- 15.Rao Y, Xiang B, Bramanti E, D’Ulivo A, Mester Z. Determination of thiols in yeast by HPLC coupled with LTQ-orbitrap mass spectrometry after derivatization with p-(Hydroxymercuri)benzoate. J Agric Food Chem. 2010;58:1462–1468. doi: 10.1021/jf903485k. [DOI] [PubMed] [Google Scholar]
- 16.Batz NG, Martin RS. Selective detection of endogenous thiols using microchip-based flow analysis and mercury/gold amalgam microelectrodes. Analyst. 2009;134:372–379. doi: 10.1039/b813898b. [DOI] [PMC free article] [PubMed] [Google Scholar]
- 17.Kuhnline CD, Gangel MG, Hulvey MK, Martin RS. Detecting thiols in a microchip device using micromolded carbon ink electrodes modified with cobalt phthalocyanine. Analyst. 2006;131:202–207. doi: 10.1039/b511153f. [DOI] [PubMed] [Google Scholar]
- 18.Steele ML, Ooi L, Munch G. Development of a high-performance liquid chromatography method for the simultaneous quantitation of glutathione and related thiols. Anal Biochem. 2012;429:45–52. doi: 10.1016/j.ab.2012.06.023. [DOI] [PubMed] [Google Scholar]
- 19.Hansen RE, Winther JR. An introduction to methods for analyzing thiols and disulfides: Reactions, reagents, and practical considerations. Anal Biochem. 2009;394:147–158. doi: 10.1016/j.ab.2009.07.051. [DOI] [PubMed] [Google Scholar]
- 20.Garcia-Canaveras JC, Donato MT, Castell JV, Lahoz A. A comprehensive untargeted metabonomic analysis of human steatotic liver tissue by RP and HILIC chromatography coupled to mass spectrometry reveals important metabolic alterations. J Proteome Res. 2011;10:4825–4834. doi: 10.1021/pr200629p. [DOI] [PubMed] [Google Scholar]
- 21.Esch C, Hui DS, Lee R, Edwards JL. Quantitation of thiol metabolites from mammalian cells using fluorous tagging and HILIC-MS. Anal Methods-Uk. 2015;7:7164–7169. [Google Scholar]
- 22.Yuan W, Zhang J, Li S, Edwards JL. Amine metabolomics of hyperglycemic endothelial cells using capillary LC-MS with isobaric tagging. J Proteome Res. 2011;10:5242–5250. doi: 10.1021/pr200815c. [DOI] [PubMed] [Google Scholar]
- 23.Chen Z, Wang Q, Lin L, Tang Q, Edwards JL, Li S, Liu S. Comparative evaluation of two isobaric labeling tags, DiART and iTRAQ. Anal Chem. 2012;84:2908–2915. doi: 10.1021/ac203467q. [DOI] [PubMed] [Google Scholar]
- 24.Tapper MA, Sheedy BR, Hammermeister DE, Schmieder PK. Depletion of cellular protein thiols as an indicator of arylation in isolated trout hepatocytes exposed to 1, 4-benzoquinone. Toxicol Sci. 2000;55:327–334. doi: 10.1093/toxsci/55.2.327. [DOI] [PubMed] [Google Scholar]
- 25.Ansley DM, Wang B. Oxidative stress and myocardial injury in the diabetic heart. J Pathol. 2013;229:232–241. doi: 10.1002/path.4113. [DOI] [PMC free article] [PubMed] [Google Scholar]
Associated Data
This section collects any data citations, data availability statements, or supplementary materials included in this article.


