

Abstract
The first clinical application of magnetic resonance elastography (MRE) was in the evaluation of chronic liver disease (CLD) for detection and staging of liver fibrosis. In the past ten years, MRE has been incorporated seamlessly into a standard MRI liver protocol worldwide. Liver MRE is a robust technique for evaluation of liver stiffness and is currently the most accurate non-invasive imaging technology for evaluation of liver fibrosis. Newer MRE sequences including spin echo MRE and three- dimensional MRE have helped in reducing the technical limitations of clinical liver MRE that is performed with 2D GRE MRE. Advances in MRE technology has led to understanding of newer mechanical parameters such as dispersion, attenuation and viscoelasticity that may be useful in evaluating pathological processes in chronic liver disease and may prove useful in their management.
This review article will describe the changes in CLD that cause increase in stiffness followed by principle and technique of liver MRE. In the later part of the review, we will briefly discuss the advances in liver MRE.
Keywords: MR elastography, spin-echo, iron-overload, viscoelasticity, attenuation
Introduction
Chronic liver disease (CLD) is a major public health problem worldwide. In the United States, CLD and cirrhosis are the tenth leading cause of death and responsible for more than 25,000 deaths annually (1). Many etiologies including chronic viral infections such as hepatitis B and hepatitis C, alcohol, nonalcoholic liver disease (NAFLD), hemochromatosis, primary sclerosing cholangitis (PSC), primary biliary cirrhosis (PBC) and autoimmune hepatitis cause CLD. CLD is characterized by ongoing inflammation and simultaneous healing process that leads to loss of liver parenchyma, fibrosis deposition and vascular alterations. Untreated CLD progresses to advanced fibrosis/cirrhosis with associated complications of portal hypertension, hepatocellular carcinoma, hepatic decompensation and death. Successful treatment of CLD etiology results in hepatic parenchyma recovery, and prevents progression of fibrosis. Near complete regression of fibrosis and return to almost normal liver parenchyma can happen if treated early (2–4). Therefore, early detection and accurate staging of the liver fibrosis is essential in CLD to determine the treatment choices and prognosis.
Although liver biopsy is considered the reference standard for staging of hepatic fibrosis, it is an invasive procedure associated with pain, cost, non-negligible risk of major complications and frequently refusal by patients, particularly if multiple serial assessments need to be performed (5). Other major limitations are sampling errors as biopsy samples are ~ 1/50,000 part of liver, heterogeneity of liver fibrosis and high intra and inter-observer variability even among expert pathologists (5–11). Liver biopsy is therefore not an accurate reference standard creating a need for alternative and preferably non-invasive techniques (12). Several serum laboratory tests are useful for prediction of liver fibrosis and they perform well for detection of advanced fibrosis or cirrhosis but do not have high accuracy for detection of early or mild fibrosis (13–15).
Conventional imaging methods such as CT and MRI can determine changes in liver morphology that are characteristic of cirrhosis. However, these signs are not sensitive enough, and often only seen in advanced stages of liver fibrosis or cirrhosis; making them unreliable for detection of fibrosis in early stages (15–17).
Elastography techniques have recently emerged as alternative non-invasive tests for liver fibrosis. Currently MR Elastography (MRE) is the best noninvasive method available for detection and staging of liver fibrosis (18–20).
In this review, we will provide a baseline understanding of mechanical changes that occur in liver fibrosis followed by review of principle, technique and clinical applications of liver MRE. Finally, a brief update of modifications and innovations in MRE technique for clinical applications in liver disease will be discussed.
Hepatic fibrosis and its effect on liver stiffness
Normal liver parenchyma is composed of hepatocytes, sinusoidal endothelial cells, Kupffer cells and other cells in the space of Disse, sinusoidal spaces, and the vessels and lymphatics supplying the liver. The blood in the sinusoids and the vessels contribute to nearly one third of the liver volume. The liver parenchyma enclosed by a thin connective tissue capsule (Glisson’s capsule), and the extracellular matrix (ECM) provides the structural support within the substance of the liver. The ECM is composed mainly of collagen, glycoproteins and proteoglycans(21) and the normal collagen content is <1% of weight of liver. Blood flow through liver is approximately 1–1.5 liters/min and is a low-pressure flow system due to large cross-sectional area of the sinusoids. Normal liver can accommodate increased blood inflow without any significant increase in the intrahepatic pressure. Owing to this compliant nature of parenchyma and small amount of collagen in ECM, normal liver is a very soft organ. Outflow obstruction, however would cause congestion, edema and stretching of the liver capsule leading to increased parenchymal pressure and increased liver stiffness.
Hepatic fibrosis is a dynamic process characterized by the excessive ECM accumulation in response to injury and inflammation, and this is balanced with degradation of the excessive ECM and remodeling (22). Activation of hepatic stellate cells into myofibroblasts plays the central role in hepatic fibrosis in liver injury (2, 23). Other sources of fibrosis are fibroblasts and myofibroblasts residing in the portal tract, around the central vein and smooth muscle cells in vessel walls. When the hepatic fibrosis exceeds the degradation, progressive fibrosis ensues and cirrhosis results eventually along with changes in vascular architecture. This progression of fibrosis typically takes several years’ especially from early stages but can increase rapidly in advanced fibrosis stage or when immunocompromised states coexist. The fibrosis deposition in liver parenchyma is variable in both quantity and spatial distribution in different CLDs as well as among diseased livers from same etiology (22, 24).
The increased ECM (mainly collagen) in hepatic fibrosis and associated vascular architecture changes lead to increased tissue stiffness. As mentioned above, the degree of increase in stiffness occurs in small increments in early fibrosis stages but in an exponential manner during advanced fibrosis/cirrhosis. This trend of variation in amount of fibrous tissue or collagen deposition during different stages of fibrosis closely parallels with the increase in stiffness (25). Hepatic fibrosis also causes remodeling of the liver parenchyma and vascular alterations that can influence tissue stiffness. The accommodation of increased portal flow following a meal is impaired in liver fibrosis and this can result in increased liver stiffness measurement (LSM) (26). Whereas a normal liver parenchyma would be compliant and there is no or minimal increase in stiffness following a meal.
The degree of fibrosis (fibrosis burden) is variable in CLD in different etiologies (24, 27–30). Chronic hepatitis B is typically macronodular cirrhosis with thin septa (27) therefore less fibrosis burden at the same stage as compared to chronic hepatitis C which results in micronodular cirrhosis which results in more fibrosis burden (30). LSM correlates with degree of fibrosis and may be different among patients of same fibrosis stage from same etiology (31). Similarly, LSM may also be different among patients with same fibrosis stage from different etiologies (32).
In addition to fibrosis, inflammation, edema, venous congestion, biliary obstruction can cause increased liver parenchymal stiffness and therefore are confounding factors in the evaluation of liver fibrosis with LSM. Hepatic steatosis as a confounder of LSM with ultrasound-based elastography is controversial and remains to be determined, however is not a significant confounder for LSM with MRE (20, 33).
Principle of MRE of liver
The basic principle of MRE is to propagate mechanically produced shear waves into the liver, image these propagating shear waveforms using modified phase contrast MRI sequence to obtain wave information in the liver, and using an inversion algorithm convert the wave information into tissue stiffness maps or elastogram (19, 34).
Shear waves propagate more rapidly in stiffer tissue (e.g., cirrhotic liver) than in softer tissue (e.g., normal liver). If the shear waves are continuous produced (dynamic), the speed of propagation is reflected in its wavelength. Therefore, as tissue stiffness increases, the wavelength of the propagating shear waves becomes more elongated (19).
MRE of liver technique
Here we describe the FDA approved clinical liver MRE system. The most commonly used set up for clinical liver MRE consists of an active driver, a passive driver applied on lower right chest wall closer to the liver and a 25-foot long plastic tube that connects the active driver to the passive driver (fig.1). The active driver is an acoustic driving system located outside the scanner room that generates shear waves in tissue, typically at 60Hz for clinical use. Shear waves can also be generated in the liver using electromechanical voice coils or passive rigid rod drivers (35, 36). The passive driver is a disc shaped nonmetallic passive drum driver 19 cm in diameter with a membrane surface that vibrates and is placed in contact with the patient. The passive driver is activated with varying acoustic pressure conducted via the PVC plastic tube from the active driver.
Fig.1.
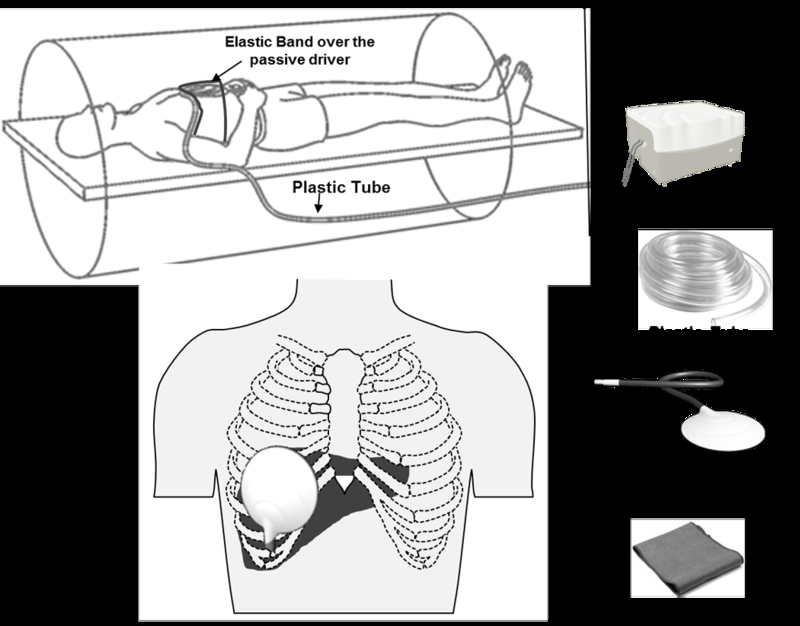
MRE of liver set up. Note that active driver is placed outside the scanner and mechanical waves are conducted into the passive driver via a long plastic tube. The passive driver is placed at the level of xiphisternum and in right mid clavicular line as shown.
Patients undergoing clinical MRE are required to fast at least 4–6 hours to avoid any postprandial effects on LSM (26). Patients are imaged in the supine position with the passive driver placed against the anterior body wall along the mid-clavicular line over the right lobe of the liver on the chest below the breast, and with center of the driver at the level of xiphisternum (fig.1). The passive driver is held in place with an elastic band around the body. Continuous longitudinal vibrations at 60 Hz are generated by varying acoustic pressure waves transmitted from an active driver device via the connecting plastic tube.
In patients with anatomical variants, bowel interposition between liver and anterior body wall, chest wall deformities and prior hepatic resections, the passive driver may be placed closest to the largest part of the liver/ remnant liver to ensure good transmission of shear waves into the largest part of the liver.
MRE sequence
MRE uses a modified phase contrast imaging sequence to determine tissue displacement caused by the propagation of shear waves. The modified sequence typically uses a conventional MR sequence such a gradient recalled echo (GRE), spin echo (SE), balanced steady state free precision (bSSFP) or echo planar imaging (EPI). Motion encoded gradients (MEGs) are added which allows imaging of the shear waves. MRE can spatially map and quantitate displacement patterns corresponding to harmonic mechanical waves with amplitudes of microns in tissue. Strain and other mechanical characteristics related to wave propagation can be calculated from these displacement patterns(37). The most widely used clinical MRE sequence is two-dimensional gradient recalled echo MRE (2D-GRE MRE) sequence (Table.1, fig.2).
Table.1.
Imaging parameters of a 2D-GRE-MRE for liver on a 1.5T magnet scanner
| Parameters | Typical values |
|---|---|
| Orientation | Supine/Feet first |
| Coil | Surface coil |
| Slice orientation | Axial |
| Field of view (FOV) | 30–42cm |
| Fractional FOV | 0.7– 1.0 (patient specific)-optional |
| Frequency direction | Right/Left |
| Matrix | 256 ×64 |
| Slice thickness | 10mm |
| Number of slices | 4 |
| Breath hold | Breath hold in expiration |
| TR/TE | 50/20 |
| Flip angle | 25–30 |
| Number of echoes | 1 |
| Echo train length | 1 |
| Bandwidth | 31.25ms |
| Number of excitations (NEX) | 1 |
| Acceleration factor | 2 |
| Active driver frequency | 60Hz |
| Active driver power | 50% (up to 100% can be used) |
| Phase offsets | 4 |
| MEG frequency | 60Hz |
| Number of MEG | 1 |
| MEG amplitude | 1.76 Gauss/cm (variable and machine specific) |
| MEG direction | R/L same as slice direction |
| Acquisition time | 50–60s ( four breath holds) |
Fig.2.
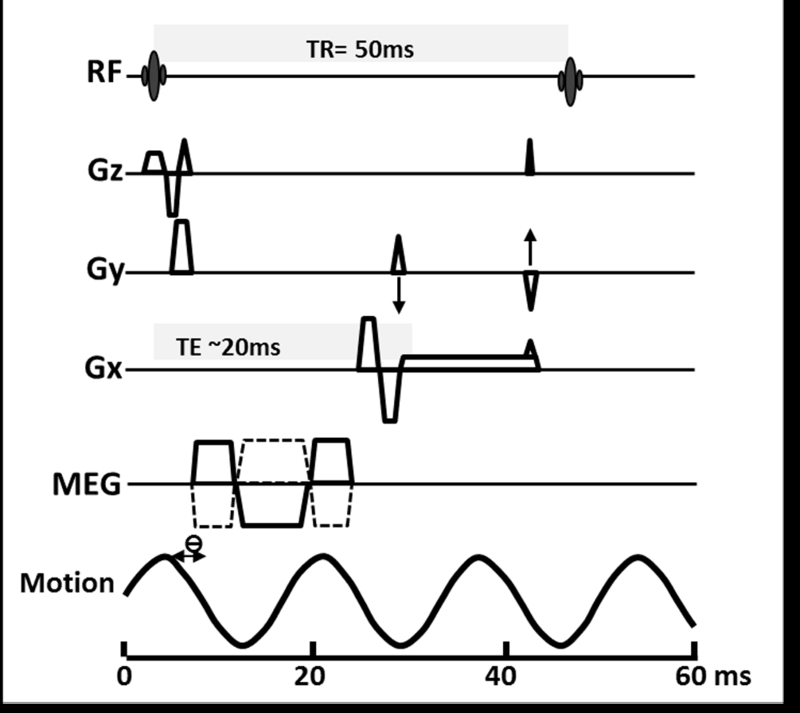
Two dimensional GRE MRE sequence for 1.5T scanner
The MEGs are oriented in a particular direction (usually z-direction), switched in polarity (oscillation) at an adjustable frequency, and synchronized with the acoustic driver system. For 2D-GRE MRE, the MEG frequency is same at 60Hz (fig.2). By slightly adjusting the phase offset between mechanical excitation and the oscillation of the MEGs, wave images are obtained at different points of time of propagation. In the 2D-GRE MRE sequence, four phase offsets evenly placed over 1 cycle of motion are used.
Four axial (transverse) slices of 5 to10mm thick are placed in the widest part of the liver to obtain largest cross-section of liver parenchyma for LSM (fig.3). These four slices are best positioned in the upper middle part of the liver.
Fig.3.
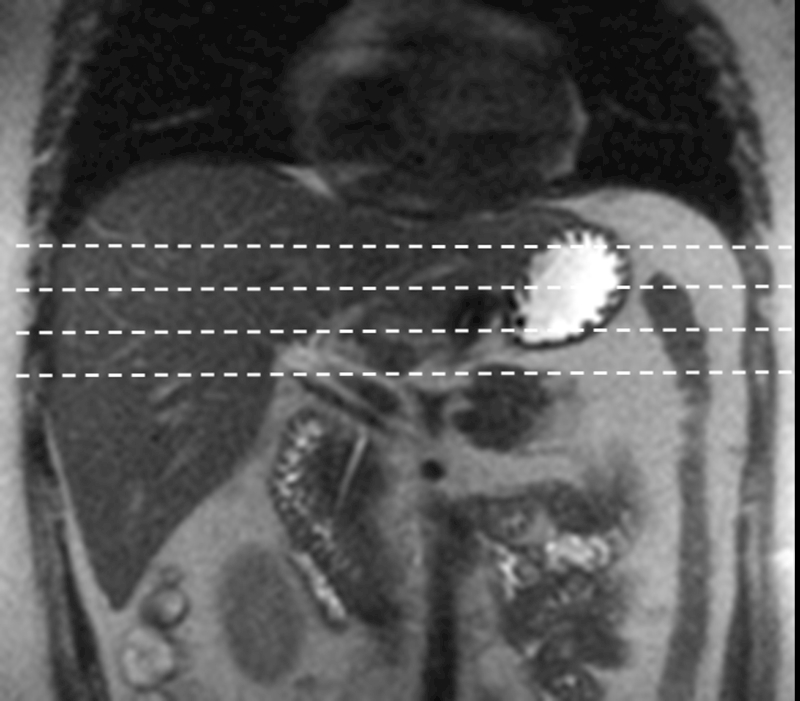
Slice placement for MRE of liver. Coronal T2-weighted sequence used for positioning. The slices are placed evenly across the largest cross-section of the liver.
Each of the four slices is obtained with one breath hold in expiration of about 8–16 seconds depending on the size of the patient. The slices are obtained in expiration as the position of the liver is most reproducible and there is no compression effect of the diaphragm that may occur in inspiration. A typical MRE sequence is completed with 4 breath holds and within 2 minutes to allow for normal breathing in between breath holds. The phase and magnitude images will become available for view on the scanner control as soon as acquisition of a slice is performed (fig.4). The performing technologist can verify the propagation of waveforms by reviewing both the magnitude and phase images. If the waves are not visible on the phase images, most likely explanation is that the waves are not delivered and likely due to failure to connect the plastic tube to the passive driver or loose connection between the two with air leak. The other causes may be due to non-synchronization of active driver to the sequence or failure to activate the active driver. Both should be checked and rectified before additional slices are obtained. Subjects undergoing MRE can also verify if they experience vibrations from the passive driver.
Fig.4.
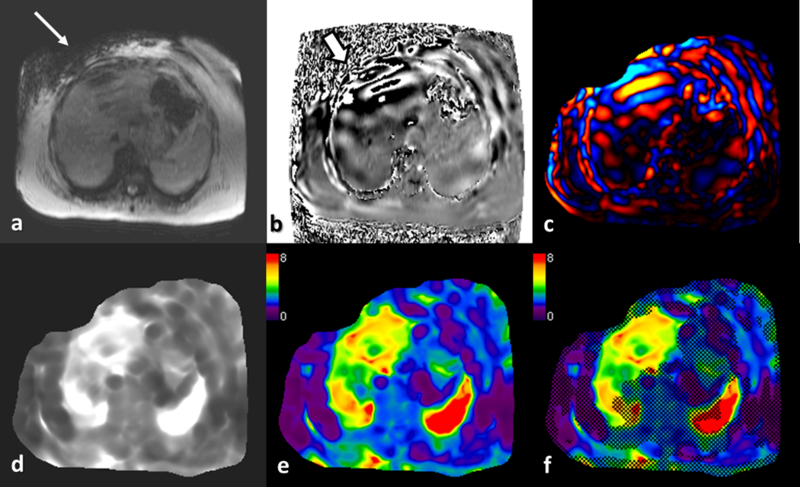
Liver MRE in a patient with NASH. Magnitude image (a) and phase image (b) are available for review immediately after acquisition of a slice. Note the signal loss in right upper quadrant subcutaneous fat (arrow) suggestive of shear waves at the passive driver (not show). Similarly the phase image show high phase shift occurring just below the driver due to intravoxel phase dispersion (white block arrow). Shear waves are seen within the liver, spleen and subcutaneous fat on the phase image. Wave image © showing the shear waves in color. Gray scale (d) and color scale ( e) stiffness maps (elastograms) and color stiffness map with overlayed confidence map (f) are automatically processed within 2 minutes of acquisition.
Post processing
Before the inversion of wave information into stiffness maps, several pre-processing algorithms including phase unwrapping, directional filtering, removal of concomitant gradient field effects and removal of longitudinal wave is done to improve accuracy of the elastograms. The inversion is performed using one of the following algorithms: spatial frequency measurement, direct inversion of differential equations of motion or iterative method involving finite element model. All the steps are performed automatically on the scanner console without any need for human input(34). The typical interval for production of stiffness map after acquisition of MRE is about 2 minutes or less depending on the inversion algorithm used.
The mechanical property measured with the MRE inversion algorithm is the “magnitude of the complex shear modulus” and expressed in kilopascals (kPa). This parameter accounts for both elasticity and viscosity of the tissue.
Depending on the software installed, Post processing typically produces several images including color wave images, gray scale elastogram, color scale elastogram (0 to 8kPa), and color scale elastogram with confidence map overlay (fig.4).
Liver stiffness measurement (LSM)
LSM is performed by drawing region of interest (ROI) on the elastograms. ROIs should cover regions of the liver with sufficient wave amplitude and for avoiding edge effects, should be spaced at least one-half wavelength from the liver margin, large vessels, the gallbladder fossa, and any areas influenced by cardiac and vascular artifacts need to be excluded. Ideally, the entire liver parenchyma in the cross-section should be evenly “illuminated” by planar shear waves with adequate amplitude, but in clinical practice, regions of wave attenuation and separation are seen and therefore the entire parenchyma cannot be included in the measurement. Regions of wave interference and artifacts due to wave propagation should also be excluded. The ROIs may be drawn on the magnitude image and copy pasted onto the confidence map. The ROI can be modified to fit into the confidence map and the mean LSM can be obtained.
The mean ROIs from all the four slices obtained is averaged and reported as mean LSM of the liver. It is useful to report the range of the mean LSM, which can serve as a reference for follow up studies. Free hand large ROI are preferred over small ROIs as larger area of sampling produces better reproducibility.
The LSM obtained with MRE is dependent on the frequency of applied mechanical waves and therefore cannot be directly compared with LSM obtained at different frequencies. The inversion methods and theoretical assumptions used in stiffness calculations are different between MRE and ultrasound based elastography methods, and therefore the LSM from each modality are not directly comparable. Vibration controlled transient elastography (VCTE) measures Young’s modulus that is about 3 times the shear modulus measured with MRE.
Technical performance of MRE of liver
MRE can be performed on both 1.5T and 3T clinical scanners. LSM is a mechanical property and independent of the magnetic field strength when all other parameters and conditions are similar. The tissue stiffness is determined by the mechanical frequency used; therefore, it is extremely important to perform MRE at the same frequency for comparable LSM. MRE of liver is repeatable and reproducible with high intra and inter observer agreement in both normal healthy individuals as well in patients with CLD (38–42). Besides, MRE can obtain reliable studies even in obese patients and in those with hepatic steatosis (20, 33, 43).
Several studies have shown that LSM obtained with MRE on systems from different manufacturers are highly comparable and reproducible (44–46). Evaluating the stiffness of large portion of liver parenchyma with MRE accounts for this high reproducibility.
Technical failures account for less than 5% of all the MRE exams. The most common cause for failure is iron overload in the liver. The iron overload when severe reduces signal intensity of the parenchyma such that amplitude of signal of propagating shear waves is very low. However, the mechanical shear waves still travel through the liver parenchyma. In a study by Wagner et al. (47) on 781 liver MREs, the technical failure rate of MRE with a 2D GRE MRE was low(3.5%) at 1.5 T but significantly higher (15.3%) at 3.0 T. Massive ascites, iron deposition, and high body mass index were other independent factors associated with failure of MRE. In a meta-analysis study with nearly 700 patients from different countries (20), the failure rate of MRE was only 4.3% mostly seen in patients with high liver iron content. Currently, according to improved sequences for patients with iron overload, it is predicted that the failure rate will drop to less than 1%. Compared to vibration controlled transient elastography (VCTE) MRE has significantly lower technically failed studies (4% vs. 11–20%) (48). Other possible causes include poor contact between passive driver and chest wall, loose connection between passive driver and plastic tube, failure of synchronization between active driver and MRE sequence.
MRE is a motion sensitive sequence and poor breath hold can result in failed studies. Modifications in the technique including reduced breath hold duration or free breathing liver MRE are currently being explored.
Clinical applications of liver MRE
Diffuse liver disease
Fibrosis detection and staging
Normal, healthy liver is soft and has a mean stiffness value of 2.05–2.44 kPa and reported LSM ranges from 1.54 to 2.87 kPa.(40, 42, 49–52). Fibrotic livers are stiffer than normal liver. MRE can differentiate normal liver from fibrotic livers with 89%−99% accuracy, 80%−98% sensitivity and 90%−100% specificity (33, 51, 53–58). Early fibrosis can be detected even when anatomical features suggestive of fibrosis are absent (59, 60). The cut-off LSM for detection of liver fibrosis ranges from 2.4 to 2.93kPa (33, 51, 53–56) in different studies. The different LSM cut-offs are likely due to different populations studied and inclusion of multiple causes of CLD.
The stiffness of liver parenchyma increases with progression of fibrosis as described above (fig.5). LSM with MRE significantly correlates (r = 0.78, p < 0.001) with fibrosis content in the liver biopsy samples(61) and MRE has been shown to be as accurate as liver biopsy for liver fibrosis staging(62) The increase in the stiffness occurs in smaller increments during earlier stages of fibrosis and increases exponentially during advanced fibrosis and cirrhosis. This variable rate of progression of fibrosis impacts on the accuracy of MRE for distinguishing early fibrosis stages, especially from inflammatory changes only (53, 55) however the accuracy is still better than VCTE (63). Studies on single etiologies like viral hepatitis (53, 64), NAFLD (56, 65), Gaucher’s’(65) and alcoholic liver disease(66) are published and the cut-off values may be useful as references for these specific etiologies.
Fig.5.
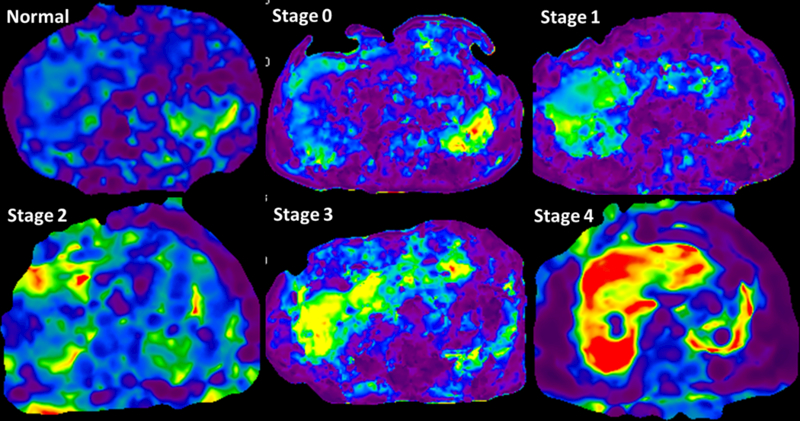
MRE stiffness maps showing increasing liver stiffness with increasing stages of fibrosis. The change in color from blue-violet in normal volunteer to orange red in stage 4 fibrosis can be readily appreciated. The mean LSM were 1.9kpa in normal, 2.8kPa in stage 0, 3.2kPa in stage 1, 3.6kPa in stage 2, 4.2 in stage 3 and 8.6kPa in stage 4 fibrosis.
MRE can accurately differentiate individual histological stages of fibrosis. The cut-offs for significant fibrosis and advanced fibrosis is variable and probably related to the variability in degree of fibrosis that occurs with different etiologies (53, 64, 66). Clinically significant fibrosis (stage≥2) can be differentiated from mild fibrosis (Stage 0 to 1) with >92% accuracy and positive predictive value of >93%. Similarly cirrhosis (Stage 4) can be diagnosed >95% accuracy and negative predictive value of >98% (55, 57). MRE can therefore accurately rule in significant fibrosis and rule out cirrhosis, which is very useful for clinical decision-making.
Singh et al (20) evaluated diagnostic performance of MRE in 12 studies with 697 CLD patients and showed that overall diagnostic accuracy for detecting advanced fibrosis (≥ stage 3) was excellent with an accuracy of 0.93. However the performance of MRE for the diagnosis of significant (≥ stage 2) and any fibrosis (≥ stage 1) was lower but still excellent (AUROC, 0.84–0.88) (20). The cut-offs for distinguishing stage1, stage 2, stage 3 and stage 4 fibrosis were 3.45, 3.66, 4.11, and 4.71 kPa, respectively. The diagnostic performance of MRE did not show any association with age, sex, obesity, and degree of necroinflammatory activity on biopsy. On stratified analysis by etiology of CLD, the diagnostic performance of MRE was comparable across patients with HCV, HBV, NAFLD, and alcoholic liver disease. Other systematic reviews have also confirmed the excellent diagnostic performance of MRE (67, 68). MRE is useful in the evaluation of liver fibrosis in pediatric subjects and in post-transplant recipients (69–71).
MRE assesses a significant portion of the liver providing an opportunity for assessment of pattern of stiffness distribution across a cross-section of the liver; highlight heterogeneity that may reflect variations for fibrosis. Spatial distribution of stiffness in different CLD may also be observed. This information may be useful for providing guidance for liver biopsy (72).
For clinical use of MRE in the staging of liver fibrosis, LSM cut-offs are proposed corresponding to stage 1–2, stage 2–3, stage 3–4 and stage 4 to facilitate decision making (31) (Table.2). The interpretation of LSM should always be made in the clinical context and in the light of laboratory test results. LSM is an independent predictor for the transition from compensated to decompensated state in patients with advanced hepatic fibrosis, and LSM ≥5.8 kPa is has been shown to be associated with greater risk of decompensation (73).
Table.2.
MRE cut-offs for staging of liver fibrosis.
| LSM | Fibrosis stage |
|---|---|
| <2.5kPa | Normal |
| 2.5 to 2.93 kPa | Normal or inflammation |
| 2.93 to 3.5 kPa | Stage 1–2 fibrosis |
| 3.5 to 4.0 kPa | Stage 2–3 fibrosis |
| 4.0 to 5.0 kPa | Stage 3–4 fibrosis |
| >5.0 kPa | Stage 4 fibrosis |
Clinical Follow Up and Assessment of Treatment Response
Liver biopsy cannot reliably detect quantitative changes in the fibrosis following a therapy, as the evaluation is subjective and prone for interobserver variation. In addition, repeating liver biopsy is not feasible in routine clinical practice. Non-invasive assessment with MRE may be better suited for evaluating fibrosis burden (74) and can demonstrate changes in stiffness over time in patients on clinical follow-up. Studies have proven that improvement in fibrosis burden is possible with proper treatment and MRE can be used as a treatment response evaluating technique (75–80). A recent meta-analysis concluded that a change in stiffness of 20% or greater measured using identical conditions- same site and same equipment represents a true change in stiffness with 95% confidence (81). MRE was found useful to stratify the risk of clinical progression of cirrhosis from Child-Pugh Class A to B in patients with chronic viral hepatitis C (82). In this study, the hazard ratio for 1kPa increase was 1.397 for cirrhosis progression (p=0.007) and the one-year risk of cirrhosis progression was negligible in patients with mean LSM <3.3kPa. In another study Asrani et al found that (73) a mean LSM of 5.8kPa was predictive of decompensation in patients with chronic hepatitis C.
Non-alcoholic fatty liver disease (NAFLD)
NAFLD is the most common cause of chronic liver disease worldwide with an estimated prevalence of 20–40% and associated with metabolic syndrome and diabetes mellitus (83–85). NAFLD is comprised of a spectrum of simple steatosis to non-alcoholic steatohepatitis (NASH) characterized by inflammation, ballooning and with/without fibrosis. NASH Is linked to metabolic syndrome and its prevalence is high in diabetics and obese where it can be as high as 12% (86) and progress to cirrhosis with increased risk of hepatocellular carcinoma (87–89). NASH patients have higher mortality rate than compared to isolated or simple steatosis (15% vs. <2.5%) attributable to cardiovascular as well as liver-related deaths (90–100). Currently, NAFLD is the third most common cause of liver transplantation, and on the route to becoming the most common cause (101–103). Hence, there is a need for distinction between simple steatosis versus NASH and to detect and observe the progression of fibrosis in patients with NAFLD (104). In recent years the NAFLD activity score (NAS) has acceptable role in defining NASH, although the ability of NAS to predict progression of fibrosis is poor (105, 106). Liver fibrosis is the single most important feature that predicts the outcome in NAFLD and liver-specific mortality can be predicted better by fibrosis stage than NAS (104). MRE is useful to differentiate simple steatosis from NASH (fig.6).
Fig.6.
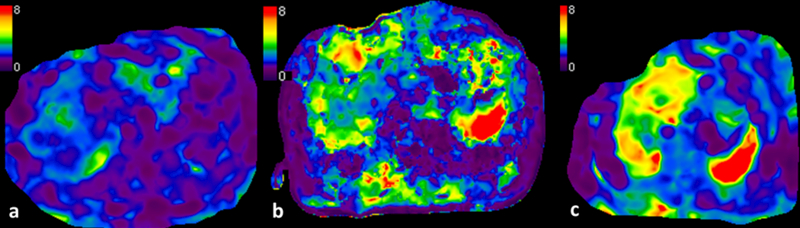
Use of MRE in NAFLD. Three patients with NAFLD. Simple steatosis or isolated steatosis shows normal liver stiffness of 2.1kPa (a). Mildly elevated liver stiffness of 3.2kPa in a patient with NASH (b). Third patients with NASH and fibrosis with mean stiffness of 4.6kpa ©.
In a preliminary study, Chen et al (107) reported that MRE can discriminate simple steatosis (SS) from NASH ± fibrosis, with 94% sensitivity, 73% specificity, and an accuracy of 0.93 using a cut-off value of 2.74 kPa. However, recent studies including prospective studies have shown only modest accuracy of 0.70 to 0.81(108–111) for distinguishing NASH from simple steatosis.
In an another study, Kim et al (112) showed that in NAFLD, a cut-off value of 4.15 kPa, could detect advanced fibrosis (F3–F4) with an accuracy of 0.95, 85% sensitivity, and 93% specificity. Recent studies with both 2D and 3D MRE have shown similar higher accuracy in distinguishing advanced liver fibrosis in NAFLD (43, 108–110, 113).
MRE with proton density fat fraction (PDFF) performs significantly better than VCTE with CAP (109, 111) for detection of steatosis and fibrosis in patients with NAFLD.
Multiparametric and 3D MRE may be able to provide additional mechanical parameters that may be helpful to differentiate inflammation from fibrosis in early stages(114). A comprehensive liver MRI study that includes fat quantification, detection of inflammation and staging of liver fibrosis with liver MRE may place a significant role in NAFLD evaluation (115).
Focal liver lesions
Focal liver lesions (FLL) can be benign or malignant. It is imperative to identify properly, the nature of each FLL, to avoid the delayed treatment of the malignancy or the unnecessary treatment of a benign lesion (116). In a preliminary study, Venkatesh et al (117) found mean stiffness with MRE of malignant tumors was significantly higher than benign lesions or normal liver parenchyma or fibrotic liver tissue. They also claimed that a threshold value of >5kPa could correctly differentiate malignant and benign lesions with 100 % accuracy. In the same study, the mean stiffness of benign tumors was not significantly different from normal liver and fibrotic livers were significantly stiffer than benign liver tumors. As the stiffness of FLLs is dependent on tissue components, some focal nodular hyperplasia may be stiffer probably due to their central scar and the fibrous component. Hemangiomas are usually softer, because of multiple large vascular spaces and fibrous septa. Metastatic lesions have variable stiffness, depending on their composition. However, most solid metastases are stiffer than normal liver. Cholangiocarcinoma demonstrate higher stiffness than HCC and this is most likely due to their desmoplastic reaction and fibrous stroma (117, 118).
A preliminary study by Thompson et al (119) showed increased tumor stiffness in well/moderately differentiated HCC compared to poorly differentiated HCC, suggesting that tumor stiffness by MRE may be able to differentiate HCC tumor grade.
In the future, it may be possible, to determine the type of liver tumor by measuring their stiffness. To this end, more studies with larger number of tumors are needed. In a study, Li et al. (120) evaluated the changes secondary to tumor treatment with the vascular disrupting agent ZD6126; they found that the amount of the absolute value of the complex shear modulus, elasticity and viscosity on MRE, decreases before any significant detectable change in tumor apparent diffusion coefficient (ADC) values. MRE can provide early imaging biomarkers for treatment-induced tumor necrosis (120) In another study, Pepin et al (121) revealed a significant decrease in MR elastography-derived tumor shear stiffness, within four days of chemotherapy treatment in an animal model. Although tumor volume did not change significantly during this period, reduction in cell proliferation was observed. Stiffness of treated HCCs is significantly lower than those that are treated and the measured stiffness correlated with enhancement ratio and percentage of necrosis(122).
Limitations
Technical factors:
Failure to conduct shear waves into the liver, which could result from failure to connect the passive driver to the conducting tube. Failure to obtain good contact between passive driver and the patient can also result in poor transmission of the waves. An MRE sequence related limitation is when time to echo (TE) is closer to opposed-phase leading to reduced signal of the liver especially fatty liver. TE should be adjusted to be near or at in-phase to maximize signal intensity of the liver parenchyma.
Patient factors:
Due to limited scanner bore (60–70cm) extreme obesity may make it difficult or impossible for patient to be positioned in the MR scanner with passive driver applied. Anatomical factors may result in poor contact between passive driver and patient such as chest wall deformities, prior surgeries or abdominal distension. In such situations, passive driver can be placed on right lateral lower chest wall or other position where a good contact can be obtained and the largest part of liver is nearby to ensure good transmission of the shear waves. As MRE sequence is motion sensitive, breath hold is critical to minimize the artifact due to poor breath hold. Shortening the breath hold duration may help reduce this artifact. It is now possible to obtain a single slice of MRE in as short a time as 11–12 seconds, which will be useful to obtain good quality images. Improving acquisition time with reduced k-space acquisition and use of parallel imaging may also help minimize breath hold artifacts.
Iron overload:
This is the most common cause of failure of 2D-GRE MRE in clinical practice. It is important to recognize that failure is due to low signal from the liver and not due to failure of propagation of shear waves. Implementing shorter TEs can improve the liver signal. Alternative pulse sequences with shorter TE such as spin-echo EPI sequence (Fig.7) are capable of visualizing the waves through the liver(123). In rare cases, the iron overload may be severe and it may be useful to perform MRE after treatment to reduce iron content in liver or evaluate stiffness with ultrasound elastography.
Fig.7.
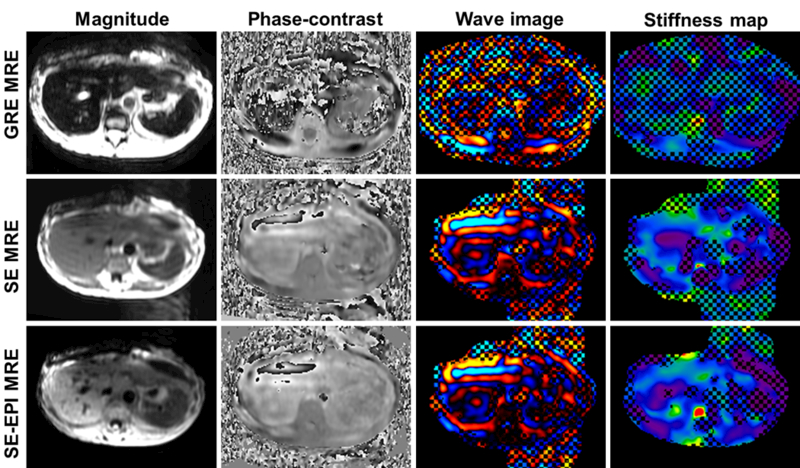
MRE in a patient with iron overload using the 2D-GRE MRE (top row), SE MRE (middle row) and the SE-EPI MRE techniques (bottom row). Magnitude, phase contrast, wave and stiffness maps from left to right. The low signal level within the liver resulted in noise-dominated phase images for the data obtained with GRE MRE. In contrast, both spin-echo sequences had significantly improved SNR and confidence level. The shear waves can be visualized in the phase-contrast images.The hepatic stiffnesses were 2.3 (±0.83) kPa for SE and 2.4 (±0.77) kPa for SE-EPI while the GRE data was considered a failure.
Confounding factors for fibrosis staging with MRE
LSM may be affected by parenchymal inflammation, which often accompanies chronic viral hepatitis although the effect may not be significant. Studies on chronic viral hepatitis have shown that inflammation does not affect correlation of stiffness with fibrosis stage (71, 124). The confounding effect of inflammation will probably be most apparent in differentiating earlier stages of fibrosis from normal livers. More studies are required to establish the relationship between inflammation and liver stiffness. Passive venous congestion can lead to increased liver stiffness. In congestive hepatopathy liver stiffness is elevated (125). Hepatic steatosis alone may not increase the liver stiffness and there is no correlation between fatty change and liver stiffness measured in livers. Cholestasis can cause increase in stiffness (126). Diffuse infiltrative disease such as amyloidosis can increase liver stiffness(127).
Advances in MRE
Hardware
The passive driver currently used is a rigid plastic disc with vibrating membrane that is placed in contact with patient. Flexible drivers have been developed (fig.8) for closer opposition with the patient for improving delivery of shear waves into the liver. A recent study in normal healthy volunteers showed no significant differences in the LSM obtained with rigid and flexible drivers (128). Flexible driver may be more comfortable for patient and likely increase the ROI areas for LSM.
Fig.8.
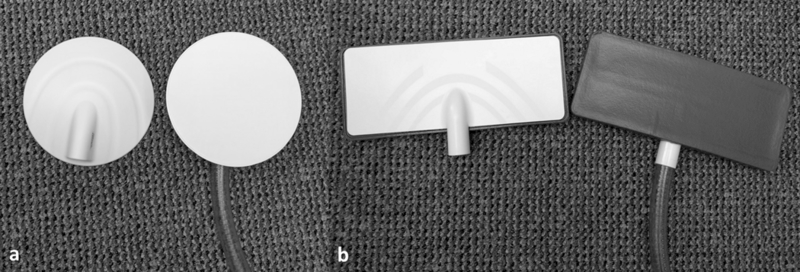
Photgraphs showing conventional hard disc passive driver (a) and flexible passive driver (b).
3D MRE sequence
The current clinical MRE sequence is a 2D sequence and works on the assumption that shear waves propagate in the plane of acquisition. However, this is not always true and waves traveling oblique to the plane of acquisition may lead to over estimation of LSM. 3D MRE enables encoding of motion in all three dimensions and processing of non-planar waves with better evaluation of spatial patterns of liver fibrosis and focal lesions (110) and also addresses the issue of artificially increased wavelengths due to oblique 2D waves violating the planar wave assumption (129). 3D MRE can also obtain additional parameters with complete wave field acquisition and fewer assumptions about the material model during inversion. For example, volumetric strain, which is one of these parameters, is sensitive to pressure-related changes (130) and may be beneficial in the evaluation of portal hypertension diagnosis.
The 3D MRE sequences are usually spin echo (SE) based to shorten the time of acquisition. A typical 3D MRE sequence acquires 32–40 slices and for LSM processing, the top 4 and bottom 4 slices are excluded to avoid partial volume effects. The LSM obtained with 3D MRE is usually lower than 2D GRE MRE however this does not affect the performance (131). A better performance of 3D MRE performed at 40Hz (standard is 60Hz) was reported in patients with NAFLD (110). 3D EPI MRE failure rate is lower than 2D GRE MRE, due to better performance in hepatic iron deposition (132).
Multi-frequency MRE (MF-MRE)
There has been interest in exploring various mechanical parameters for differentiation of pathological processes that occur in CLD. MF-MRE can allow these parameters to be assessed using various mechanical models. The diagnostic performance of MF-MRE at higher driving frequencies (50 and 62.5 Hz) is better than lower frequencies (25 and 37.5 Hz) (58). MF-MRE study has shown its utility in improving diagnosis of NASH from isolated or simple steatosis (110). With MF-MRE, the difference between hepatic stiffness of pediatric and adults was more obvious at higher frequencies (130). The MF-MRE increases time of acquisition and the clinical utility still needs to be determined (129, 130, 132)
MRE sequences designed for liver iron overload
Iron deposition in the liver is a characteristic of hemochromatosis and is often a coexisting finding in many chronic liver diseases. Iron characteristically accumulates in regenerative nodules in cirrhotic livers. With its superparamagnetic properties, iron deposition causes local magnetic field heterogeneities, and results in shortening of T1, T2 and especially T2* values. This effect causes a significant T2 /T2 *-dependent decrease in the liver signal intensity (133–135) especially in GRE sequences that lack a 180o refocusing pulse. Spin-echo (SE) sequences are less susceptible for magnetic field heterogeneities (136) would be useful in patients with liver iron overload.
Wagner et al (137) reported that success rate, image quality and liver coverage, and with SE EPI MRE is superior to GRE-MRE on 3T with less motion artifacts and shorter acquisition time with comparable performance.
Serai et al.(138) studied on a children group and found excellent agreement on liver stiffness values measured by 2D GRE and 2D EPI MRE. Furthermore, showed using EPI MRE, stiffness can be measured across larger areas of the liver and in a single breath hold. As a whole, EPI MRE is a helpful technique, in patients with iron overload or poor breath hold.
In a comparative study of five different MRE sequences (2D GRE MRE, 2D EPI MRE, Iron overload 2D EPI MRE, Iron overload 2D SE MRE and 3D EPI MRE) showed no significant effect of R2* on image quality of iron overload sequences but no significant effect on measured LSM on all five sequences. The success rates of Iron overload sequences were significantly higher than GRE MRE sequence. Also all SE MRE sequences had higher success rates and better image quality than GRE MRE in 3T scanners. BMI however had signicant effect on iron overload sequences (139) likely due to lower TE leading to signal to noise ratio. The liver edge artifacts are avoided using SE sequences which get worse with 2D GRE sequences in higher field strength scanners
A meta analysis comparing 2D GRE MRE and 2D SE EPI MRE for staging of liver fibrosis showed no significant differences in accuracy of two methods(140) . GRE-MRE has better agreement and repeatablity and therefore should be used first and in case of failure of GRE-MRE, SE EPI MRE should be performed(45). The SE-EPI MRE require a shorter acquisition time compared to GRE-MRE(69)
Post processing
The initial clinical liver MRE studies used local frequency estimation (LFE) inversion algorithm and later studies used multiscale direct inversion algorithm (MSDI). The current standard is multimodel direct inversion (MMDI) algorithm and has been shown to provide better image quality, and slightly lower stiffness values compared to MSDI at 3T MRE(141). A confidence map that excludes noisy or discontinuous data is a checkerboard is overlaid on the stiffness map to depict regions of lowest confidence or less reliable measurement. The ROIs are drawn within the region that is not checkered to obtain reliable LSM.
Automated LSM
Automated liver elasticity calculation (ALEC) is a newly developed automated algorithm for measuring LSM. The algorithm automatically localizes liver in the magnitude images, detects liver edge, and draws a large region of interest excluding regions of low confidence. ALEC has been shown to perform non-inferiorly with an experienced MRE reader. ALEC can improve the reproducibility of MRE by eliminating the intra-reader and decreasing the inter-reader variability (125, 142, 143). ALEC is currently used for clinical practice at Mayo Clinic, Rochester, MN.
Neural network inversion
Recent work has investigated a machine learning approach to MRE inversion, in which artificial neural networks were trained using simulated data and then applied in vivo (144). In simulation studies, this neural network inversion (NNI) is more accurate in noisy data compared to conventional direct inversion methods. In liver exams, the mean NNI result is tightly correlated with measures obtained from multiple-model direct inversion (MMDI), which is commonly used clinically. As with MMDI, NNI-based stiffness estimates are significantly correlated with fibrosis stage. The potential advantage in NNI lies in resolution. Improved resistance to noise can mitigate the need for filtering or large regions for computing summary statistics, which in the liver, could allow more accurate characterizations of focal lesions. Work is ongoing to test the hypothesis that NNIs can provide improved resolution of stiffness estimates.
Newer Clinical applications
Clinical applications of liver MRE are expanding from the initial application of detection and staging of liver fibrosis. MRE may be useful in predicting decompensation in chronic liver disease(73) and portal hypertension and esophageal varices(145). LSM with MRE is a predictor of risk of major complications due to blood loss during liver resection in patients with cirrhosis(146). In a small series, LSM with MRE has been found useful for predicting radiation induced liver disease in patients receiving radiotherapy for liver tumors(147). Newer indications continue to emerge along with estimation of splenic stiffness for prediction of portal hypertension
Chronic liver disease is characterized by necroinflammation, congestive and fibrotic changes. It will be useful to distinguish these components and determine how their contributions change temporally as well CLDs resulting from different etiologies. Some of the early results are promising for further research and validation in this direction.
Viscoelasticity detects inflammation.
Yin et al108 showed in an animal model that MRE-derived damping ratio and loss modulus can detect inflammation before the onset of fibrosis. In the same study, they also showed that damping ratio correlates negatively with portal pressure, whereas stiffness correlated positively. They concluded that liver stiffness and damping ratio might be useful to identify different pathophysiologic states. The current concept of the progression of NAFLD to NASH is that inflammation follows the development of steatosis. Inflammation is an essential factor in the development and progression of hepatic fibrosis. Viscoelasticity biomarkers provide a sensitive way to detect hepatic inflammation even before the onset of histologically etectable white cell infiltrates. This may also suggest that hepatic inflammation is present in obese patients even before the onset of steatosis and histologically detectable inflammation. Figure 9 illustrates the differences in damping ratio and loss modulus between a normal healthy volunteer and an obese individual with mild inflammation but near normal liver stiffness.
FIGURE 9.
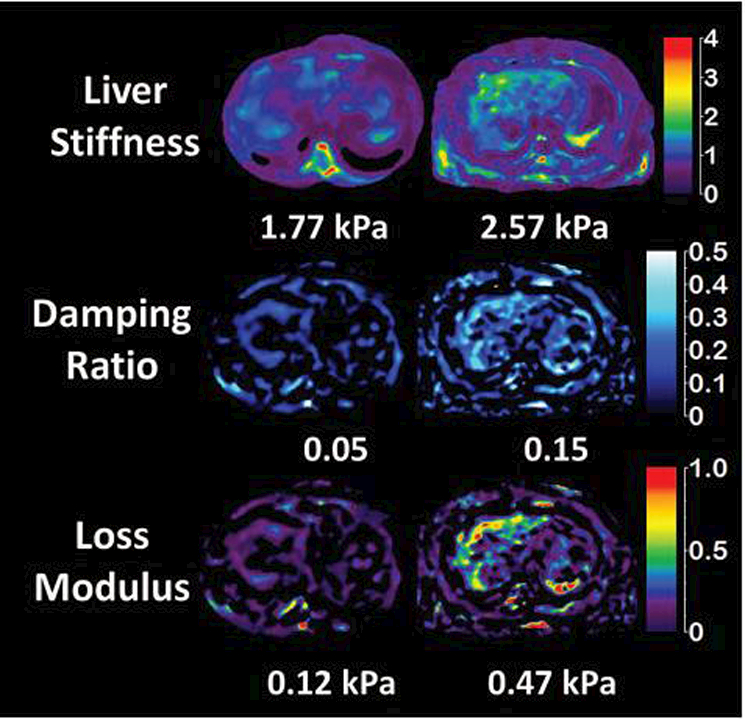
Liver stiffness, damping ratio and loss modulus in a healthy normal volunteer (column A) with BMI 21 and an obese patient (B) with BMI 32 and biopsy proven mild inflammation, no ballooning and no fibrosis. MRI showed fat signal fraction of 1.04% in the normal volunteer and 5.7% in obese individual, however liver biopsy showed no steatosis. The mean liver stiffness is borderline elevated (normal cut off is 2.5 kPa) in the obese individual, but damping ratio and loss modulus is significantly elevated and different from the normal healthy volunteer. Figure courtesey Dr. Jiahui Li, Mayo Clinic, Rochester, MN.
NAS prediction with imaging biomarkers
Histologic NAS comprises of steatosis, inflammation, and ballooning. It reflects disease activity rather than consequence (fibrosis). Considering the natural history of NAFLD, fibrosis usually occurs after hepatocellular ballooning. From our preliminary experience implementing a chemical shift based water and fat separation technique to measure liver fat fraction, multifrequency SE EPI MRE to measure LSM, and measuring damping ratio in both preclinical animal studies and clinical patients, we found that virtual NAS (vNAS) score is possible. In the pilot human study, data was collected from an ongoing perspective study (ID NCT02565446), a retrospective study48,141 and 12 normal volunteers (BMI<30 kg/m2). LSM, damping ratio and loss moduli may be significant predictors of NAS. Wehypothesize that these predictors can assess NAFLD disease activity better, especially for inflammation and ballooning which are hallmarks of NASH and used in NAS score.142,143 More data from both pre-clinical and clinical studies are necessary to confirm our findings.
Conclusion
Liver MRE is a robust technique for evaluation of liver stiffness and is currently the most accurate non-invasive imaging technology for evaluation of liver fibrosis. Improvement in MRE sequences have helped in reducing the technical limitations of clinical liver MRE. Advances in MRE technology has led to understanding of newer mechanical parameters that may be useful in understanding pathological processes in chronic liver disease and may prove useful in their management.
Contributor Information
Safa Hoodeshenas, Department of Radiology, Mayo Clinic, Rochester, MN, United States.
Meng Yin, Department of Radiology, Mayo Clinic, Rochester, MN, United States.
Sudhakar Kundapur Venkatesh, Department of Radiology, Mayo Clinic, Rochester, MN, United States.
References
- 1.Kim WR, Brown RS Jr., Terrault NA, El-Serag H. Burden of liver disease in the United States: summary of a workshop. Hepatology (Baltimore, Md) 2002;36(1):227–42. [DOI] [PubMed] [Google Scholar]
- 2.Tsuchida T, Friedman SL. Mechanisms of hepatic stellate cell activation. Nature reviews Gastroenterology & hepatology 2017;14(7):397–411. [DOI] [PubMed] [Google Scholar]
- 3.EASL clinical practice guidelines: Management of chronic hepatitis B virus infection. J Hepatol 2012;57(1):167–85. [DOI] [PubMed] [Google Scholar]
- 4.Ghany MG, Nelson DR, Strader DB, Thomas DL, Seeff LB. An Update on Treatment of Genotype 1 Chronic Hepatitis C Virus Infection: 2011 Practice Guideline by the American Association for the Study of Liver Diseases. Hepatology (Baltimore, Md) 2011;54(4):1433–44. [DOI] [PMC free article] [PubMed] [Google Scholar]
- 5.Cadranel JF, Rufat P, Degos F. Practices of liver biopsy in France: results of a prospective nationwide survey. For the Group of Epidemiology of the French Association for the Study of the Liver (AFEF). Hepatology (Baltimore, Md) 2000;32(3):477–81. [DOI] [PubMed] [Google Scholar]
- 6.Bedossa P, Dargere D, Paradis V. Sampling variability of liver fibrosis in chronic hepatitis C. Hepatology (Baltimore, Md) 2003;38(6):1449–57. [DOI] [PubMed] [Google Scholar]
- 7.Castera L, Negre I, Samii K, Buffet C. Pain experienced during percutaneous liver biopsy. Hepatology (Baltimore, Md) 1999;30(6):1529–30. [DOI] [PubMed] [Google Scholar]
- 8.Poynard T, Ratziu V, Bedossa P. Appropriateness of liver biopsy. Canadian journal of gastroenterology = Journal canadien de gastroenterologie 2000;14(6):543–8. [DOI] [PubMed] [Google Scholar]
- 9.Regev A, Berho M, Jeffers LJ, Milikowski C, Molina EG, Pyrsopoulos NT, et al. Sampling error and intraobserver variation in liver biopsy in patients with chronic HCV infection. Am J Gastroenterol 2002;97(10):2614–8. [DOI] [PubMed] [Google Scholar]
- 10.Maharaj B, Maharaj RJ, Leary WP, Cooppan RM, Naran AD, Pirie D, et al. Sampling variability and its influence on the diagnostic yield of percutaneous needle biopsy of the liver. Lancet (London, England) 1986;1(8480):523–5. [DOI] [PubMed] [Google Scholar]
- 11.Rousselet MC, Michalak S, Dupre F, Croue A, Bedossa P, Saint-Andre JP, et al. Sources of variability in histological scoring of chronic viral hepatitis. Hepatology (Baltimore, Md) 2005;41(2):257–64. [DOI] [PubMed] [Google Scholar]
- 12.Rockey DC, Bissell DM. Noninvasive measures of liver fibrosis. Hepatology (Baltimore, Md) 2006;43(2 Suppl 1): S113–20. [DOI] [PubMed] [Google Scholar]
- 13.Castera L Noninvasive Evaluation of Nonalcoholic Fatty Liver Disease. Seminars in Liver Disease 2015;35(3):291–303. [DOI] [PubMed] [Google Scholar]
- 14.Castera L, Winnock M, Pambrun E, Paradis V, Perez P, Loko MA, et al. Comparison of transient elastography (FibroScan), FibroTest, APRI and two algorithms combining these non-invasive tests for liver fibrosis staging in HIV/HCV coinfected patients: ANRS CO13 HEPAVIH and FIBROSTIC collaboration. HIV Medicine 2014;15(1):30–9. [DOI] [PubMed] [Google Scholar]
- 15.Castera L Invasive and non-invasive methods for the assessment of fibrosis and disease progression in chronic liver disease. Best practice & research Clinical gastroenterology 2011;25(2):291–303. [DOI] [PubMed] [Google Scholar]
- 16.Venkatesh SK, Yin M, Takahashi N, Glockner JF, Talwalkar JA, Ehman RL. Non-invasive detection of liver fibrosis: MR imaging features vs. MR elastography. Abdominal imaging 2015;40(4):766–75. [DOI] [PMC free article] [PubMed] [Google Scholar]
- 17.Rustogi R, Horowitz J, Harmath C, Wang Y, Chalian H, Ganger DR, et al. Accuracy of MR Elastography and Anatomic MR Imaging Features in the Diagnosis of Severe Hepatic Fibrosis and Cirrhosis. Journal of magnetic resonance imaging : JMRI 2012;35(6):1356–64. [DOI] [PMC free article] [PubMed] [Google Scholar]
- 18.Venkatesh SK, Ehman RL. Magnetic resonance elastography of abdomen. Abdominal imaging 2015;40(4):745–59. [DOI] [PMC free article] [PubMed] [Google Scholar]
- 19.Venkatesh SK, Yin M, Ehman RL. Magnetic resonance elastography of liver: Technique, analysis, and clinical applications. Journal of Magnetic Resonance Imaging 2013;37(3):544–55. [DOI] [PMC free article] [PubMed] [Google Scholar]
- 20.Singh S, Venkatesh SK, Wang Z, Miller FH, Motosugi U, Low RN, et al. Diagnostic performance of magnetic resonance elastography in staging liver fibrosis: a systematic review and meta-analysis of individual participant data. Clinical gastroenterology and hepatology : the official clinical practice journal of the American Gastroenterological Association 2015;13(3):440–51.e6. [DOI] [PMC free article] [PubMed] [Google Scholar]
- 21.Schuppan D Structure of the extracellular matrix in normal and fibrotic liver: collagens and glycoproteins. Semin Liver Dis 1990;10(1):1–10. [DOI] [PubMed] [Google Scholar]
- 22.Pinzani M, Rombouts K, Colagrande S. Fibrosis in chronic liver diseases: diagnosis and management. J Hepatol 2005;42 Suppl(1):S22–36. [DOI] [PubMed] [Google Scholar]
- 23.Puche JE, Saiman Y, Friedman SL. Hepatic stellate cells and liver fibrosis. Comprehensive Physiology 2013;3(4):1473–92. [DOI] [PubMed] [Google Scholar]
- 24.Pinzani M, Rombouts K. Liver fibrosis: from the bench to clinical targets. Dig Liver Dis 2004;36(4):231–42. [DOI] [PubMed] [Google Scholar]
- 25.Venkatesh SK, Xu S, Tai D, Yu H, Wee A. Correlation of MR elastography with morphometric quantification of liver fibrosis (Fibro-C-Index) in chronic hepatitis B. Magn Reson Med 2014;72(4):1123–9. [DOI] [PubMed] [Google Scholar]
- 26.Yin M, Talwalkar JA, Glaser KJ, Venkatesh SK, Chen J, Manduca A, et al. Dynamic postprandial hepatic stiffness augmentation assessed with MR elastography in patients with chronic liver disease. AJR Am J Roentgenol 2011;197(1):64–70. [DOI] [PMC free article] [PubMed] [Google Scholar]
- 27.Vizzotto L, Vertemati M, Gambacorta M, Sabatella G, Spina V, Minola E. Analysis of histological and immunohistochemical patterns of the liver in posthepatitic and alcoholic cirrhosis by computerized morphometry. Mod Pathol 2002;15(8):798–806. [DOI] [PubMed] [Google Scholar]
- 28.Kage M, Shimamatu K, Nakashima E, Kojiro M, Inoue O, Yano M. Long-term evolution of fibrosis from chronic hepatitis to cirrhosis in patients with hepatitis C: morphometric analysis of repeated biopsies. Hepatology 1997;25(4):1028–31. [DOI] [PubMed] [Google Scholar]
- 29.Marcellin P, Ziol M, Bedossa P, Douvin C, Poupon R, de Lédinghen V, et al. Non-invasive assessment of liver fibrosis by stiffness measurement in patients with chronic hepatitis B. Liver Int 2009;29(2):242–7. [DOI] [PubMed] [Google Scholar]
- 30.Yano M, Kumada H, Kage M, Ikeda K, Shimamatsu K, Inoue O, et al. The long-term pathological evolution of chronic hepatitis C. Hepatology 1996;23(6):1334–40. [DOI] [PubMed] [Google Scholar]
- 31.Venkatesh SK, Ehman RL. Magnetic resonance elastography of liver. Magn Reson Imaging Clin N Am 2014;22(3):433–46. [DOI] [PMC free article] [PubMed] [Google Scholar]
- 32.Chang W, Lee JM, Yoon JH, Han JK, Choi BI, Lee KB, et al. Liver Fibrosis Staging with MR Elastography: Comparison of Diagnostic Performance between Patients with Chronic Hepatitis B and Those with Other Etiologic Causes. Radiology 2016;280(1):88–97. [DOI] [PubMed] [Google Scholar]
- 33.Yin M, Talwalkar JA, Glaser KJ, Manduca A, Grimm RC, Rossman PJ, et al. Assessment of hepatic fibrosis with magnetic resonance elastography. Clinical gastroenterology and hepatology : the official clinical practice journal of the American Gastroenterological Association 2007;5(10):1207–13.e2. [DOI] [PMC free article] [PubMed] [Google Scholar]
- 34.Manduca A, Oliphant TE, Dresner MA, Mahowald JL, Kruse SA, Amromin E, et al. Magnetic resonance elastography: non-invasive mapping of tissue elasticity. Med Image Anal 2001;5(4):237–54. [DOI] [PubMed] [Google Scholar]
- 35.Asbach P, Klatt D, Hamhaber U, Braun J, Somasundaram R, Hamm B, et al. Assessment of liver viscoelasticity using multifrequency MR elastography. Magnetic Resonance in Medicine 2008;60(2):373–9. [DOI] [PubMed] [Google Scholar]
- 36.Huwart L, Peeters F, Sinkus R, Annet L, Salameh N, ter Beek LC, et al. Liver fibrosis: non-invasive assessment with MR elastography. NMR in Biomedicine 2006;19(2):173–9. [DOI] [PubMed] [Google Scholar]
- 37.Muthupillai R, Lomas DJ, Rossman PJ, Greenleaf JF, Manduca A, Ehman RL. Magnetic resonance elastography by direct visualization of propagating acoustic strain waves. Science (New York, NY) 1995;269(5232):1854–7. [DOI] [PubMed] [Google Scholar]
- 38.Hines CD, Bley TA, Lindstrom MJ, Reeder SB. Repeatability of magnetic resonance elastography for quantification of hepatic stiffness. J Magn Reson Imaging 2010;31(3):725–31. [DOI] [PMC free article] [PubMed] [Google Scholar]
- 39.Shire NJ, Yin M, Chen J, Railkar RA, Fox-Bosetti S, Johnson SM, et al. Test-retest repeatability of MR elastography for noninvasive liver fibrosis assessment in hepatitis C. J Magn Reson Imaging 2011;34(4):947–55. [DOI] [PMC free article] [PubMed] [Google Scholar]
- 40.Venkatesh SK, Wang G, Teo LL, Ang BW. Magnetic resonance elastography of liver in healthy Asians: normal liver stiffness quantification and reproducibility assessment. J Magn Reson Imaging 2014;39(1):1–8. [DOI] [PubMed] [Google Scholar]
- 41.Lee Y, Lee JM, Lee JE, Lee KB, Lee ES, Yoon JH, et al. MR elastography for noninvasive assessment of hepatic fibrosis: reproducibility of the examination and reproducibility and repeatability of the liver stiffness value measurement. J Magn Reson Imaging 2014;39(2):326–31. [DOI] [PubMed] [Google Scholar]
- 42.Lee DH, Lee JM, Han JK, Choi BI. MR elastography of healthy liver parenchyma: Normal value and reliability of the liver stiffness value measurement. J Magn Reson Imaging 2013;38(5):1215–23. [DOI] [PubMed] [Google Scholar]
- 43.Cui J, Heba E, Hernandez C, Haufe W, Hooker J, Andre MP, et al. Magnetic resonance elastography is superior to acoustic radiation force impulse for the Diagnosis of fibrosis in patients with biopsy-proven nonalcoholic fatty liver disease: A prospective study. Hepatology 2016;63(2):453–61. [DOI] [PMC free article] [PubMed] [Google Scholar]
- 44.Yasar TK, Wagner M, Bane O, Besa C, Babb JS, Kannengiesser S, et al. Interplatform reproducibility of liver and spleen stiffness measured with MR elastography. J Magn Reson Imaging 2016;43(5):1064–72. [DOI] [PMC free article] [PubMed] [Google Scholar]
- 45.Trout AT, Serai S, Mahley AD, Wang H, Zhang Y, Zhang B, et al. Liver Stiffness Measurements with MR Elastography: Agreement and Repeatability across Imaging Systems, Field Strengths, and Pulse Sequences. Radiology 2016;281(3):793–804. [DOI] [PubMed] [Google Scholar]
- 46.Serai SD, Yin M, Wang H, Ehman RL, Podberesky DJ. Cross-vendor validation of liver magnetic resonance elastography. Abdom Imaging 2015;40(4):789–94. [DOI] [PMC free article] [PubMed] [Google Scholar]
- 47.Besa C, Wagner M, Lo G, Gordic S, Chatterji M, Kennedy P, et al. Detection of liver fibrosis using qualitative and quantitative MR elastography compared to liver surface nodularity measurement, gadoxetic acid uptake, and serum markers. J Magn Reson Imaging 2017. [DOI] [PubMed] [Google Scholar]
- 48.Chen J, Yin M, Talwalkar JA, Oudry J, Glaser KJ, Smyrk TC, et al. Diagnostic Performance of MR Elastography and Vibration-controlled Transient Elastography in the Detection of Hepatic Fibrosis in Patients with Severe to Morbid Obesity. Radiology 2017;283(2):418–28. [DOI] [PMC free article] [PubMed] [Google Scholar]
- 49.Marti-Bonmati L, Delgado F. MR imaging in liver cirrhosis: classical and new approaches. Insights into imaging 2010;1(4):233–44. [DOI] [PMC free article] [PubMed] [Google Scholar]
- 50.Bennett TD, Rothe CF. Hepatic capacitance responses to changes in flow and hepatic venous pressure in dogs. The American journal of physiology 1981;240(1):H18–28. [DOI] [PubMed] [Google Scholar]
- 51.Kim BH, Lee JM, Lee YJ, Lee KB, Suh KS, Han JK, et al. MR elastography for noninvasive assessment of hepatic fibrosis: experience from a tertiary center in Asia. J Magn Reson Imaging 2011;34(5):1110–6. [DOI] [PubMed] [Google Scholar]
- 52.Herzka DA, Kotys MS, Sinkus R, Pettigrew RI, Gharib AM. Magnetic resonance elastography in the liver at 3 Tesla using a second harmonic approach. Magnetic resonance in medicine 2009;62(2):284–91. [DOI] [PubMed] [Google Scholar]
- 53.Venkatesh SK, Wang G, Lim SG, Wee A. Magnetic resonance elastography for the detection and staging of liver fibrosis in chronic hepatitis B. Eur Radiol 2014;24(1):70–8. [DOI] [PubMed] [Google Scholar]
- 54.Huwart L, Peeters F, Sinkus R, Annet L, Salameh N, ter Beek LC, et al. Liver fibrosis: non-invasive assessment with MR elastography. NMR Biomed 2006;19(2):173–9. [DOI] [PubMed] [Google Scholar]
- 55.Huwart L, Sempoux C, Vicaut E, Salameh N, Annet L, Danse E, et al. Magnetic resonance elastography for the noninvasive staging of liver fibrosis. Gastroenterology 2008;135(1):32–40. [DOI] [PubMed] [Google Scholar]
- 56.Chen J, Talwalkar JA, Yin M, Glaser KJ, Sanderson SO, Ehman RL. Early detection of nonalcoholic steatohepatitis in patients with nonalcoholic fatty liver disease by using MR elastography. Radiology 2011;259(3):749–56. [DOI] [PMC free article] [PubMed] [Google Scholar]
- 57.Huwart L, Sempoux C, Salameh N, Jamart J, Annet L, Sinkus R, et al. Liver fibrosis: noninvasive assessment with MR elastography versus aspartate aminotransferase-to-platelet ratio index. Radiology 2007;245(2):458–66. [DOI] [PubMed] [Google Scholar]
- 58.Asbach P, Klatt D, Schlosser B, Biermer M, Muche M, Rieger A, et al. Viscoelasticity-based staging of hepatic fibrosis with multifrequency MR elastography. Radiology 2010;257(1):80–6. [DOI] [PubMed] [Google Scholar]
- 59.Venkatesh SK, Yin M, Takahashi N, Glockner JF, Talwalkar JA, Ehman RL. Non-invasive detection of liver fibrosis: MR imaging features vs. MR elastography. Abdom Imaging 2015;40(4):766–75. [DOI] [PMC free article] [PubMed] [Google Scholar]
- 60.Rustogi R, Horowitz J, Harmath C, Wang Y, Chalian H, Ganger DR, et al. Accuracy of MR elastography and anatomic MR imaging features in the diagnosis of severe hepatic fibrosis and cirrhosis. J Magn Reson Imaging 2012;35(6):1356–64. [DOI] [PMC free article] [PubMed] [Google Scholar]
- 61.Standish RA, Cholongitas E, Dhillon A, Burroughs AK, Dhillon AP. An appraisal of the histopathological assessment of liver fibrosis. Gut 2006;55(4):569–78. [DOI] [PMC free article] [PubMed] [Google Scholar]
- 62.Morisaka H, Motosugi U, Ichikawa S, Nakazawa T, Kondo T, Funayama S, et al. Magnetic resonance elastography is as accurate as liver biopsy for liver fibrosis staging. J Magn Reson Imaging 2018;47(5):1268–75. [DOI] [PubMed] [Google Scholar]
- 63.Myers RP, Crotty P, Pomier-Layrargues G, Ma M, Urbanski SJ, Elkashab M. Prevalence, risk factors and causes of discordance in fibrosis staging by transient elastography and liver biopsy. Liver Int 2010;30(10):1471–80. [DOI] [PubMed] [Google Scholar]
- 64.Ichikawa S, Motosugi U, Ichikawa T, Sano K, Morisaka H, Enomoto N, et al. Magnetic resonance elastography for staging liver fibrosis in chronic hepatitis C. Magn Reson Med Sci 2012;11(4):291–7. [DOI] [PubMed] [Google Scholar]
- 65.Bohte AE, van Dussen L, Akkerman EM, Nederveen AJ, Sinkus R, Jansen PLM, et al. Liver fibrosis in type I Gaucher disease: magnetic resonance imaging, transient elastography and parameters of iron storage. PLoS ONE 2013;8(3):e57507. [DOI] [PMC free article] [PubMed] [Google Scholar]
- 66.Bensamoun SF, Leclerc GE, Debernard L, Cheng X, Robert L, Charleux F, et al. Cutoff values for alcoholic liver fibrosis using magnetic resonance elastography technique. Alcohol Clin Exp Res 2013;37(5):811–7. [DOI] [PubMed] [Google Scholar]
- 67.Wang QB, Zhu H, Liu HL, Zhang B. Performance of magnetic resonance elastography and diffusion-weighted imaging for the staging of hepatic fibrosis: A meta-analysis. Hepatology (Baltimore, Md) 2012;56(1):239–47. [DOI] [PubMed] [Google Scholar]
- 68.Guo Y, Parthasarathy S, Goyal P, McCarthy RJ, Larson AC, Miller FH. Magnetic resonance elastography and acoustic radiation force impulse for staging hepatic fibrosis: a meta-analysis. Abdominal imaging 2015;40(4):818–34. [DOI] [PubMed] [Google Scholar]
- 69.Serai SD, Dillman JR, Trout AT. Spin-echo Echo-planar Imaging MR Elastography versus Gradient-echo MR Elastography for Assessment of Liver Stiffness in Children and Young Adults Suspected of Having Liver Disease. Radiology 2017;282(3):761–70. [DOI] [PubMed] [Google Scholar]
- 70.Joshi M, Dillman JR, Towbin AJ, Serai SD, Trout AT. MR elastography: high rate of technical success in pediatric and young adult patients. Pediatr Radiol 2017;47(7):838–43. [DOI] [PubMed] [Google Scholar]
- 71.Crespo S, Bridges M, Nakhleh R, McPhail A, Pungpapong S, Keaveny AP. Non-invasive assessment of liver fibrosis using magnetic resonance elastography in liver transplant recipients with hepatitis C. Clin Transplant 2013;27(5):652–8. [DOI] [PubMed] [Google Scholar]
- 72.Venkatesh SK, Yin M, Ehman RL. Magnetic resonance elastography of liver: technique, analysis, and clinical applications. J Magn Reson Imaging 2013;37(3):544–55. [DOI] [PMC free article] [PubMed] [Google Scholar]
- 73.Asrani SK, Talwalkar JA, Kamath PS, Shah VH, Saracino G, Jennings L, et al. Role of Magnetic Resonance Elastography in compensated and decompensated liver disease. Journal of hepatology 2014;60(5):934–9. [DOI] [PMC free article] [PubMed] [Google Scholar]
- 74.Standish RA, Cholongitas E, Dhillon A, Burroughs AK, Dhillon AP. An appraisal of the histopathological assessment of liver fibrosis. Gut 2006;55(4):569–78. [DOI] [PMC free article] [PubMed] [Google Scholar]
- 75.Friedman SL. Liver fibrosis -- from bench to bedside. J Hepatol 2003;38 Suppl 1:S38–53. [DOI] [PubMed] [Google Scholar]
- 76.Poynard T, Mathurin P, Lai CL, Guyader D, Poupon R, Tainturier MH, et al. A comparison of fibrosis progression in chronic liver diseases. J Hepatol 2003;38(3):257–65. [DOI] [PubMed] [Google Scholar]
- 77.Caballero T, Perez-Milena A, Masseroli M, O’Valle F, Salmeron FJ, Del Moral RM, et al. Liver fibrosis assessment with semiquantitative indexes and image analysis quantification in sustained-responder and non-responder interferon-treated patients with chronic hepatitis C. J Hepatol 2001;34(5):740–7. [DOI] [PubMed] [Google Scholar]
- 78.Sakaida I, Nagatomi A, Hironaka K, Uchida K, Okita K. Quantitative analysis of liver fibrosis and stellate cell changes in patients with chronic hepatitis C after interferon therapy. Am J Gastroenterol 1999;94(2):489–96. [DOI] [PubMed] [Google Scholar]
- 79.Duchatelle V, Marcellin P, Giostra E, Bregeaud L, Pouteau M, Boyer N, et al. Changes in liver fibrosis at the end of alpha interferon therapy and 6 to 18 months later in patients with chronic hepatitis C: quantitative assessment by a morphometric method. J Hepatol 1998;29(1):20–8. [DOI] [PubMed] [Google Scholar]
- 80.Friedman SL, Bansal MB. Reversal of hepatic fibrosis -- fact or fantasy? Hepatology (Baltimore, Md) 2006;43(2 Suppl 1):S82–8. [DOI] [PubMed] [Google Scholar]
- 81.Serai SD, Obuchowski NA, Venkatesh SK, Sirlin CB, Miller FH, Ashton E, et al. Repeatability of MR Elastography of Liver: A Meta-Analysis. Radiology 2017;285(1):92–100. [DOI] [PMC free article] [PubMed] [Google Scholar]
- 82.Takamura T, Motosugi U, Ichikawa S, Sano K, Morisaka H, Ichikawa T, et al. Usefulness of MR elastography for detecting clinical progression of cirrhosis from child-pugh class A to B in patients with type C viral hepatitis. J Magn Reson Imaging 2016;44(3):715–22. [DOI] [PubMed] [Google Scholar]
- 83.Younossi ZM, Koenig AB, Abdelatif D, Fazel Y, Henry L, Wymer M. Global epidemiology of nonalcoholic fatty liver disease-Meta-analytic assessment of prevalence, incidence, and outcomes. Hepatology (Baltimore, Md) 2016;64(1):73–84. [DOI] [PubMed] [Google Scholar]
- 84.Szczepaniak LS, Nurenberg P, Leonard D, Browning JD, Reingold JS, Grundy S, et al. Magnetic resonance spectroscopy to measure hepatic triglyceride content: prevalence of hepatic steatosis in the general population. American journal of physiology Endocrinology and metabolism 2005;288(2):E462–8. [DOI] [PubMed] [Google Scholar]
- 85.Lazo M, Clark JM. The epidemiology of nonalcoholic fatty liver disease: a global perspective. Seminars in liver disease 2008;28(4):339–50. [DOI] [PubMed] [Google Scholar]
- 86.Williams CD, Stengel J, Asike MI, Torres DM, Shaw J, Contreras M, et al. Prevalence of nonalcoholic fatty liver disease and nonalcoholic steatohepatitis among a largely middle-aged population utilizing ultrasound and liver biopsy: a prospective study. Gastroenterology 2011;140(1):124–31. [DOI] [PubMed] [Google Scholar]
- 87.Stal P Liver fibrosis in non-alcoholic fatty liver disease - diagnostic challenge with prognostic significance. World J Gastroenterol 2015;21(39):11077–87. [DOI] [PMC free article] [PubMed] [Google Scholar]
- 88.Vernon G, Baranova A, Younossi ZM. Systematic review: the epidemiology and natural history of non-alcoholic fatty liver disease and non-alcoholic steatohepatitis in adults. Alimentary pharmacology & therapeutics 2011;34(3):274–85. [DOI] [PubMed] [Google Scholar]
- 89.Chalasani N, Younossi Z, Lavine JE, Diehl AM, Brunt EM, Cusi K, et al. The diagnosis and management of non-alcoholic fatty liver disease: Practice Guideline by the American Association for the Study of Liver Diseases, American College of Gastroenterology, and the American Gastroenterological Association. Hepatology (Baltimore, Md) 2012;55(6):2005–23. [DOI] [PubMed] [Google Scholar]
- 90.Targher G, Day CP, Bonora E. Risk of cardiovascular disease in patients with nonalcoholic fatty liver disease. The New England journal of medicine 2010;363(14):1341–50. [DOI] [PubMed] [Google Scholar]
- 91.Anstee QM, Targher G, Day CP. Progression of NAFLD to diabetes mellitus, cardiovascular disease or cirrhosis. Nature reviews Gastroenterology & hepatology 2013;10(6):330–44. [DOI] [PubMed] [Google Scholar]
- 92.Ballestri S, Lonardo A, Bonapace S, Byrne CD, Loria P, Targher G. Risk of cardiovascular, cardiac and arrhythmic complications in patients with non-alcoholic fatty liver disease. World J Gastroenterol 2014;20(7):1724–45. [DOI] [PMC free article] [PubMed] [Google Scholar]
- 93.Pacifico L, Chiesa C, Anania C, De Merulis A, Osborn JF, Romaggioli S, et al. Nonalcoholic fatty liver disease and the heart in children and adolescents. World Journal of Gastroenterology : WJG 2014;20(27):9055–71. [DOI] [PMC free article] [PubMed] [Google Scholar]
- 94.Lautamaki R, Borra R, Iozzo P, Komu M, Lehtimaki T, Salmi M, et al. Liver steatosis coexists with myocardial insulin resistance and coronary dysfunction in patients with type 2 diabetes. American Journal of Physiology-Endocrinology and Metabolism 2006;291(2):E282–E90. [DOI] [PubMed] [Google Scholar]
- 95.Perseghin G, Lattuada G, De Cobelli F, Esposito A, Belloni E, Ntali G, et al. Increased mediastinal fat and impaired left ventricular energy metabolism in young men with newly found fatty liver. Hepatology (Baltimore, Md) 2008;47(1):51–8. [DOI] [PubMed] [Google Scholar]
- 96.Goland S, Shimoni S, Zornitzki T, Knobler H, Azoulai O, Lutaty G, et al. Cardiac abnormalities as a new manifestation of nonalcoholic fatty liver disease: echocardiographic and tissue Doppler imaging assessment. Journal of clinical gastroenterology 2006;40(10):949–55. [DOI] [PubMed] [Google Scholar]
- 97.Fotbolcu H, Yakar T, Duman D, Karaahmet T, Tigen K, Cevik C, et al. Impairment of the left ventricular systolic and diastolic function in patients with non-alcoholic fatty liver disease. Cardiology journal 2010;17(5):457–63. [PubMed] [Google Scholar]
- 98.Mantovani A, Zoppini G, Targher G, Golia G, Bonora E. Non-alcoholic fatty liver disease is independently associated with left ventricular hypertrophy in hypertensive Type 2 diabetic individuals. Journal of endocrinological investigation 2012;35(2):215–8. [DOI] [PubMed] [Google Scholar]
- 99.Hallsworth K, Hollingsworth KG, Thoma C, Jakovljevic D, MacGowan GA, Anstee QM, et al. Cardiac structure and function are altered in adults with non-alcoholic fatty liver disease. J Hepatol 2013;58(4):757–62. [DOI] [PubMed] [Google Scholar]
- 100.Pacifico L, Di Martino M, De Merulis A, Bezzi M, Osborn JF, Catalano C, et al. Left ventricular dysfunction in obese children and adolescents with nonalcoholic fatty liver disease. Hepatology (Baltimore, Md) 2014;59(2):461–70. [DOI] [PubMed] [Google Scholar]
- 101.Charlton MR, Burns JM, Pedersen RA, Watt KD, Heimbach JK, Dierkhising RA. Frequency and outcomes of liver transplantation for nonalcoholic steatohepatitis in the United States. Gastroenterology 2011;141(4):1249–53. [DOI] [PubMed] [Google Scholar]
- 102.Kemmer N, Neff GW, Franco E, Osman-Mohammed H, Leone J, Parkinson E, et al. Nonalcoholic fatty liver disease epidemic and its implications for liver transplantation. Transplantation 2013;96(10):860–2. [DOI] [PubMed] [Google Scholar]
- 103.Ekstedt M, Hagstrom H, Nasr P, Fredrikson M, Stal P, Kechagias S, et al. Fibrosis stage is the strongest predictor for disease-specific mortality in NAFLD after up to 33 years of follow-up. Hepatology (Baltimore, Md) 2015;61(5):1547–54. [DOI] [PubMed] [Google Scholar]
- 104.Younossi ZM, Stepanova M, Rafiq N, Makhlouf H, Younoszai Z, Agrawal R, et al. Pathologic criteria for nonalcoholic steatohepatitis: interprotocol agreement and ability to predict liver-related mortality. Hepatology (Baltimore, Md) 2011;53(6):1874–82. [DOI] [PubMed] [Google Scholar]
- 105.Ekstedt M, Franzen LE, Mathiesen UL, Kechagias S. Low clinical relevance of the nonalcoholic fatty liver disease activity score (NAS) in predicting fibrosis progression. Scandinavian journal of gastroenterology 2012;47(1):108–15. [DOI] [PubMed] [Google Scholar]
- 106.Wong VW, Wong GL, Choi PC, Chan AW, Li MK, Chan HY, et al. Disease progression of non-alcoholic fatty liver disease: a prospective study with paired liver biopsies at 3 years. Gut 2010;59(7):969–74. [DOI] [PubMed] [Google Scholar]
- 107.Chen J, Talwalkar JA, Yin M, Glaser KJ, Sanderson SO, Ehman RL. Early Detection of Nonalcoholic Steatohepatitis in Patients with Nonalcoholic Fatty Liver Disease by Using MR Elastography. Radiology 2011;259(3):749–56. [DOI] [PMC free article] [PubMed] [Google Scholar]
- 108.Loomba R, Wolfson T, Ang B, Hooker J, Behling C, Peterson M, et al. Magnetic resonance elastography predicts advanced fibrosis in patients with nonalcoholic fatty liver disease: a prospective study. Hepatology 2014;60(6):1920–8. [DOI] [PMC free article] [PubMed] [Google Scholar]
- 109.Park CC, Nguyen P, Hernandez C, Bettencourt R, Ramirez K, Fortney L, et al. Magnetic Resonance Elastography vs Transient Elastography in Detection of Fibrosis and Noninvasive Measurement of Steatosis in Patients With Biopsy-Proven Nonalcoholic Fatty Liver Disease. Gastroenterology 2017;152(3):598–607.e2. [DOI] [PMC free article] [PubMed] [Google Scholar]
- 110.Loomba R, Cui J, Wolfson T, Haufe W, Hooker J, Szeverenyi N, et al. Novel 3D Magnetic Resonance Elastography for the Noninvasive Diagnosis of Advanced Fibrosis in NAFLD: A Prospective Study. Am J Gastroenterol 2016;111(7):986–94. [DOI] [PMC free article] [PubMed] [Google Scholar]
- 111.Imajo K, Kessoku T, Honda Y, Tomeno W, Ogawa Y, Mawatari H, et al. Magnetic Resonance Imaging More Accurately Classifies Steatosis and Fibrosis in Patients With Nonalcoholic Fatty Liver Disease Than Transient Elastography. Gastroenterology 2016;150(3):626–37.e7. [DOI] [PubMed] [Google Scholar]
- 112.Kim D, Kim WR, Talwalkar JA, Kim HJ, Ehman RL. Advanced fibrosis in nonalcoholic fatty liver disease: noninvasive assessment with MR elastography. Radiology 2013;268(2):411–9. [DOI] [PMC free article] [PubMed] [Google Scholar]
- 113.Loomba R, Sirlin CB, Ang B, Bettencourt R, Jain R, Salotti J, et al. Ezetimibe for the treatment of nonalcoholic steatohepatitis: assessment by novel magnetic resonance imaging and magnetic resonance elastography in a randomized trial (MOZART trial). Hepatology 2015;61(4):1239–50. [DOI] [PMC free article] [PubMed] [Google Scholar]
- 114.Yin M, Glaser KJ, Manduca A, Mounajjed T, Malhi H, Simonetto DA, et al. Distinguishing between Hepatic Inflammation and Fibrosis with MR Elastography. Radiology 2017;284(3):694–705. [DOI] [PMC free article] [PubMed] [Google Scholar]
- 115.K V S. Clinical Applications of Liver Magnetic Resonance Elastography: Chronic Liver Disease. . In: Venkatesh S ER, editor. Magnetic Resonance Elastography New York, NY, Springer; (2014). p. 39–60. [Google Scholar]
- 116.Venkatesh SK, Chandan V, Roberts LR. Liver masses: a clinical, radiologic, and pathologic perspective. Clinical gastroenterology and hepatology : the official clinical practice journal of the American Gastroenterological Association 2014;12(9):1414–29. [DOI] [PMC free article] [PubMed] [Google Scholar]
- 117.Venkatesh SK, Yin M, Glockner JF, Takahashi N, Araoz PA, Talwalkar JA, et al. MR elastography of liver tumors: preliminary results. AJR Am J Roentgenol 2008;190(6):1534–40. [DOI] [PMC free article] [PubMed] [Google Scholar]
- 118.Goodman ZD. Neoplasms of the liver. Modern pathology : an official journal of the United States and Canadian Academy of Pathology, Inc 2007;20 Suppl 1:S49–60. [DOI] [PubMed] [Google Scholar]
- 119.Thompson SM, Wang J, Chandan VS, Glaser KJ, Roberts LR, Ehman RL, et al. MR elastography of hepatocellular carcinoma: Correlation of tumor stiffness with histopathology features-Preliminary findings. Magnetic resonance imaging 2017;37:41–5. [DOI] [PMC free article] [PubMed] [Google Scholar]
- 120.Li J, Jamin Y, Boult JKR, Cummings C, Waterton JC, Ulloa J, et al. Tumour biomechanical response to the vascular disrupting agent ZD6126 in vivo assessed by magnetic resonance elastography. British Journal Of Cancer 2014;110:1727. [DOI] [PMC free article] [PubMed] [Google Scholar]
- 121.Pepin KM, Chen J, Glaser KJ, Mariappan YK, Reuland B, Ziesmer S, et al. MR elastography derived shear stiffness--a new imaging biomarker for the assessment of early tumor response to chemotherapy. Magnetic resonance in medicine 2014;71(5):1834–40. [DOI] [PMC free article] [PubMed] [Google Scholar]
- 122.Gordic S, Ayache JB, Kennedy P, Besa C, Wagner M, Bane O, et al. Value of Tumor Stiffness Measured with MR Elastography for Assessment of Response of Hepatocellular Carcinoma to Locoregional Therapy. Abdominal radiology (New York) 2017;42(6):1685–94. [DOI] [PMC free article] [PubMed] [Google Scholar]
- 123.Mariappan YK, Venkatesh SK, Glaser JK, McGee KP, Ehman RL, editors. MR Elastography of liver with iron overload: development, evaluation and preliminary clinical experience with improved spin echo and spin echo EPI sequences. The 21st Annual Conference of International Society for Magnetic Resonance in Medicine; 2013; Salt Lake City, Utah. [Google Scholar]
- 124.Venkatesh SK, Xu S, Tai D, Yu H, Wee A. Correlation of MR elastography with morphometric quantification of liver fibrosis (Fibro-C-Index) in chronic hepatitis B. Magn Reson Med 2013. [DOI] [PubMed] [Google Scholar]
- 125.Fenstad ER, Dzyubak B, Oh JK, Williamson EE, F Glockner J, Young PM, et al. Evaluation of liver stiffness with magnetic resonance elastography in patients with constrictive pericarditis: Preliminary findings. J Magn Reson Imaging 2016;44(1):81–8. [DOI] [PMC free article] [PubMed] [Google Scholar]
- 126.Kim DK, Choi JY, Park MS, Kim MJ, Chung YE. Clinical Feasibility of MR Elastography in Patients With Biliary Obstruction. AJR Am J Roentgenol 2018;210(6):1273–8. [DOI] [PubMed] [Google Scholar]
- 127.Venkatesh SK, Wells ML, Miller FH, Jhaveri KS, Silva AC, Taouli B, et al. Magnetic resonance elastography: beyond liver fibrosis-a case-based pictorial review. Abdom Radiol (NY) 2017. [DOI] [PMC free article] [PubMed] [Google Scholar]
- 128.Wang K, Manning P, Szeverenyi N, Wolfson T, Hamilton G, Middleton MS, et al. Repeatability and reproducibility of 2D and 3D hepatic MR elastography with rigid and flexible drivers at end-expiration and end-inspiration in healthy volunteers. Abdom Radiol (NY) 2017;42(12):2843–54. [DOI] [PMC free article] [PubMed] [Google Scholar]
- 129.Papazoglou S, Hirsch S, Braun J, Sack I. Multifrequency inversion in magnetic resonance elastography. Phys Med Biol 2012;57(8):2329–46. [DOI] [PubMed] [Google Scholar]
- 130.Barnhill E, Hollis L, Sack I, Braun J, Hoskins PR, Pankaj P, et al. Nonlinear multiscale regularisation in MR elastography: Towards fine feature mapping. Med Image Anal 2017;35:133–45. [DOI] [PubMed] [Google Scholar]
- 131.Morisaka H, Motosugi U, Glaser KJ, Ichikawa S, Ehman RL, Sano K, et al. Comparison of diagnostic accuracies of two- and three-dimensional MR elastography of the liver. J Magn Reson Imaging 2017;45(4):1163–70. [DOI] [PMC free article] [PubMed] [Google Scholar]
- 132.Tzschatzsch H, Guo J, Dittmann F, Hirsch S, Barnhill E, Johrens K, et al. Tomoelastography by multifrequency wave number recovery from time-harmonic propagating shear waves. Med Image Anal 2016;30:1–10. [DOI] [PubMed] [Google Scholar]
- 133.Gomori JM, Horev G, Tamary H, Zandback J, Kornreich L, Zaizov R, et al. Hepatic iron overload: quantitative MR imaging. Radiology 1991;179(2):367–9. [DOI] [PubMed] [Google Scholar]
- 134.Westphalen AC, Qayyum A, Yeh BM, Merriman RB, Lee JA, Lamba A, et al. Liver fat: effect of hepatic iron deposition on evaluation with opposed-phase MR imaging. Radiology 2007;242(2):450–5. [DOI] [PubMed] [Google Scholar]
- 135.Queiroz-Andrade M, Blasbalg R, Ortega CD, Rodstein MAM, Baroni RH, Rocha MS, et al. MR Imaging Findings of Iron Overload. RadioGraphics 2009;29(6):1575–89. [DOI] [PubMed] [Google Scholar]
- 136.Ernst O, Sergent G, Bonvarlet P, Canva-Delcambre V, Paris JC, L’Herminé C. Hepatic iron overload: diagnosis and quantification with MR imaging. American Journal of Roentgenology 1997;168(5):1205–8. [DOI] [PubMed] [Google Scholar]
- 137.Wagner M, Besa C, Bou Ayache J, Yasar TK, Bane O, Fung M, et al. Magnetic Resonance Elastography of the Liver: Qualitative and Quantitative Comparison of Gradient Echo and Spin Echo Echoplanar Imaging Sequences. Investigative radiology 2016;51(9):575–81. [DOI] [PMC free article] [PubMed] [Google Scholar]
- 138.Serai SD, Dillman JR, Trout AT. Spin-echo Echo-planar Imaging MR Elastography versus Gradient-echo MR Elastography for Assessment of Liver Stiffness in Children and Young Adults Suspected of Having Liver Disease. Radiology 2016;282(3):761–70. [DOI] [PubMed] [Google Scholar]
- 139.Wang J, Glaser KJ, Zhang T, Shan Q, He B, Chen J, et al. Assessment of advanced hepatic MR elastography methods for susceptibility artifact suppression in clinical patients. J Magn Reson Imaging 2018;47(4):976–87. [DOI] [PMC free article] [PubMed] [Google Scholar]
- 140.Kim YS, Jang YN, Song JS. Comparison of gradient-recalled echo and spin-echo echo-planar imaging MR elastography in staging liver fibrosis: a meta-analysis. Eur Radiol 2018;28(4):1709–18. [DOI] [PubMed] [Google Scholar]
- 141.Yoshimitsu K, Shinagawa Y, Mitsufuji T, Mutoh E, Urakawa H, Sakamoto K, et al. Preliminary Comparison of Multi-scale and Multi-model Direct Inversion Algorithms for 3T MR Elastography. Magn Reson Med Sci 2017;16(1):73–7. [DOI] [PMC free article] [PubMed] [Google Scholar]
- 142.Dzyubak B, Venkatesh S, Manduca A, Glaser K, Ehman RL. Automated Liver Elasticity Calculation for Magnetic Resonance Elastography. Journal of magnetic resonance imaging : JMRI 2016;43(5):1055–63. [DOI] [PMC free article] [PubMed] [Google Scholar]
- 143.Eaton JE, Dzyubak B, Venkatesh SK, Smyrk TC, Gores GJ, Ehman RL, et al. Performance of magnetic resonance elastography in primary sclerosing cholangitis. J Gastroenterol Hepatol 2016;31(6):1184–90. [DOI] [PMC free article] [PubMed] [Google Scholar]
- 144.Murphy MC, Manduca A, Trzasko JD, Glaser KJ, Huston J, Ehman RL. Artificial neural networks for stiffness estimation in magnetic resonance elastography. Magn Reson Med 2018;80(1):351–60. [DOI] [PMC free article] [PubMed] [Google Scholar]
- 145.Talwalkar JA, Yin M, Venkatesh S, Rossman PJ, Grimm RC, Manduca A, et al. Feasibility of in vivo MR elastographic splenic stiffness measurements in the assessment of portal hypertension. AJR Am J Roentgenol 2009;193(1):122–7. [DOI] [PMC free article] [PubMed] [Google Scholar]
- 146.Abe H, Midorikawa Y, Mitsuka Y, Aramaki O, Higaki T, Matsumoto N, et al. Predicting postoperative outcomes of liver resection by magnetic resonance elastography. Surgery 2017;162(2):248–55. [DOI] [PubMed] [Google Scholar]
- 147.Ichikawa S, Motosugi U, Oguri M, Onishi H. Magnetic resonance elastography for prediction of radiation-induced liver disease after stereotactic body radiation therapy. Hepatology 2017;66(2):664–5. [DOI] [PubMed] [Google Scholar]
- 148.Yin M, Glaser KJ, Talwalkar JA, Chen J, Manduca A, Ehman RL. Hepatic MR Elastography: Clinical Performance in a Series of 1377 Consecutive Examinations. Radiology 2016;278(1):114–24. [DOI] [PMC free article] [PubMed] [Google Scholar]
- 149.Brunt EM, Kleiner DE, Wilson LA, Belt P, Neuschwander-Tetri BA, (CRN) NCRN. Nonalcoholic fatty liver disease (NAFLD) activity score and the histopathologic diagnosis in NAFLD: distinct clinicopathologic meanings. Hepatology 2011;53(3):810–20. [DOI] [PMC free article] [PubMed] [Google Scholar]
- 150.Kleiner DE, Brunt EM, Van Natta M, Behling C, Contos MJ, Cummings OW, et al. Design and validation of a histological scoring system for nonalcoholic fatty liver disease. Hepatology 2005;41(6):1313–21. [DOI] [PubMed] [Google Scholar]