Abstract
Population studies of brain function with resting‐state functional magnetic resonance imaging (rs‐fMRI) rely on accurate intersubject registration of functional areas. This is typically achieved through registration using high‐resolution structural images with more spatial details and better tissue contrast. However, accumulating evidence has suggested that such strategy cannot align functional regions well because functional areas are not necessarily consistent with anatomical structures. To alleviate this problem, a number of registration algorithms based directly on rs‐fMRI data have been developed, most of which utilize functional connectivity (FC) features for registration. However, most of these methods usually extract functional features only from the thin and highly curved cortical grey matter (GM), posing great challenges to accurate estimation of whole‐brain deformation fields. In this article, we demonstrate that additional useful functional features can also be extracted from the whole brain, not restricted to the GM, particularly the white‐matter (WM), for improving the overall functional registration. Specifically, we quantify local anisotropic correlation patterns of the blood oxygenation level‐dependent (BOLD) signals using tissue‐specific patch‐based functional correlation tensors (ts‐PFCTs) in both GM and WM. Functional registration is then performed by integrating the features from different tissues using the multi‐channel large deformation diffeomorphic metric mapping (mLDDMM) algorithm. Experimental results show that our method achieves superior functional registration performance, compared with conventional registration methods.
Keywords: functional correlation tensors, registration, resting‐state fMRI
1. INTRODUCTION
Functional magnetic resonance imaging (fMRI) is a popular noninvasive brain functional imaging technique that can indirectly characterize neural activities by detecting blood‐oxygen‐level dependent (BOLD) signal changes (Ogawa, Lee, Kay, & Tank, 1990). A significant amount of effort is currently focused on understanding how brain subsystems interact and communicate with each other (van den Heuvel and Pol, 2010). In resting‐state fMRI (rs‐fMRI) studies, this is typically done by determining the functional connectivity of different brain regions by evaluating temporal correlations of their BOLD signals (Biswal, Yetkin, Haughton, & Hyde, 1995; Greicius, Krasnow, Reiss, & Menon, 2003; Raichle and Snyder, 2007). This approach is useful for exploring the distinct patterns of synchronous brain activity when the brain is at rest (Wang et al., 2015). Furthermore, differences in resting‐state networks between healthy and patient cohorts have been regarded as potential biomarkers that could be valuable for clinical studies (Filippini et al., 2009; Greicius, Srivastava, Reiss, & Menon, 2004).
Accurate intersubject registration is a key to improve the statistical power in group comparison using rs‐fMRI data. Typically, intersubject registration of rs‐fMRI is often achieved through structural alignment with the help of the corresponding T1‐weighted MR images (Ashburner and Friston, 2005), the tissue probability maps obtained by segmentation (Ashburner, 2007) or more sophisticated diffeomorphic mapping (Xue et al., 2004, 2006a, 2006b; Xue et al., 2006c). However, recent studies (Cetin et al., 2015; Conroy, Singer, Haxby, & Ramadge, 2009; Conroy, Singer, Guntupalli, Ramadge, & Haxby, 2013; Jiang, Du, Cheng, Jiang, & Fan, 2013; Khullar et al., 2011; Langs, Tie, Rigolo, Golby, & Golland, 2010; Sabuncu et al., 2010) have demonstrated that structural alignment does not necessarily ensure functional alignment, since functional regions are not confined by anatomical boundaries. Recently, attempts have been made to directly employ fMRI data for functional registration (Cetin et al., 2015; Conroy et al., 2009, 2013; Jiang et al., 2013; Khullar et al., 2011; Langs et al., 2010; Sabuncu et al., 2010). For task‐related fMRI, functional registration can be achieved by maximizing the task‐specific BOLD signal correlation across subjects (Sabuncu et al., 2010). However, this approach cannot be applied to rs‐fMRI due to the lack of task‐related activation (Cole, Smith, & Beckmann, 2010). In Conroy et al. (2009), Conroy et al. (2013), Jiang et al. (2013), and Langs et al. (2010), functional alignment is performed with the help of functional connectivity (FC) computed as Pearson's correlation coefficient between the functional MRI time series of a pair of voxels. FC‐based registration can be divided into two categories: (a) long‐range FC, which is based on the FC for each pair of cortical nodes (Conroy et al., 2009, 2013), and (b) short‐range FC, which is based on FC in local neighborhoods. Short‐range FC registration (Jiang et al., 2013) has been shown to improve the alignment of cortical grey matter (GM). Connectivity features extracted via spectral embedding was proposed in (Langs et al., 2010; Nenning et al., 2017). Robinson et al. (2014) introduced a flexible framework for multi‐modal surface matching, which also offers the possibility of incorporating functional features. However, all the above methods focus only on voxels in the thin and highly curved cortical GM, posing challenges in estimating whole‐brain deformations. Specially, this can potentially cause significant registration errors in white matter (WM), which will in turn affect the registration of cortical GM.
To improve registration, a natural solution is to consider functional information not only in GM regions but also in WM regions. Neuroimaging studies typically consider WM as unaffected by metabolic states. However, culminating evidence has demonstrated the existence of WM BOLD signals (Ding et al., 2013, 2016; Gawryluk, Mazerolle, & D'Arcy, 2014; Greicius, Supekar, Menon, & Dougherty, 2009; Honey et al., 2009; Marussich, Lu, Wen, & Liu, 2017; Mazerolle et al., 2010; Quigley et al., 2003; van den Heuvel and Pol, 2010; Weber, Fouad, Burger, & Buck, 2002). For example, fMRI activation was observed in the corpus callosum during interhemispheric transfer tasks (Mazerolle et al., 2010; Quigley et al., 2003) and in internal capsule during a swallowing task (Mosier, Liu, Maldjian, Shah, & Modi, 1999) and a finger‐tapping task (Gawryluk, Mazerolle, Brewer, Beyea, & D'Arcy, 2011). This arises from the fact that information transfer in WM involves energy generated via glucose metabolism, which is tightly coupled with regional cerebral blood flow (CBF) (Weber et al., 2002). However, WM BOLD signal has lower signal‐to‐noise ratio (SNR) than GM, that is, by a factor of around one‐fourth. Furthermore, it is challenging to extract valuable functional information from the WM in the absence of task‐evoked activation and in the unconstrained state typically in the rs‐fMRI studies. It has been suggested that, compared with long‐range FC (Mazerolle et al., 2010; Quigley et al., 2003), short‐range or local FC in the WM is more robust due to substantially reduced signal‐to‐noise ratio (SNR) of the WM BOLD signals. More importantly, recent works have proposed an effective way to measure and extract such local WM functional information via functional correlation tensors (FCTs) (Ding et al., 2013, 2016), which is computed by considering the FC between each voxel and its adjacent voxels (Ding et al., 2013, 2016). Interestingly, the directions of the FCTs were found to be consistent with the underlying WM fiber orientations (Ding et al., 2016). Several studies have provided additional support for the functional character of WM BOLD signal. For example, Wu et al. (2017) demonstrated that BOLD signal in WM is detectable and is correlated with neural activities. In Marussich et al. (2017), independent component analysis (ICA) and hierarchical clustering were used to demonstrate the existence of clusters of correlated activity within the WM. They reported that connectivity changes occurred when subjects passively watched movies compared with resting state in WM clusters in the occipital lobe. A recently published study (Peer, Nitzan, Bick, Levin, & Arzy, 2017) demonstrated that WM manifested intrinsic functional organization as interacting networks of functional modules, similar to GM.
In this article, we propose a novel functional registration algorithm that utilizes functional information from both GM and WM. The contribution of this article is threefold. First, we introduce noise‐robust patch‐based FCTs (PFCTs) for quantifying local functional correlation. Second, we extend PFCTs to tissue‐specific PFCTs (ts‐PFCTs) to adapt to the different characteristics of BOLD signals in GM and WM. Third, a multi‐channel Large Deformation Diffeomorphic Metric Mapping algorithm (mLDDMM) (Zhang, Niethammer, Shen, & Yap, 2014) is employed to utilize the complementary information provided by ts‐PFCTs for accurate registration. Experimental results indicate that, compared with traditional methods, our method improves statistical power in group analysis of various brain functional networks. Importantly, although this paper focuses on registration of rs‐fMRI data, our method can be easily applied to task‐related fMRI‐based functional registration, making our method more powerful towards better understanding of human brain function. The code for ts‐PFCTs construction can be obtained via https://github.com/zyjshmily/ts-PFCTs.
2. MATERIALS AND METHODS
2.1. Method overview
Our goal is to achieve functional alignment of rs‐fMRI data using ts‐PFCT features with mLDDMM. The proposed registration algorithm consists of two components: (1) Feature extraction—Construction of ts‐PFCTs in a patch‐based manner with separate characterizations of functional correlation in GM and WM. We first introduce the definition of FCTs in Section 2.2.1 and then extend it to PFCTs in Section 2.2.2. (2) Intersubject registration—Estimation of the deformation field based on ts‐PFCTs using mLDDMM (Section 2.3). Figure 1 gives an overview of our proposed method.
Figure 1.
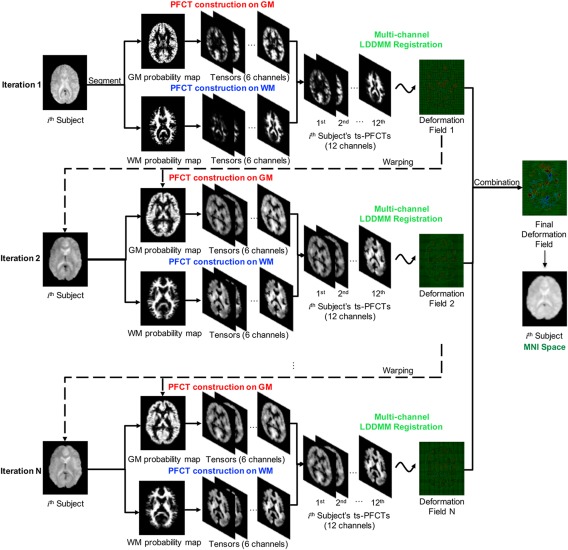
Overview of our proposed method [Color figure can be viewed at http://wileyonlinelibrary.com]
2.2. Tissue‐specific patch‐based functional correlation tensors (PFCTs)
2.2.1. Functional correlation tensors (FCTs)
FC is defined as the temporal synchronization of the rs‐fMRI BOLD signals of two brain voxels or regions. GM FC has been employed for registration of rs‐fMRI data in a number of studies (Conroy et al., 2009, 2013; Jiang et al., 2013; Langs et al., 2010), but WM FC is often neglected. We use the anisotropic short‐range FC, characterized by PFCTs of both GM and WM tissues, for registration. As shown in (Ding et al., 2013, 2016), functional tasks cause changes in the FCTs, suggesting the BOLD effects may be driven by neural activities along fiber tracts. In the following, we first introduce the original FCT formulation and then show how it can be extended using a patch‐based approach for multiple tissue types.
Local FC pattern: The FC between a voxel and its neighboring voxels can vary anisotropically. Figure 2a shows the 2D example, where the local FC values from a voxel to its eight neighboring voxels (1∼8) are different. We can define a directional vector pointing from a central voxel to each of its neighboring voxels. The length of each vector is modulated by the FC strength, computed as the Pearson's correlation of the time series between the central voxel and its neighboring voxel (Figure 2b). In above manner, we can calculate pair‐wise FCs between the rs‐fMRI signal in voxel and those in its eight neighboring voxels one by one, with the highly correlated rs‐fMRI time series corresponding to longer directional vectors, and vice versa. In this way, as shown in Figure 2a, eight directional vectors may have their respective lengths, which could generate a specific local FC pattern.
Figure 2.
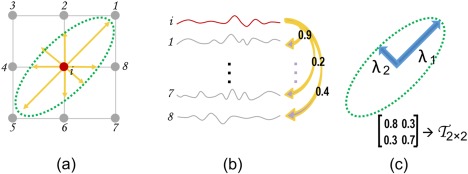
A 2D example of FCT: (a) directional vectors pointing from a voxel i to its eight neighboring voxels 1–8; (b) time‐series corresponding to all voxels shown in (a); (c) local FC pattern represented by a 2D tensor [Color figure can be viewed at http://wileyonlinelibrary.com]
Functional correlation tensor (FCT): To represent the local FC pattern in 2D, a symmetric tensor with three free parameters can be adopted (Figure 2c). The shape of this tensor is determined by the two major axes and . On the other hand, for the real fMRI data residing in 3D space, the local FC pattern is represented using a 3D tensor, which is a 3 × 3 symmetric matrix corresponding to an ellipsoid with three orthogonal axes. The FCT for voxel is expressed as follows:
| (1) |
Each of the diagonal elements represents the functional correlation along respective spatial dimension. The six off‐diagonal terms reflect the correlations between dimensions. is the absolute value of Pearson's correlation coefficient between the corresponding times series of voxel and that of its neighboring voxel . is the dyadic tensor representing the directional vector (Basser and Pajevic, 2000):
| (2) |
2.2.2. Tissue‐specific patch‐based functional correlation tensors (ts‐PFCTs)
Considering that the SNR of the BOLD signal in WM is much lower, we use the following two strategies to estimate FC anisotropy more robustly.
Patch‐based strategy: In practice, imaging noise and physiological artifacts may affect FC computation. For greater robustness to noise, we use a patch‐based strategy to compute FC. The correlation of the BOLD time series of each voxel in a 3D patch is computed with respect to the corresponding voxel in another patch (e.g., the upper left corner voxel in patch A with other upper left corner voxel in the neighboring patch B). For example, for a patch of size of 3 × 3 × 3 (Figure 3a), we have 27 correlation coefficients in relation to another patch. The patch‐based FC is then calculated by averaging these 27 correlation values (see in Figure 3b). The directional vector for the is from the center of patch i to the center of neighboring patch j (see the green arrow in Figure 3a). The corresponding tensor computed using patches is called the patch‐based FCT (PFCT).
Figure 3.
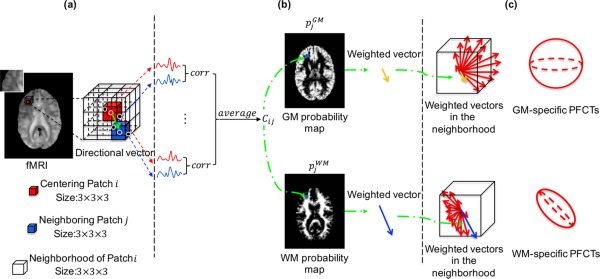
Computation of ts‐PFCTs at GM–WM interface: (a) patch‐based directional vector definition; (b) patch‐based FC and tissue probabilities for directional vector; (c) ts‐PFCT construction [Color figure can be viewed at http://wileyonlinelibrary.com]
Tissue‐specific strategy: FCT was calculated in (Ding et al., 2013, 2016) without consideration of tissue types, despite the fact that the oxygen consumption and blood flow in WM are approximately 4 times lower than in GM. When applying univariate or multivariate time‐series analyses to GM and WM voxels together, signal variance and structure are dominated by voxels in GM, whereas activity and connectivity patterns in WM are likely under‐detected or mistaken as noise. To avoid this issue, the tissue probability maps are employed to tease apart the contributions of GM and WM in computing PFCTs. For voxel and its neighboring voxel , represents the probability of voxel belonging to tissue type *, that is, for GM or for WM (Figure 3b). These probability maps can be obtained via tissue segmentation of co‐registered T1 MR images.
Finally, we construct the ts‐PFCTs on voxel i by weighting the dyadic tensor with the patch‐based FC and tissue‐specific probability (Figure 3c). Of note, this computation is mathematically similar to the diffusion tensor construction based on diffusion weighted MRI, with the directional vectors similar to the directions of the diffusion‐encoding gradients, and also the product of the patch‐based FC and tissue probability similar to the diffusion weight to each gradient. The ts‐PFCT calculation for voxel i can be rewritten as
| (3) |
Figure 3 shows an example of ts‐PFCT at the GM‐WM interface. Here, FC of the 3D patch centered at voxel (red) is computed with respect to the patch centered at voxel (blue) with the time series shown, respectively, in red and blue curves. The Pearson's correlation coefficients are weighted by the tissue probabilities , respectively. Note that the shape and direction of the two PFCTs are significantly different (Figure 3c).
2.3. Multi‐channel LDDMM (mLDDMM) registration
GM and WM FC features are used for multi‐channel registration: 6 channels using the 6 free parameters of the GM PFCTs and another 6 channels using the 6 free parameters of the WM PFCTs . Given a 12‐channel feature map as the reference and another one as the source, our goal is to determine a reasonably smooth deformation field that minimizes the differences between and by minimizing the energy functional (Zhang et al., 2014):
| (4) |
where measures the similarity between and . Here, is the source image warped with the displacements . is the regularization term, where multi‐Gaussian kernels are used to achieve the desired smoothness and the diffeomorphic deformation field in (Zhang et al., 2014). is the tuning parameter that balances the similarity term and the regularization term .
We construct a ts‐PFCT template in the Montreal Neurological Institute (MNI) space. First, the mean rs‐fMRI image of each subject is warped to the EPI template in the MNI space using a standard SPM‐based spatial registration algorithm (with both affine and nonlinear transformations). With the above deformation fields estimated from traditional structural‐based method, the ts‐PFCT fields of the subjects are warped to the MNI space. The ts‐PFCTs in MNI spaces are then averaged to produce an initial template of the 12 ts‐PFCT feature maps. Of note, here we use the traditional registration only aiming to generate a ts‐PFCT template. With the source ts‐PFCTs for each subject and the above reference, we can register all fMRI data to a common space as described in Figure 1. We assume that the directions of the ts‐PFCTs remain relatively unchanged in a small number of LDDMM iterations (n = 10), and update ts‐PFCTs when n iterations are completed:
Run LDDMM for n iterations;
Warp rs‐fMRI time series using the resulting deformation field and recompute the ts‐PFCTs for each subject and the ts‐PFCTs template;
Repeat the above steps N times.
Setting N = 4 is found to be sufficient for convergence. In this way, tensors can be gradually reoriented and updated during the registration.
3. EXPERIMENTS AND RESULTS
3.1. Materials and data preprocessing
Three different datasets were used for our experiments. (a) The rs‐fMRI data of 20 healthy subjects (8M/12F) were obtained from the New York dataset B.1 Each rs‐fMRI data has 175 frames with repetition time (TR) =2s. (b) In addition, we used eye open (EO) t‐fMRI data to evaluate the accuracy of registration based on eye close (EC) rs‐fMRI data. The ECEO data of 48 college students (aged 19–31 years, 24M/24F) can be accessed at 1000 Functional Connectomes Projects (Beijing: Eyes open Eyes Closed Study2). The functional images were obtained by using an echo‐planar imaging sequence with the following parameters: 33 axial slices, in‐plane resolution = 64 × 64, TR = 2s. Each condition consists of 240 functional volumes. (c) Finally, the ADNI dataset,3 which was launched in 2003 aiming at measuring the progression of mild cognitive impairment (MCI) and early Alzheimer's disease (AD), is also used to demonstrate the quality and the ability of different registration methods in differentiating eMCI and normal control (NC). In particular, we used the data of 36 eMCI subjects and 38 NCs, which were both age‐ and gender‐matched (the subjects with overall head motion larger than 2 mm or 2° during scanning were discarded). All three datasets were preprocessed according to the conventional pipeline using the DPARSF package.4 Preprocessing includes slice timing correction, head motion correction, band‐pass filtering of 0.01–0.1 Hz, and affine registration to the MNI space guided by the co‐registered T1 MR images. Finally, the data were resampled to 3 × 3 × 3 mm3. For accurate feature extraction, head motion regression for rs‐fMRI data was performed using the Friston 24‐Parameter Model. WM signal regression was not performed since the WM signal will be used for ts‐PFCT computation. Spatial smoothing was not applied (Jiang et al., 2013).
The experiments were conducted on a MacBook Pro with i7 CPU operating at 2.7 GHz with 16 GB RAM. Registration of each subject using the proposed method takes about 30 min. For SPM_EPI and SPM_T1, the registration can be done within 1 min. For SPM_TPM and DARTEL, the registration takes a little bit longer, that is, about 3 and 17 min, respectively, due to the segmentation of T1 MR images.
3.2. Validation
3.2.1. Resting‐state fMRI
To demonstrate the effectiveness of our method, we compared it with three commonly used registration techniques that are implemented in SPM85:
Registration based on the mean rs‐fMRI image to an EPI template (SPM_EPI) (Ashburner, 2007);
Registration based on T1 MR images to a T1 MRI template (SPM_T1) (Ashburner, 2007);
Registration based on the tissue probability maps derived from T1 MR image segmentation (SPM_TPM) (Ashburner and Friston, 2005).
In addition to the above three methods, we also compare our result with a recently proposed functional registration method that uses only the GM local FC (Jiang et al., 2013), which represents the state of the art methods. To facilitate the comparison, we used the same dataset as that used in (Jiang et al., 2013).
As there is no gold standard for direct evaluation of the functional registration performance, the group‐level statistical maps of resting‐state brain functional networks are used as surrogates for validation. Four common networks, including default mode network (DMN), visual network (VN), sensorimotor network (SM), and central executive network (CEN), were used for evaluation. They were obtained via group independent component analysis (ICA) decomposition using GIFT toolbox (Jiang et al., 2013). Particularly, group ICA was applied to the rs‐fMRI data of the 20 subjects, generating 20 independent components. ICA was performed for 100 times, each with different initial value using ICASSO. Before ICA, two‐stage principal component analysis (PCA) data dimensionality reduction was conducted with 30 principal components preserved in the first stage and 20 in the second stage. After group ICA, back reconstruction was used to restore each subject's individual components. The four networks were identified by calculating the correlation of 20 components with the corresponding network template in (Smith et al., 2009). One sample t test was conducted for each network to generate group‐level t maps. Alternatively, the brain networks can be obtained using a seed‐based approach. The results, included in Supporting Information, indicate that the conclusions similar to the ICA‐based analysis can be obtained.
Metrics similar to those in (Jiang et al., 2013) were used for evaluating the intersubject functional consistency given by the different fMRI registration algorithms:
Peak values of t maps and the total number of suprathreshold voxels: Voxel‐wise one sample t test was applied to four networks across all 20 subjects. Higher t value indicates higher functional consistency. Given a threshold, binary maps of supra‐threshold voxels can also be obtained.
Spatial overlap between subject‐specific networks and group networks: After transforming t map to z map, subject‐specific networks and group networks are obtained (by averaging binary maps of all subjects). A number of binary maps are obtained via thresholding. The overlap between each subject‐specific binary map and the group binary map is computed using the Dice score.
Intersubject component correlation: The correlation (0–1) of specific networks is evaluated across subjects.
3.2.2. Task fMRI
The parameters of rigid‐body realignment of each EC subject in to the EPI template were first estimated and then applied on both EC and EO datasets. Nonlinear registration was then performed using SPM_EPI, SPM_T1, SPM_TPM, and our proposed method.
To assess the alignment of functionally homologous regions, we employed two widely used rs‐fMRI metrics: (a) regional homogeneity (ReHo; Zang, Jiang, Lu, He, & Tian, 2004) and (b) amplitude of low‐frequency fluctuation ALFF (Zou et al., 2008).
3.2.3. eMCI‐NC classifications
The eMCI‐NC classification was performed according to the classification pipeline6 described in Qiao et al. (2016). For each subject, the mean rs‐fMRI signals extracted from 90 ROIs defined by the Automated Anatomical Labeling (AAL) template (Tzourio‐Mazoyer et al., 2002) were utilized to construct brain functional networks using Pearson's Correlation. For feature selection, we used a two‐sample t test (p < .01) to select features that discriminate eMCI and NC subjects in the training data. The same set of features was selected for the testing data. After feature selection, we employ a linear SVM (Chang and Lin, 2011), with the default cost parameter c = 1, for classification. A leave‐one‐out cross‐validation (LOOCV) strategy is adopted to verify the classification performance.
3.3. Experimental results
3.3.1. Evaluation based on rs‐fMRI
Part I. Comparison with conventional registration methods
-
Peak values of t maps and the total number of suprathreshold voxels
Figure 4 shows the group‐level t maps of the DMN, VN, SM, and CEN with t > 2.539 (p < .01, uncorrected) using four different registration methods. Significant improvement can be observed from the maximum t values for all the four networks.
Figure 4.
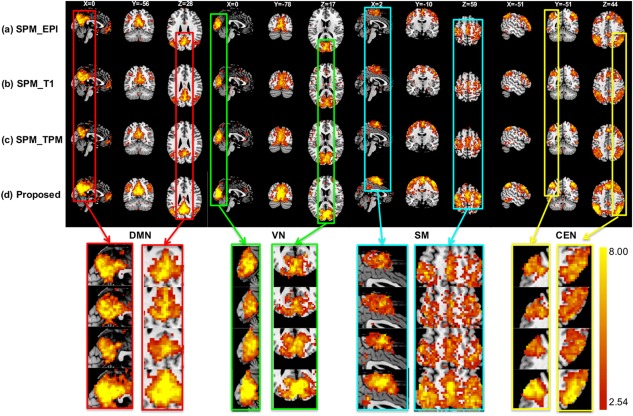 The group t maps of four networks with t > 2.54 (p < .01) after registration by (a) SPM using the mean image of fMRI, (b) SPM using tissue probability maps, (c) SPM using T1 MR images, and (d) our proposed method. The threshold is set to t > 2.54 (p < .01). Zoom‐in views are also shown in the bottom of this figure [Color figure can be viewed at http://wileyonlinelibrary.com]
Also, as shown in Table 1, our method increases the peak t values in four networks to 23.07, 15.20, 15.41, and 14.40, respectively, with an average improvement of 88.74% (i.e., ((23.07–12.29)/12.29+(23.07–11.90)/11.90+(23.07–12.49)/12.49)/3 = 88.74%), 32.20%, 62.18%, and 35.22%. To compute the number of suprathreshold voxels, two thresholds are used: (a) t > 2.539 (p < .01, uncorrected) and (b) t > 4.997 (p < 4e‐5, uncorrected). In Figure 5, although CEN shows negative gain compared with the registration using the mean fMRI image, the relatively large improvements in DMN, VN, and SM can be observed. If using a more stringent threshold (t > 4.997), the suprathreshold voxel number in CEN for our method is also the largest in addition to the other three networks.
Figure 5.
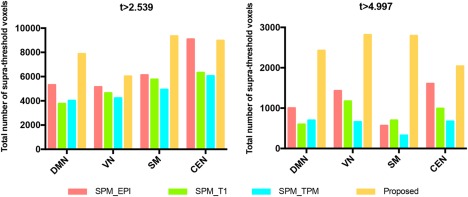 The total number of suprathreshold voxels in DMN, VN, SM, and CEN, using two different thresholds (t > 2.539 and t > 4.997) [Color figure can be viewed at http://wileyonlinelibrary.com]
We also compared several major components in DMN. In Table 2, four major components in DMN, including posterior cingulate cortex (PCC), medial prefrontal cortex (mPFC), and left and right angular gyrus, also increase their maximum values of t map to 23.07, 15.20, 15.41, and 14.40, with the average improvements of 88.74%, 25.35%, 12.44%, and 26.35%, respectively. We further investigate the total number of statistically significant voxels using two different thresholds (Figure 6). Our method is also the best when evaluated based on the total number of suprathreshold voxels with two different thresholds (Figure 6). Importantly, when setting a more stringent threshold (t > 4.997), all other three registration methods cannot detect adequate significant functionally connected voxels in the mPFC, LAG, and RAG. Overall, more significant voxels can be found in DMN, especially at the PCC.
Figure 6.
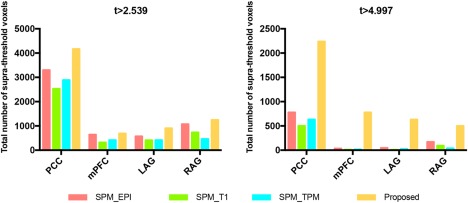 Total number of suprathreshold voxels for the four major clusters of the DMN, using two different thresholds (t > 2.539 and t > 4.997) [Color figure can be viewed at http://wileyonlinelibrary.com]
 -
Spatial overlap between subject‐specific networks and group networks
Figure 7 shows the individual versus group overlap for four networks with different thresholds. Our proposed method improves the performance as seen from the large positive change in a number of overlap percentages over different thresholds. For DMN, the overlap of the proposed method starts to decrease after t > 1.7, whereas other methods start declining after t > 0.5. Similarly, such a threshold‐dependent overlap curve was observed in the VN, for which the maximum overlap for our method is at t > 1.5. For the SM and CEN, the overlap gradually decreases for all methods, but our method decreases slower.
Figure 7.
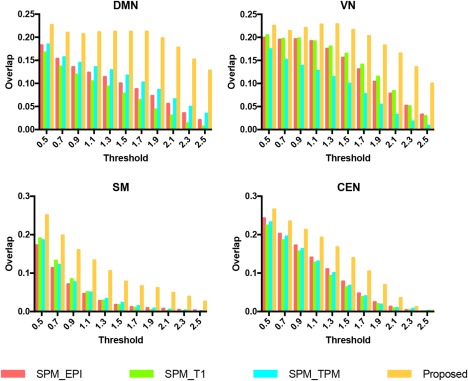 The overlap between each subject‐specific component and the group component with different thresholds for four networks [Color figure can be viewed at http://wileyonlinelibrary.com]
 -
Intersubject component correlation
When measured by intersubject cross‐correlation, our method still shows superior performance over the other methods (Figure 8). Specifically, our method gives the largest intersubject similarity for all the four networks (Table 3).
Figure 8.
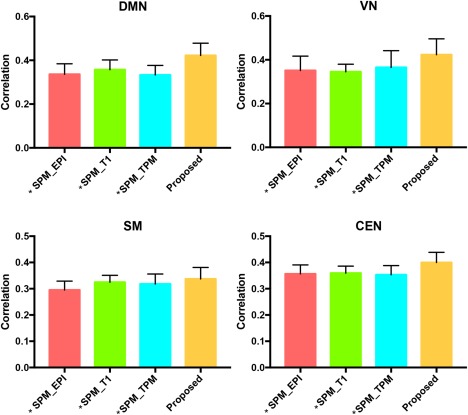 Intersubject correlations of four networks using four different registration methods. * marks the statistically significant difference with respect to our proposed method [Color figure can be viewed at http://wileyonlinelibrary.com]
For comparison based on the t map, our proposed method gives better results compared with the structural registration methods for all networks (Figure 4). Other evaluation metrics, including the maximum value of t map (Table 1), suprathreshold voxels on different thresholds (Figures 5 and 6), the overlap across different subjects (Figure 7), and the intersubject component correlation (Figure 8), give similar conclusions.
Table 1.
Maximum t values in DMN, VN, SM, and CEN
| SPM_EPI | SPM_T1 | SPM_TPM | Proposed | |
|---|---|---|---|---|
| DMN | 12.29 | 11.90 | 12.49 | 23.07 |
| VN | 11.15 | 11.92 | 11.45 | 15.20 |
| SM | 9.32 | 9.98 | 9.24 | 15.41 |
| CEN | 11.77 | 11.15 | 9.34 | 14.40 |
Abbreviations: CEN = central executive network; DMN = default mode network; SM = sensorimotor network; VN = visual network.
Table 2.
Maximum t values in four major clusters of the DMN
| SPM_EPI | SPM_T1 | SPM_TPM | Proposed | |
|---|---|---|---|---|
| PCC | 12.29 | 11.90 | 12.49 | 23.07 |
| mPFC | 6.88 | 5.91 | 6.73 | 8.12 |
| LAG | 7.50 | 5.86 | 7.65 | 7.76 |
| RAG | 9.86 | 9.30 | 8.17 | 11.44 |
Abbreviations: LAG = left angular gyrus; mPFC = medial prefrontal cortex; PCC = posterior cingulate cortex; RAG = right angular gyrus.
Table 3.
Intersubject correlation (mean/STD) in DMN, VN, SM, and CEN
| SPM_EPI | SPM_T1 | SPM_TPM | Proposed | |
|---|---|---|---|---|
| DMN | 0.353/0.065 | 0.346/0.034 | 0.368/0.079 | 0.429/0.071 |
| VN | 0.336/0.048 | 0.357/0.045 | 0.333/0.043 | 0.423/0.056 |
| SM | 0.295/0.034 | 0.325/0.026 | 0.318/0.038 | 0.338/0.043 |
| CEN | 0.356/0.034 | 0.360/0.026 | 0.353/0.035 | 0.400/0.038 |
Abbreviations: CEN = central executive network; DMN = default mode network; SM = sensorimotor network; VN = visual network;.
Part II. Evaluation of functional information
We further analyzed the role of functional tensor information in registration using mLDDMM: (a) only GM PFCTs, (b) only WM PFCTs, and (c) GM + WM ts‐PFCTs (our proposed method). Figure 9 shows the group‐level t maps when different functional information is used for registration. Table 4 shows that the ts‐PFCTs yield the best performance for all the four networks. Compared with GM PFCTs, our method improves the peak t values in four networks by 50.78%, 2.7%, 22.30%, and 10.77%, respectively. Compared with WM PFCTs, our proposed method yields improvements of 46.94%, 4.11%, 49.61%, and 5.11%, respectively.
Figure 9.
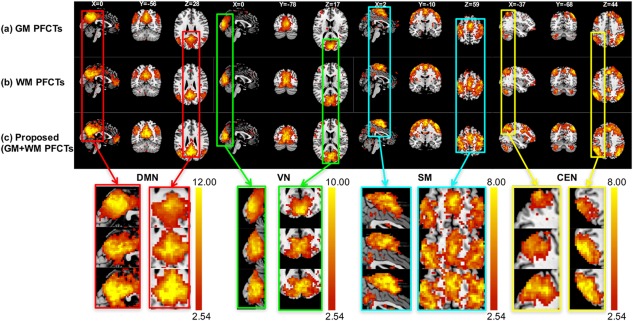
The group t maps of four networks with t > 2.54 (p < .01) after registration by (a) GM PFCTs, (b) WM PFCTs, and (c) GM + WM ts‐PFCTs (proposed method). The threshold is set to t > 2.54 (p < .01). Close‐up views are also shown at the bottom [Color figure can be viewed at http://wileyonlinelibrary.com]
Table 4.
Maximum t values when different functional tensor information is used for registration
| GM PFCTs | WM PFCTs | Proposed | |
|---|---|---|---|
| DMN | 15.30 | 15.70 | 23.07 |
| VN | 14.80 | 14.60 | 15.20 |
| SM | 12.60 | 10.30 | 15.41 |
| CEN | 13.00 | 13.70 | 14.40 |
Part III. Comparison with a state‐of‐the‐art functional registration method
Consistent with previous reports on the effectiveness of functional registration (Cetin et al., 2015; Conroy et al., 2009, 2013; Jiang et al., 2013; Khullar et al., 2011; Langs et al., 2010; Sabuncu et al., 2010), observations from the four main components of DMN (Table 2 and Figure 8) further verified the effectiveness of our proposed method. Using the same dataset as (Jiang et al., 2013), our method increases the maximum value of t map from 17.9 to 23.07. Note that, unlike (Jiang et al., 2013), our method does not use T1 MR image‐based structural registration as an initialization for functional registration.
3.3.2. Evaluation based on task‐fMRI data
Part I. Comparison with coventional registration methods
We detected significantly higher ALFF and ReHo values in some regions in the visual cortex, including the bilateral IOG (inferior middle occipital) gyrus and cuneus (BA19) (t test, p < .01, uncorrected) (Figure 10). Table 5 shows that our method improves the peak t values and suprathreshold voxels of ALFF and ReHo over all the comparison methods.
Figure 10.
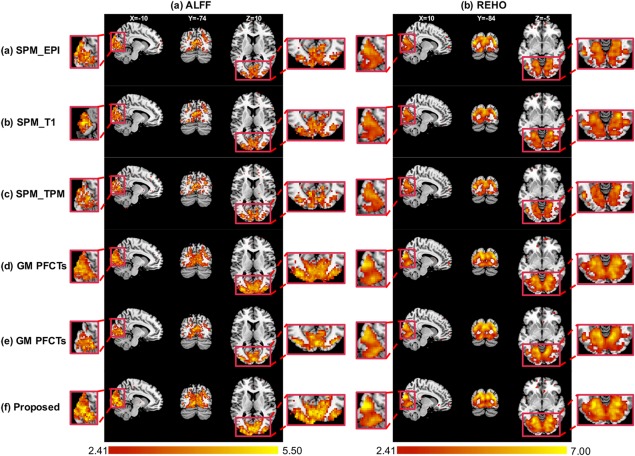
The paired t test for ECEO dataset using ALFF and ReHo evaluations after registration by (a) SPM_EPI, (b) SPM_T1, (c) SPM_TPM, (d) GM PFCTs, (e) WM PFCTs, and (f) our proposed method. Close‐up views are shown at the bottom [Color figure can be viewed at http://wileyonlinelibrary.com]
Table 5.
Maximum t values and the number of suprathreshold voxels given by different four registration methods
| SPM_EPI | SPM_T1 | SPM_TPM | Proposed | ||
|---|---|---|---|---|---|
| ALFF | Peak t value | 6.37 | 6.41 | 6.13 | 7.17 |
| Suprathreshold voxels | 2718 | 2548 | 2484 | 4494 | |
| ReHo | Peak t value | 7.51 | 7.96 | 7.62 | 8.57 |
| Suprathreshold voxels | 3584 | 3425 | 3032 | 4461 |
Part II. Evaluation of functional information
Figure 10 and Table 6 show the functional consistency results for different functional information used in registration. Table 6 shows our method (GM + WM ts‐PFCTs) improves the peak t values and suprathreshold voxels of ALFF and ReHo over GM ts‐PFCTs and WM ts‐PFCTs.
Table 6.
Maximum t values and the total number of suprathreshold voxels given by registration using different functional information
| GM PFCTs | WM PFCTs | Proposed | ||
|---|---|---|---|---|
| ALFF | Peak t value | 6.78 | 6.81 | 7.17 |
| Suprathreshold voxels | 3831 | 2484 | 4494 | |
| ReHo | Peak t value | 8.28 | 8.32 | 8.57 |
| Suprathreshold voxels | 4082 | 4492 | 4461 |
3.3.3. eMCI‐NC classification
Part I. Comparison with coventional registration methods
In Table 7, we list the classification performance with respect to different registration methods. Although SEN and SPE are relatively lower than SPM_T1 and SPM_TPM, our method shows improvements in ACC and AUC. The ROC curves shown in Figure 11a indicate that our proposed framework outperforms all structural registration methods.
Table 7.
eMCI‐NC classification performance (%) for different registration methods
| SPM_EPI | SPM_T1 | SPM_TPM | Proposed | |
|---|---|---|---|---|
| ACC | 66.22 | 67.57 | 67.57 | 74.32 |
| SEN | 69.44 | 80.56 | 58.33 | 74.29 |
| SPE | 68.42 | 55.26 | 76.23 | 74.36 |
| AUC | 70.39 | 70.25 | 68.27 | 83.11 |
Abbreviations: ACC = accuracy; AUC = area under curve; SEN = sensitivity; SPE = specificity.
Figure 11.
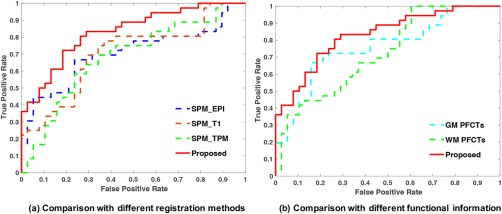
The ROC curves of eMCI‐NC classification: (a) comparison with different registration methods and (b) comparison with different functional information [Color figure can be viewed at http://wileyonlinelibrary.com]
Part II. Evaluation of functional information
In Table 8, we list the classification performance with respect to different functional information, again confirming that our method yields the best performance. The ROC curves shown in Figure 11b indicate that our proposed framework outperforms structural registration methods. It is worth noting that GM PFCTs can also perform better in ACC and AUC than structural registration methods. In addition, the ROC curves shown in Figure 11b confirm that using both GM and WM functional connectivity in registration improves the classification outcome.
Table 8.
eMCI‐NC classification performance (%) for different functional information
| GM PFCTs | WM PFCTs | Proposed | |
|---|---|---|---|
| ACC | 70.27 | 64.86 | 74.32 |
| SEN | 69.44 | 63.16 | 74.29 |
| SPE | 71.05 | 66.67 | 74.36 |
| AUC | 75.95 | 72.51 | 83.11 |
Abbreviations: ACC = accuracy; AUC = area under curve; SEN = sensitivity; SPE = specificity.
4. DISCUSSION
4.1. Structural versus functional registration
Using the ICA‐based data‐driven analysis method for rs‐fMRI data, we examined the inter‐subject functional consistency for rs‐fMRI registration using functional and structural features. The results of multiple functional brain networks show that (a) functional registration yields higher functional consistency than structural registration and (b) functional regions are not necessarily confined by anatomical boundaries, consistent with the observations in previous studies (Cetin et al., 2015; Conroy et al., 2009, 2013; Jiang et al., 2013; Khullar et al., 2011; Langs et al., 2010; Sabuncu et al., 2010).
4.2. GM versus whole‐brain registration
The effectiveness of our method can be attributed to the utilization of whole‐brain functional features for registration. Using only functional features from cortical GM may cause registration error in WM, which will in turn deteriorate GM. The experimental results indicate that using ts‐PFCTs on the whole brain offers the best registration performance.
The computation of ts‐PFCTs is key to the effectiveness of whole‐brain functional registration. Since the spatial resolution of rs‐fMRI is relatively low, voxels on WM‐GM boundaries may also contain functional information across tissues. Separate consideration of the WM and GM is essential for teasing apart the influences of different tissue types on FC.
4.3. Comparison with other functional registration approaches
The techniques developed in Conroy et al. (2009, 2013) align fMRI data based on similarity of functional connectivity along the cortical sheet. In Robinson et al. (2014), functional alignment is integrated with anatomical alignment for cross‐subject registration. Methods described in Langs et al. (2010) and Nenning et al. (2017) uses spectral embedding of FC features. Our method offers two advantages: (a) it does not require structural registration, which is used in all the above functional registration methods for initialization; (b) unlike the above methods that use only GM information, our method employs functional information not only on GM but also on WM.
4.4. Biology or neurophysiology rationale of WM fMRI
The fMRI signal usually refers to the temporal variation of voxel intensities in gradient‐echo echo planar imaging (GE‐EPI) sequences that have primarily T2*‐weighted contrast. Multiple sources contribute to this signal, but these sources may not be directly related to neural activity (Bianciardi et al., 2009). For the BOLD signals in GM, the BOLD fluctuation reflects the combined effects of cerebral blood flow (CBF), blood volume (CBV), and the metabolic rate of oxygen (CMRO2) (Buxton, Wong, & Frank, 1998). Such hemodynamic and metabolic changes are coupled with neural activity in terms of both synaptic input and spiking output (Logothetis, Pauls, Augath, Trinath, & Oeltermann, 2001; Smith et al., 2002).
However, whether or not the WM signal is related to neural activity, is still actively investigated. The WM contains connections between specialized functional areas, accounting for about half of the human brain (Arai and Lo, 2009; Harris and Attwell, 2012). The functional significance of WM has been established through extensive injury and anatomical studies, which have demonstrated the importance of the integrity of WM for normal brain function. Many mental disorders are associated with WM damage and dysconnection (Catani and Ffytche, 2005). Evidence supporting WM FC is as follows: (a) Astrocytes that mediate neuronal coupling in GM are also present in WM (Rash, 2010). (b) Despite the low density of vasculature, CBF and BOLD signals are detectable in the WM, although at a lower magnitude than that in the GM (Rostrup et al., 2000; Thomas, Liu, Park, Van Osch, & Lu, 2014). (c) Metabolic changes in neuromodulation can be observed in WM (Weber et al., 2002). (d) WM fMRI signals show task‐dependent activations (Ding et al., 2013, 2016). Importantly, we think that the FCT could be a suitable metric for characterizing the unique WM functional information, although the amplitude of local FC used in Jiang et al. (2013) is also informative. This is because the supportive micro blood vasculature and capillary vessels in WM may follow the main direction of the fiber bundles due to spatial constraint and thus form a highly structured local FC pattern, which can then be captured by FCT (Ding et al., 2013). The FCT, compared with the amplitude of local FC, carries more information (i.e., shape and direction) than just the local FC strength. For example, the FCT can capture WM fiber bundle orientation information, as demonstrated by (Ding et al., 2013, 2016). This is essentially important for functional registration because the underlying WM fibers link cortical functional areas together and could be used to detect functional borders (Thomas et al., 2014).
5. CONCLUSION
In this article, we have proposed a novel whole‐brain functional registration method for rs‐fMRI data. It is implemented via a multi‐channel large deformation diffeomorphic metric mapping (mLDDMM) based on the tissue‐specific patch‐based functional correlation tensors (ts‐PFCTs) extracted from both GM and WM tissues. We have conducted a comprehensive evaluation based on primary and cognitive networks. The results demonstrate that our method significantly increases intersubject consistency of functional regions after registration, compared with the registration using just the structural information or cortical functional features. The improved accuracy in functional registration given by our method will further improve statistical power in group‐level analysis and sensitivity for individualized disease diagnosis.
Supporting information
Additional Supporting Information may be found online in the supporting information tab for this article.
Supporting Information Figure S1
Supporting Information Figure Legend
Supporting Information Table S1
ACKNOWLEDGMENT
This research was supported by the grants from National Natural Science Funds of Guangdong United Found (NSFC‐Guangdong United Found, No. U1501256), The Science and Technology Project of Guangdong Province (Nos. 2015B010106008 and 2015B010131011), and National Institutes of Health grants NS093842 and EB022880.
Zhou Y, Zhang H, Zhang L, et al. Functional MRI registration with tissue‐specific patch‐based functional correlation tensors. Hum Brain Mapp. 2018;39:2303–2316. 10.1002/hbm.24021
Funding information National Natural Science Funds of Guangdong United Found (NSFC‐Guangdong United Found), Grant/Award Number: U1501256; The Science and Technology Project of Guangdong Province, Grant/Award Numbers: 2015B010106008, 2015B010131011; National Institutes of Health, Grant/Award Numbers: NS093842, EB022880
Footnotes
http://fcon_1000.projects.nitrc.org (Detail information is listed here).
Contributor Information
Qianjin Feng, Email: qianjinfeng08@gmail.con.
Dinggang Shen, Email: dgshen@med.unc.edu.
REFERENCES
- Arai, K. , & Lo, E. H. (2009). An oligovascular niche: Cerebral endothelial cells promote the survival and proliferation of oligodendrocyte precursor cells. Journal of Neuroscience, 29(14), 4351–4355. [DOI] [PMC free article] [PubMed] [Google Scholar]
- Ashburner, J. (2007). A fast diffeomorphic image registration algorithm. NeuroImage, 38(1), 95–113. [DOI] [PubMed] [Google Scholar]
- Ashburner, J. , & Friston, K. J. (2005). Unified segmentation. NeuroImage, 26(3), 839–851. [DOI] [PubMed] [Google Scholar]
- Basser, P. J. , & Pajevic, S. (2000). Statistical artifacts in diffusion tensor MRI (DT‐MRI) caused by background noise. Magnetic Resonance in Medicine, 44(1), 41–50. [DOI] [PubMed] [Google Scholar]
- Bianciardi, M. , Fukunaga, M. , van Gelderen, P. , Horovitz, S. G. , de Zwart, J. A. , Shmueli, K. , & Duyn, J. H. (2009). Sources of functional magnetic resonance imaging signal fluctuations in the human brain at rest: A 7 T study. Magnetic Resonance Imaging, 27(8), 1019–1029. [DOI] [PMC free article] [PubMed] [Google Scholar]
- Biswal, B. , Yetkin, F. Z. , Haughton, V. M. , & Hyde, J. S. (1995). Functional connectivity in the motor cortex of resting human brain using echo‐planar MRI. Magnetic Resonance in Medicine, 34(4), 537–541. [DOI] [PubMed] [Google Scholar]
- Buxton, R. B. , Wong, E. C. , & Frank, L. R. (1998). Dynamics of blood flow and oxygenation changes during brain activation: The balloon model. Magnetic Resonance in Medicine, 39(6), 855–864. [DOI] [PubMed] [Google Scholar]
- Catani, M. , & Ffytche, D. H. (2005). The rises and falls of disconnection syndromes. Brain: A Journal of Neurology, 128(Pt 10), 2224–2239. [DOI] [PubMed] [Google Scholar]
- Cetin, M. S. , Khullar, S. , Damaraju, E. , Michael, A. M. , Baum, S. A. , & Calhoun, V. D. (2015). Enhanced disease characterization through multi network functional normalization in fMRI. Frontiers in Neuroscience, 9, 95. [DOI] [PMC free article] [PubMed] [Google Scholar]
- Chang, C.‐C. , & Lin, C.‐J. (2011). LIBSVM: a library for support vector machines. ACM transactions on intelligent systems and technology, 2, 27. [Google Scholar]
- Cole, D. M. , Smith, S. M. , & Beckmann, C. F. (2010). Advances and pitfalls in the analysis and interpretation of resting‐state fMRI data. Frontiers in Systems Neuroscience, 4, 8. [DOI] [PMC free article] [PubMed] [Google Scholar]
- Conroy, B. , Singer, B. , Haxby, J. , & Ramadge, P. J. (2009). fMRI‐based inter‐subject cortical alignment using functional connectivity. Paper presented at: Advances in neural information processing systems. [PMC free article] [PubMed]
- Conroy, B. R. , Singer, B. D. , Guntupalli, J. S. , Ramadge, P. J. , & Haxby, J. V. (2013). Inter‐subject alignment of human cortical anatomy using functional connectivity. NeuroImage, 81, 400–411. [DOI] [PMC free article] [PubMed] [Google Scholar]
- Ding, Z. , Newton, A. T. , Xu, R. , Anderson, A. W. , Morgan, V. L. , & Gore, J. C. (2013). Spatio‐temporal correlation tensors reveal functional structure in human brain. PLoS One, 8(12), e82107. [DOI] [PMC free article] [PubMed] [Google Scholar]
- Ding, Z. , Xu, R. , Bailey, S. K. , Wu, T.‐L. , Morgan, V. L. , Cutting, L. E. , … Gore, J. C. (2016). Visualizing functional pathways in the human brain using correlation tensors and magnetic resonance imaging. Magnetic Resonance Imaging, 34(1), 8–17. [DOI] [PMC free article] [PubMed] [Google Scholar]
- Filippini, N. , MacIntosh, B. J. , Hough, M. G. , Goodwin, G. M. , Frisoni, G. B. , Smith, S. M. , … Mackay, C. E. (2009). Distinct patterns of brain activity in young carriers of the APOE‐epsilon 4 allele. Proceedings of the National Academy of Sciences of the United States of America, 106(17), 7209–7214. [DOI] [PMC free article] [PubMed] [Google Scholar]
- Gawryluk, J. R. , Mazerolle, E. L. , Brewer, K. D. , Beyea, S. D. , & D'Arcy, R. C. (2011). Investigation of fMRI activation in the internal capsule. BMC Neuroscience, 12, 56. [DOI] [PMC free article] [PubMed] [Google Scholar]
- Gawryluk, J. R. , Mazerolle, E. L. , & D'Arcy, R. C. (2014). Does functional MRI detect activation in white matter? A review of emerging evidence, issues, and future directions. Frontiers in Neuroscience, 8, 239. [DOI] [PMC free article] [PubMed] [Google Scholar]
- Greicius, M. D. , Krasnow, B. , Reiss, A. L. , & Menon, V. (2003). Functional connectivity in the resting brain: A network analysis of the default mode hypothesis. Proceedings of the National Academy of Sciences of the United States of America, 100(1), 253–258. [DOI] [PMC free article] [PubMed] [Google Scholar]
- Greicius, M. D. , Srivastava, G. , Reiss, A. L. , & Menon, V. (2004). Default‐mode network activity distinguishes Alzheimer's disease from healthy aging: Evidence from functional MRI. Proceedings of the National Academy of Sciences of the United States of America, 101(13), 4637–4642. [DOI] [PMC free article] [PubMed] [Google Scholar]
- Greicius, M. D. , Supekar, K. , Menon, V. , & Dougherty, R. F. (2009). Resting‐state functional connectivity reflects structural connectivity in the default mode network. Cerebral Cortex (New York, N.Y.: 1991), 19(1), 72–78. [DOI] [PMC free article] [PubMed] [Google Scholar]
- Harris, J. J. , & Attwell, D. (2012). The energetics of CNS white matter. Journal of Neuroscience, 32(1), 356–371. [DOI] [PMC free article] [PubMed] [Google Scholar]
- Honey, C. , Sporns, O. , Cammoun, L. , Gigandet, X. , Thiran, J.‐P. , Meuli, R. , & Hagmann, P. (2009). Predicting human resting‐state functional connectivity from structural connectivity. Proceedings of the National Academy of Sciences, 106(6), 2035–2040. [DOI] [PMC free article] [PubMed] [Google Scholar]
- Jiang, D. , Du, Y. , Cheng, H. , Jiang, T. , & Fan, Y. (2013). Groupwise spatial normalization of fMRI data based on multi‐range functional connectivity patterns. NeuroImage, 82, 355–372. [DOI] [PubMed] [Google Scholar]
- Khullar, S. , Michael, A. M. , Cahill, N. D. , Kiehl, K. A. , Pearlson, G. , Baum, S. A. , & Calhoun, V. D. (2011). ICA‐fNORM: Spatial normalization of fMRI data using intrinsic group‐ICA networks. Frontiers in Systems Neuroscience, 5, 93. [DOI] [PMC free article] [PubMed] [Google Scholar]
- Langs, G. , Tie, Y. , Rigolo, L. , Golby, A. , & Golland, P. (2010). Functional geometry alignment and localization of brain areas. Paper presented at: Advances in neural information processing systems. [PMC free article] [PubMed]
- Logothetis, N. K. , Pauls, J. , Augath, M. , Trinath, T. , & Oeltermann, A. (2001). Neurophysiological investigation of the basis of the fMRI signal. Nature, 412(6843), 150–157. [DOI] [PubMed] [Google Scholar]
- Marussich, L. , Lu, K.‐H. , Wen, H. , & Liu, Z. (2017). Mapping white‐matter functional organization at rest and during naturalistic visual perception. NeuroImage, 146, 1128–1141. [DOI] [PMC free article] [PubMed] [Google Scholar]
- Mazerolle, E. L. , Beyea, S. D. , Gawryluk, J. R. , Brewer, K. D. , Bowen, C. V. , & D'arcy, R. C. (2010). Confirming white matter fMRI activation in the corpus callosum: Co‐localization with DTI tractography. NeuroImage, 50(2), 616–621. [DOI] [PubMed] [Google Scholar]
- Mosier, K. M. , Liu, W. C. , Maldjian, J. A. , Shah, R. , & Modi, B. (1999). Lateralization of cortical function in swallowing: A functional MR imaging study. American Journal of Neuroradiology, 20(8), 1520–1526. [PMC free article] [PubMed] [Google Scholar]
- Nenning, K. H. , Liu, H. , Ghosh, S. S. , Sabuncu, M. R. , Schwartz, E. , & Langs, G. (2017). Diffeomorphic functional brain surface alignment: Functional demons. NeuroImage, 156, 456–465. [DOI] [PMC free article] [PubMed] [Google Scholar]
- Ogawa, S. , Lee, T.‐M. , Kay, A. R. , & Tank, D. W. (1990). Brain magnetic resonance imaging with contrast dependent on blood oxygenation. Proceedings of the National Academy of Sciences, 87(24), 9868–9872. [DOI] [PMC free article] [PubMed] [Google Scholar]
- Peer, M. , Nitzan, M. , Bick, A. S. , Levin, N. , & Arzy, S. (2017). Evidence for functional networks within the human brain's white matter. Journal of Neuroscience, 37(27), 6394. [DOI] [PMC free article] [PubMed] [Google Scholar]
- Qiao, L. , Zhang, H. , Kim, M. , Teng, S. , Zhang, L. , & Shen, D. (2016). Estimating functional brain networks by incorporating a modularity prior. NeuroImage, 141, 399–407. [DOI] [PMC free article] [PubMed] [Google Scholar]
- Quigley, M. , Cordes, D. , Turski, P. , Moritz, C. , Haughton, V. , Seth, R. , & Meyerand, M. E. (2003). Role of the corpus callosum in functional connectivity. American Journal of Neuroradiology, 24, 208–212. [PMC free article] [PubMed] [Google Scholar]
- Raichle, M. E. , & Snyder, A. Z. (2007). A default mode of brain function: A brief history of an evolving idea. NeuroImage, 37(4), 1083–1090. [DOI] [PubMed] [Google Scholar]
- Rash, J. E. (2010). Molecular disruptions of the panglial syncytium block potassium siphoning and axonal saltatory conduction: Pertinence to neuromyelitis optica and other demyelinating diseases of the central nervous system. Neuroscience, 168(4), 982–1008. [DOI] [PMC free article] [PubMed] [Google Scholar]
- Robinson, E. C. , Jbabdi, S. , Glasser, M. F. , Andersson, J. , Burgess, G. C. , Harms, M. P. , … Jenkinson, M. (2014). MSM: A new flexible framework for multimodal surface matching. NeuroImage, 100, 414. [DOI] [PMC free article] [PubMed] [Google Scholar]
- Rostrup, E. , Law, I. , Blinkenberg, M. , Larsson, H. , Born, A. P. , Holm, S. , & Paulson, O. (2000). Regional differences in the CBF and BOLD responses to hypercapnia: A combined PET and fMRI study. NeuroImage, 11(2), 87–97. [DOI] [PubMed] [Google Scholar]
- Sabuncu, M. R. , Singer, B. D. , Conroy, B. , Bryan, R. E. , Ramadge, P. J. , & Haxby, J. V. (2010). Function‐based intersubject alignment of human cortical anatomy. Cerebral Cortex (New York, N.Y.: 1991), 20(1), 130–140. [DOI] [PMC free article] [PubMed] [Google Scholar]
- Smith, A. J. , Blumenfeld, H. , Behar, K. L. , Rothman, D. L. , Shulman, R. G. , & Hyder, F. (2002). Cerebral energetics and spiking frequency: The neurophysiological basis of fMRI. Proceedings of the National Academy of Sciences, 99(16), 10765–10770. [DOI] [PMC free article] [PubMed] [Google Scholar]
- Smith, S. M. , Fox, P. T. , Miller, K. L. , Glahn, D. C. , Fox, P. M. , Mackay, C. E. , … Laird, A. R. (2009). Correspondence of the brain's functional architecture during activation and rest. Proceedings of the National Academy of Sciences, 106(31), 13040–13045. [DOI] [PMC free article] [PubMed] [Google Scholar]
- Thomas, B. P. , Liu, P. , Park, D. C. , Van Osch, M. J. , & Lu, H. (2014). Cerebrovascular reactivity in the brain white matter: Magnitude, temporal characteristics, and age effects. Journal of Cerebral Blood Flow & Metabolism, 34, 242–247. [DOI] [PMC free article] [PubMed] [Google Scholar]
- Tzourio‐Mazoyer, N. , Landeau, B. , Papathanassiou, D. , Crivello, F. , Etard, O. , Delcroix, N. , … Joliot, M. (2002). Automated anatomical labeling of activations in SPM using a macroscopic anatomical parcellation of the MNI MRI single‐subject brain. Neuroimage, 15, 273–289. [DOI] [PubMed] [Google Scholar]
- van den Heuvel, M. P. , & Pol, H. E. H. (2010). Exploring the brain network: A review on resting‐state fMRI functional connectivity. European Neuropsychopharmacology, 20(8), 519–534. [DOI] [PubMed] [Google Scholar]
- Wang, D. , Buckner, R. L. , Fox, M. D. , Holt, D. J. , Holmes, A. J. , Stoecklein, S. , … Li, K. (2015). Parcellating cortical functional networks in individuals. Nature Neuroscience, 18(12), 1853–1860. [DOI] [PMC free article] [PubMed] [Google Scholar]
- Weber, B. , Fouad, K. , Burger, C. , & Buck, A. (2002). White matter glucose metabolism during intracortical electrostimulation: A quantitative [18 F] fluorodeoxyglucose autoradiography study in the rat. NeuroImage, 16(4), 993–998. [DOI] [PubMed] [Google Scholar]
- Wu, X. , Yang, Z. , Bailey, S. K. , Zhou, J. , Cutting, L. E. , Gore, J. C. , & Ding, Z. (2017). Functional connectivity and activity of white matter in somatosensory pathways under tactile stimulations. NeuroImage, 152, 371–380. [DOI] [PMC free article] [PubMed] [Google Scholar]
- Xue, Z. , Shen, D. , & Davatzikos, C. (2004). Determining correspondence in 3‐D MR brain images using attribute vectors as morphological signatures of voxels. IEEE Transactions on Medical Imaging, 23, 1276–1291. [DOI] [PubMed] [Google Scholar]
- Xue, Z. , Shen, D. , & Davatzikos, C. (2006a). CLASSIC: consistent longitudinal alignment and segmentation for serial image computing. NeuroImage, 30, 388–399. [DOI] [PubMed] [Google Scholar]
- Xue, Z. , Shen, D. , & Davatzikos, C. (2006b). Statistical representation of high‐dimensional deformation fields with application to statistically constrained 3D warping. Medical Image Analysis, 10, 740–751. [DOI] [PubMed] [Google Scholar]
- Xue, Z. , Shen, D. , Karacali, B. , Stern, J. , Rottenberg, D. , & Davatzikos, C. (2006c). Simulating deformations of MR brain images for validation of atlas‐based segmentation and registration algorithms. NeuroImage, 33, 855–866. [DOI] [PMC free article] [PubMed] [Google Scholar]
- Zang, Y. , Jiang, T. , Lu, Y. , He, Y. , & Tian, L. (2004). Regional homogeneity approach to fMRI data analysis. NeuroImage, 22(1), 394–400. [DOI] [PubMed] [Google Scholar]
- Zhang, P. , Niethammer, M. , Shen, D. , & Yap, P.‐T. (2014). Large deformation diffeomorphic registration of diffusion‐weighted imaging data. Medical Image Analysis, 18(8), 1290–1298. [DOI] [PMC free article] [PubMed] [Google Scholar]
- Zou, Q.‐H. , Zhu, C.‐Z. , Yang, Y. , Zuo, X.‐N. , Long, X.‐Y. , Cao, Q.‐J. , … Zang, Y.‐F. (2008). An improved approach to detection of amplitude of low‐frequency fluctuation (ALFF) for resting‐state fMRI: Fractional ALFF. Journal of Neuroscience Methods, 172(1), 137–141. [DOI] [PMC free article] [PubMed] [Google Scholar]
Associated Data
This section collects any data citations, data availability statements, or supplementary materials included in this article.
Supplementary Materials
Additional Supporting Information may be found online in the supporting information tab for this article.
Supporting Information Figure S1
Supporting Information Figure Legend
Supporting Information Table S1


