. 2018 Aug 23;7:e36317. doi: 10.7554/eLife.36317

Figure 4. Genomic data simulated under a model of background selection (BGS).

We used the demographic parameters estimated for the Yoruba (YRI) and Japanese (JPT) populations from neutral sites (WW + SS sites with RR ≥1.5 cM/Mb) as reported in Supplementary file 3 - Table S3. Forward simulations of diploid individuals were performed with SLiM v. 2.3 (Haller and Messer, 2017). We simulated the evolution of a chromosome of 50 Mb made up of 1000 5 kb regions, each consisting of a 1 kb region experiencing purifying selections followed by a 4 kb region with neutral mutations. A, B) Average derived allele frequency per individual (DAFi¯). C, D) Unfolded normalized SFS. Solid and dashed lines correspond to simulations performed with and without BGS, respectively. The transition to effective neutrality occurs between a recombination rate of 1e–8 (blue curve) and 1e–7 (orange curve), a range that includes our proposed threshold of 1.5 cM/Mb.

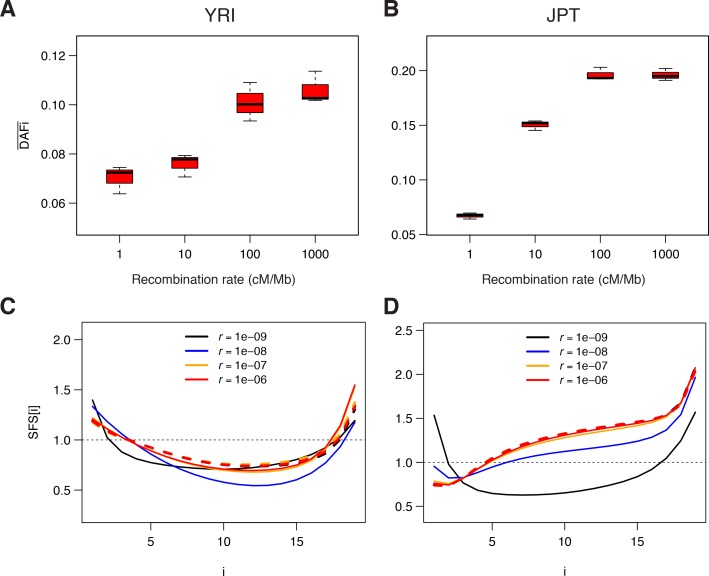
Figure 4.

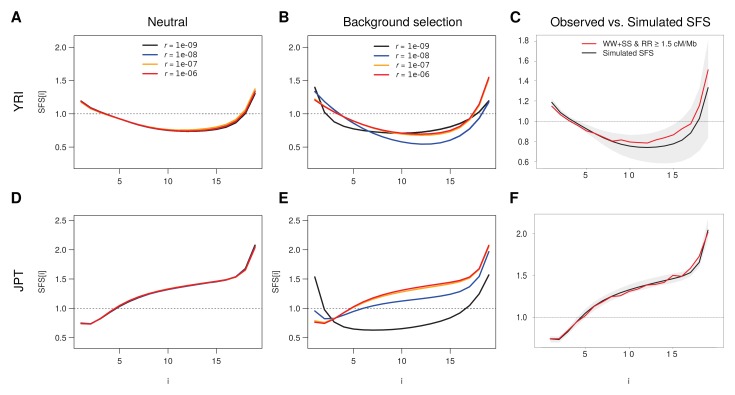
Figure 4—figure supplement 1. Simulated SFS under neutrality and with background selection for various recombination rates.

Figure 4—figure supplement 1.

Individual based simulations under demographic parameters inferred from neutral sites (WW + SS sites with r ≥ 1.5 cM/Mb) as reported in Supplementary file 3 - Table S3 were done for the Yoruba (YRI) and Japan (JPT) populations. (A, B) Unfolded SFS based on the YRI demographic parameters without (A) and with (B) BGS. (D, E) Unfolded SFS based on the JPT demographic parameters without (D) and with (E) BGS. Shaded areas delimit a 95% range obtained from 100 simulations. A recombination rate of r = 10–8 corresponds here to 1 cM/Mb. See Materials and methods for details of simulations. (C, F) Comparisons between the simulated unfolded neutral SFS with r = 10−6 and the observed neutral SFS (WW + SS sites with r ≥ 1.5 cM/Mb) for YRI (C) and JPT (F).
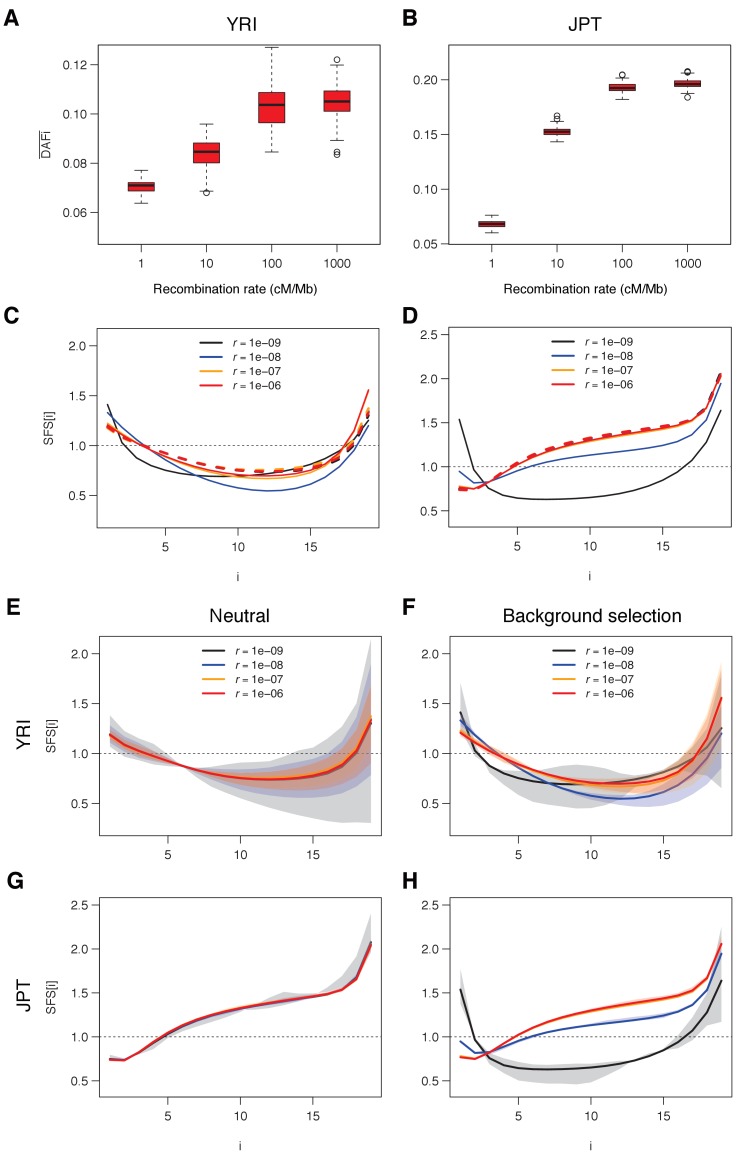
Figure 4—figure supplement 2. Simulated DAFi¯ and SFS under neutrality and with background selection for various recombination rates.

Figure 4—figure supplement 2.

Individual based simulations were done as described in Figure 4 and Figure 4—figure supplement 1, but with shorter alternating segments of sequence under purifying selection (100 bp instead of 1000 bp) and neutral sequence (400 bp instead of 4000 bp). (A, B) Average derived allele frequency per individual (DAFi¯). (C, D) Unfolded normalized SFS. Other details as in Figure 4. (E, F) Unfolded SFS based on the YRI demographic parameters without (E) and with (F) BGS. (G, H) Unfolded SFS based on the JPT demographic parameters without (G) and with (H) BGS. Shaded areas delimit a 95% range obtained from 100 simulations. Other details as in Figure 4—figure supplement 1. See Materials and methods for details of simulations.