

Summary
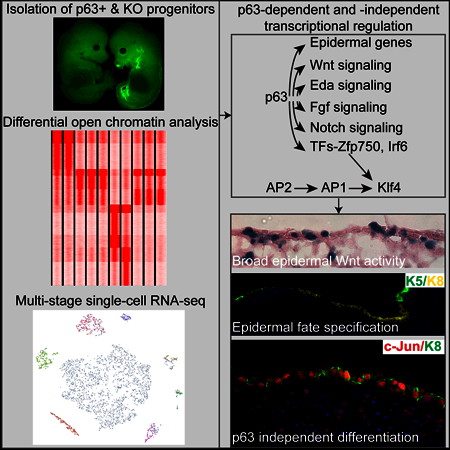
How embryonic progenitors coordinate cell fate specification and establish transcriptional and signaling competence is a fundamental question in developmental biology. Here we show that transcription factor ΔNp63 profoundly changes the transcriptome and remodels thousands of open chromatin regions of Krt8+ progenitors during epidermal fate specification. ATAC-seq and single-cell RNA-seq reveal that ΔNp63-dependent programs govern epidermal lineage formation and ΔNp63-independent programs, mediated by AP2 and AP1 transcription factors, promote epidermal differentiation and epithelial-to-mesenchymal transition. ΔNp63 promotes Wnt signaling by directly upregulating Wnt ligands, Frizzled receptors and transcription factors. Deletion of β-catenin in Krt8+ progenitors delays their maturation into Krt5+ progenitors. The lack of epidermal Wnt production in the absence of ΔNp63 also incapacitates Wnt activation in the underlying dermal cells. These findings reveal the remarkable changes of the transcriptome, open chromatin and signaling pathways at the onset of skin development and uncover the molecular cascade for epidermal lineage formation.
eTOC
Employing single-cell RNA-seq and ATAC-seq, Fan et al. examine transcriptional and chromatin changes occurring during epidermal fate specification in mice. They characterize a developmental program, dependent on the transcription factor ΔNp63, generating epidermal progenitors, and ΔNp63-independent programs promoting epidermal differentiation and epithelial-to-mesenchymal transition.
Introduction
The generation of induced pluripotent stem cells (SCs) (Takahashi and Yamanaka, 2006) and other somatic SC types by direct reprogramming with defined factors has demonstrated the possibility of inducing and maintaining SC identity in vitro. However, de novo formation of SC lineages during development requires faithful cell fate specification and cell-cell communication often among multiple cell types in a spatiotemporally specific manner. At the single-cell level, it is unclear how multiple types of embryonic progenitors interact to form adult SC lineages and their niche. At the mechanistic level, it is poorly understood when and how the tissue-specific transcriptome and signaling pathways are established to orchestrate the earliest events of adult SC lineage formation.
Mammalian skin and appendages such as hair follicles (HFs) and sweat glands is a powerful system to examine gene regulatory networks in SCs and their microenvironment (Blanpain and Fuchs, 2006). During mouse embryonic development, Krt5+ epidermal cells are derived from Krt8+ progenitors by embryonic day 12 (E12) (Blanpain and Fuchs, 2006). Subsequently, HF fate is induced by activated Wnt signaling pathway in the dorsal skin shortly after E13 (Blanpain and Fuchs, 2006; Schneider et al., 2009). Although individual transcription factors (TFs) and signaling pathways have been extensively studied in the skin starting from E12 when Krt5+ epidermal progenitors are specified, it remains largely unknown how Krt8+ progenitors are transformed into these Krt5+ epidermal progenitors at the genomic scale. Furthermore, although it is widely believed that dermal cells underneath the initially specified Krt5+ epidermal cells respond to epidermal Wnt (Chen et al., 2012; Zhang et al., 2009) and provide the “first message” to induce different skin appendages such as HFs and sweat glands (Blanpain and Fuchs, 2006; Dhouailly, 1973; Hardy, 1992; Lu et al., 2016), molecular mechanisms that govern epidermal Wnt production remain unclear.
In this study, we examine the dynamics of transcriptome and open chromatin landscape in Krt8+ progenitors at E9 and newly specified Krt5+ epidermal progenitors at E13. To dissect distinct regulatory circuits, we also examine ΔNp63 knockout (KO) epithelial cells. ΔNp63, a dominant isoform of p63 in the skin (Laurikkala et al., 2006), is a master TF in epidermal cells (Crum and McKeon, 2010). Although extensive efforts have been dedicated to study the functions of ΔNp63 (Bao et al., 2015; Laurikkala et al., 2006; Medawar et al., 2008; Romano et al., 2012; Senoo et al., 2007; Shalom-Feuerstein et al., 2011; Truong et al., 2006; Yang et al., 2006), the genome-wide effect of ΔNp63 in governing epidermal fate specification has remained unclear. By applying RNA-seq and ATAC-seq to normal and ΔNp63 KO epithelial cells, we reveal that ΔNp63 regulates numerous essential genes underlying the epidermal fate. Single-cell RNA-seq and open chromatin analysis reveal the role of ΔNp63-dependent and -independent programs in epidermal fate specification and differentiation. Furthermore, ΔNp63 directly regulates the expression of numerous components of Wnt signaling at the onset of skin development. Our studies have revealed the molecular origin of epidermal cells governed by ΔNp63 and other TFs during embryonic skin development.
Results
Activation of transcriptional and signaling networks during epidermal fate specification
The knowledge of Krt8+ progenitors and how they give rise to Krt5+ epidermal progenitors is scarce. To search for markers for Krt8+ progenitors before epidermal fate specification, we noticed that ΔNp63 was first detected in Krt8+ progenitors at embryonic day 9 (E9), shortly after gastrulation when these cells were negative for Krt5 (Figures 1A and S1A). By E11, these progenitors were marked by both Krt5 and Krt8 expression. At E13, these cells lost Krt8 expression and gained strong Krt5 expression, indicative of the completion of epidermal fate specification (Figure S1A). To isolate these rare progenitors and ΔNp63 KO cells for genomic profiling of transcriptome and open chromatin, we used a ΔNp63-GFP knock-in (KI) mouse model (Romano et al., 2012) to capture the Krt8+ progenitors at E9 and the initially specified, Krt5+ epidermal cells as well as ΔNp63 KO cells at E13 (Figures S1B–C). The heterozygous (het) KI mice expressed ×50% of ΔNp63 compared to the wildtype (WT) level but showed normal skin development and gene expression measured by quantitative polymerase chain reaction (qPCR) (Figure S1D) without any discernible defects. The homozygous KI mice abolished ΔNp63 expression (Figure S1C) and phenocopied p63-null mice (Romano et al., 2012).
Figure. 1. ΔNp63 governs the transcriptome during epidermal fate specification.

(A) IF staining of ΔNp63 with K8 at E9 and with K5 at E13. White dashed lines mark the epidermal-dermal boundary.
(B) GO analysis of differentially expressed genes in E13 vs E9 epidermal progenitors. Upper panel shows GO analysis for upregulated genes, and lower panel for downregulated genes.
(C) Examples of differentially expressed genes in E13 vs E9 epidermal progenitors. Red and blue indicate up- and down-regulated genes in E13 epidermis, respectively.
(D) qPCR validation of expression of selected genes in E9, E11 and E13 epidermis (n=4). *P<0.05, **P<0.01, ***P<0.001, ns, not significant.
(E) Transcriptome changes in ΔNp63 KO epithelial cells comparing to control at E13. Red and blue indicate up- and down-regulated genes in KO cells, respectively.
(F) GSEA of E0 specific transcriptome (upper panel) and E13 specific transcriptome (lower panel) in E13 ΔNp63 KO epithelial cells.
(G) Principle component analysis of the transcriptome of E9 epidermis (E9_Epi), E13 epidermis (E13_epi), E13 ΔNp63 KO epidermis (E13_KO), E14 epidermis (E14_Epi), E14 placode (E14_Pc), E14 fibroblasts (E14_Fb) and E14 dermal condensate (E14_DC).
(H) IF staining of K8, K5, β-cat and Lef1 in control and ΔNp63 KO at E13. White dashed lines mark the epidermal-dermal boundary. Scale bars in A and H, 50 μm. See also Figure S1 and Tables S1–2.
We performed RNA-seq to profile the transcriptome of E9 progenitors, E13 epidermal progenitors and E13 KO cells. First, we compared the transcriptome between E9 and E13 epidermal cells. Under a stringent cut-off (p<0.01), we detected 2,042 differentially expressed genes with 1,138 upregulated and 904 downregulated in the E13 vs E9 comparison (Table S1). Gene ontology analysis of highly differentially expressed genes (≥2-fold changes) revealed that upregulated genes are associated with skin development including cell adhesion, HF development and barrier formation and Wnt signaling (Figure 1B). Downregulated genes are associated with limb morphogenesis, neural development and heart development, reflecting an immature state of these E9 progenitors (Figure 1B). Markers of Krt5+ epidermal progenitors were strongly upregulated. In contrast, markers of embryonic SCs and immature epidermal progenitors were drastically downregulated (Figure 1C and Table S1). Although epidermal differentiation and HF specification were not prominent in the dorsal region of E13 embryos, genes with well-documented functions in these biological processes such as Zfp750 (Sen et al., 2012), Klf4 (Segre et al., 1999), Irf6 (Richardson et al., 2006) and numerous components of the Wnt signaling pathway were robustly upregulated. In contrast, Notum, a potent inhibitor of the Wnt signaling (Kakugawa et al., 2015), was decreased by ×24-fold (Figure 1C). In addition, genes of essential signaling pathways that are involved in skin and appendage development such as Notch, Eda/Edar, Fgf and Bmp were also upregulated (Figure 1C and Table S1). Using the same isolation strategy to additional embryos, we further confirmed the temporal induction of many of these genes in E9, E11 and E13 progenitors by qPCR (Figure 1D). Taken together, these results define profound and global changes of the transcriptome and signaling pathways accompanying the Krt8-to-Krt5 fate transition.
To probe the effect of the loss of ΔNp63 on epidermal progenitors, we next compared the transcriptome of ΔNp63 het and KO cells at E13. The complete loss of ΔNp63 transcripts in the KO cells was confirmed by RNA-seq quantification (Figure S2A). Genes characteristic of the epidermal fate and of the Wnt signaling pathway were conspicuously downregulated and genes associated with the Krt8+ progenitors and inhibition of the Wnt signaling such as Krt8 and Notum were upregulated, respectively (Figure 1E). Genes such as Krt14, Col17a1, Edaradd, Notch1 and Fst, which were highly induced during the Krt8-to-Krt5 transition, were strongly downregulated in E13 KO. Similar to Krt5, these genes largely failed to induce their expression in the KO (Figure 1E). Furthermore, components of Eda, Notch, Fgf and Bmp signaling pathways were also strongly reduced (Figure 1E). Overall, we detected 954 differentially expressed genes (p<0.01) with 520 downregulated and 434 upregulated in E13 KO (Table S2). Although some of these genes whose downregulation in ΔNp63 KO skin were previously reported by us and others (Laurikkala et al., 2006; Romano et al., 2012), these data revealed the global impact of ΔNp63. Indeed, the widespread role of ΔNp63 in driving the epidermal fate was confirmed by a pairwise gene set enrichment analysis (Subramanian et al., 2005). The E13 KO transcriptome was similar to the E9 transcriptome and negatively correlated with the E13 epidermal transcriptome (Figure 1F). A principal component analysis of transcriptome from multiple embryonic skin populations (Sennett et al., 2015) further illustrated a globally compromised epidermal fate specification in ΔNp63 KO (Figure 1G). To corroborate these genomic findings, we visualized expression of Krt5, Krt8, β-catenin and Lef1 by immunofluorescence (IF) staining. We observed strong Krt8 expression but very weak Krt5 expression in E13 KO epithelial cells (Figure 1H). Expression of β-catenin and Lef1 was largely reduced in the epidermal layer (Figure 1H). We also noticed the downregulation of β-catenin in the dermis, likely reflecting an indirect role of ΔNp63 to sustain β-catenin expression in these cells. Together, these data have revealed the profound changes in the transcriptome during epidermal fate specification and the widespread role of ΔNp63 in promoting the epidermal transcriptome and signaling pathways.
Stage-specific open chromatin landscape reveals differential TF usage in epidermal progenitors and adult epithelial SCs
To determine the dynamics of open chromatin landscape that underlie the profound transcriptomic differences, we performed an assay for transposase accessible chromatin followed by sequencing (ATAC-seq) in these embryonic progenitors (Buenrostro et al., 2013; Wang et al., 2016). Consistent with the transcriptome dynamics, the open chromatin states also changed dramatically from E9 to E13. For example, the Krt8 locus was marked as open chromatin at the transcription start site (TSS) only in E9 but not E13 cells, in contrast to the Krt14 locus, consistent with the drastic changes in mRNA levels (Figure 2A). In addition, strong open chromatin states in embryonic genes such as Lin28a and Sall4 were only observed at E9 and the open chromatin signal was completely lost at E13, underscoring the >200-fold downregulation in the RNA levels of these genes (Figure S2B). Thus, changes in the open chromatin states from E9 to E13 are correlated with the transcriptome dynamics during epidermal fate specification.
Figure 2. Differential TF usage is revealed by the dynamics of open chromatin regions during epidermal fate specification and embryonic-to-adult transition.

(A) ATAC-seq and RNA-seq tracks of the Krt8 and Krt14 loci, markers of immature epidermal and epidermal cells respectively, in E9 and E13 epidermal cells. Transcription start site (TSS) sites are marked in red boxes.
(B) K-means Clustering of open chromatin regions of E9 immature epidermis (E9), E13 epidermis (E13), HF stem cells (HF), IFE and E13 ΔNp63 KO (E13 KO). H3K4me3 ChIP-seq data from E14 epidermis are used to mark promoters.
(C) Top enriched TF motifs in clusters 10 and 11 as classified in (B).
(D) Top enriched TF motifs in clusters 12, 13 and 14 as classified in (B).
(E) ATAC-seq tracks of Fos in E9, E13, E13 KO epidermis, HFSC and IFE. Boxed region shows two AP2 binding sites on the TSS.
(F) Top enriched TF motifs in clusters 15, 16, 17, 18 and 19 as classified in (B). See also Figure S2.
ATAC-seq identifies accessible DNA regions within promoters (H3K4me3 marked regions near the TSS that are occupied by TFs and transcription machineries), enhancer regions occupied by TFs, and other regulatory elements such as those occupied by CTCF (Buenrostro et al., 2013). We aimed to globally identify stage-specific regulatory elements in E9 and E13 epidermal progenitors and E13 ΔNp63 KO and further compare them to those of interfollicular epidermal (IFE) progenitors (Latil et al., 2017) and HF-SCs (Wang et al., 2016) in adult, which we reported previously. We performed K means clustering of 113,061 open chromatin regions identified in all of these samples (Figure 2B). We observed largely unchanged ATAC-seq signals at the promoter regions and a small portion of enhancers across all stages (clusters 1–9), consistent with the notion that the accessibility of promoter regions is generally constant within the same cell type (Lara-Astiaso et al., 2014). In a majority of enhancer regions that are distal to promoters, however, dynamic changes in open chromatin landscape were readily detected. Two clusters (clusters 10/11) were strongly enriched in E9 cells whereas three clusters (clusters 12/13/14) showed increasing accessibility when transitioning from E9 to E13. Interestingly, despite severely compromised skin development in E13 ΔNp63 KO, chromatin accessibility was largely unchanged for thousands of regions in clusters 12 and 14 between E13 het and KO samples whereas the accessibility of the cluster 13 regions was strongly reduced in E13 KO (Figure 2B). These data identified ΔNp63-dependent (cluster 13) and -independent (clusters 12/14) open chromatins. We also detected one cluster of adult-specific open chromatin regions that was commonly observed in both IFE and HF-SCs (cluster 15), two clusters that were most prominently enriched in HF-SCs (clusters 16/17) and two clusters that were most prominently enriched in IFE progenitors (clusters 18/19) as well as one embryonic-associated region (cluster 20) (Figure 2B).
Because these stage-specific open chromatin regions most likely reflect temporal transcriptional control, we searched for enriched TF motifs in each of these clusters. The E9-specific open chromatins were enriched for TEAD and AP2α/γ binding sites (Figure 2C). The clusters 12 and 14, which were largely unaffected by the loss of ΔNp63, were also enriched for AP2α/γ, HoxC and TEAD binding sites (Figure 2D). The cluster 13 was most strongly enriched for p63 binding sites in addition to TEAD and AP2α/γ sites, confirming their dependency on ΔNp63. Because cluster 13 contained 5,934 open chromatin regions and it accounted for 38% of E13-enriched open chromatin regions, these observations indicated that ΔNp63 usage is a key feature of the E13 progenitors but also suggested a tantalizing possibility that other TFs such as AP2α/γ, HoxC and TEAD could continue to drive gene expression independently of ΔNp63.
In adult SCs, AP1, p63 and Klf4 binding sites were enriched in both IFE and HF-SC open chromatin regions whereas AP2α/γ, HoxC and TEAD, which were highly enriched in embryonic specific open chromatin regions, phased out, likely reflecting an embryonic-to-adult transition in TF usage. Interestingly, 6 out of 7 AP1 genes have AP2 binding sites at or near their promoter regions, indicating direct activation of AP1 genes by AP2 TFs (Figures 2E and S2C). The open chromatin states of these AP1 genes remained largely unchanged in E13 KO, further supporting their independence of ΔNp63. In adult, AP1, p63, NF1, Klf4 and Nfatc1 binding sites were enriched in HF-SC-specific open chromatin regions whereas p63, AP1, Klf4 and Gata3 binding sites were enriched in IFE-specific open chromatin regions (Figure 2F). These data suggest that: 1) a large number of open chromatin regions are differentially used in a stage-specific manner; 2) the same TFs such as ΔNp63, AP1 and Klf4 can act on different enhancers in IFE and HF-SCs, respectively; and 3) many TFs are differentially used during epidermal fate specification and during the progression from embryonic epidermal progenitors to adult skin SCs.
ΔNp63 governs epidermal fate specification by controlling the transcriptome and signaling networks
Our RNA-seq data indicated that key signaling pathways such as Wnt, Notch, Eda that are critical for skin and its appendages are activated during the Krt8-to-Krt5 transition. ATAC-seq comparison between E9 and E13 cells revealed a changing landscape of open chromatin regions, during which AP2α/γ and TEAD are widely used in both E9 and E13 whereas ΔNp63 usage is strongly enhanced from E9 to E13. To determine the mechanism of ΔNp63, we directly compared the open chromatin between E13 het and KO cells. We identified 5,856 open chromatin regions that were detected in E13 epidermal progenitors but failed to open properly (≥3-fold decreases in KO ATAC signals) in ΔNp63 KO, many of which were near or within the genes with important roles in the skin and also downregulated in the KO cells. The p63 motifs were the most prominently detected motifs in 57.1% (3,340 regions) of these 5,856 open chromatin regions. In the remaining 2,516 open chromatin regions, Tcf/Lef1 motifs were detected in 18% of them (Figure 3A), indicative of compromised transcriptional activities of Wnt signaling. Globally, ATAC signals in peaks harboring motifs for other highly used TFs such as AP2 were not changed whereas ATAC signals in peaks harboring p63 motifs were strongly reduced (Figure 3B).
Figure 3. ΔNp63 remodels open chromatin regions during epidermal fate specification.

(A) p63 motif was the most enriched motif in the depleted open chromatin regions in E13 KO. Tcf/Lef1 motif was highly enriched in the depleted open chromatin regions that do not contain p63 motif in E13 KO.
(B) Mean ATAC-seq signal intensity surrounding AP2 motifs and p63 motifs in E13 control and KO cells.
(C-E) ATAC-seq and RNA-seq tracks of known p63 targets: Zfp750, Irf6 and miR-205 (C), Wnt genes: Wnt10b, Fzd6 and β-catenin (D), and other signaling components: Notch1 and Fgfr2 (E) in E9, E13 and E13 KO epidermis, together with ΔNp63 ChIP-seq. Boxed regions mark the p63 enhancer. See also Figure S3.
Although previous studies have shown that several regulators in Wnt, Bmp, Fgf, Notch and Edar pathways were downregulated in p63 KO epithelial tissues (Laurikkala et al., 2006), it is largely unclear whether ΔNp63 directly regulates these genes through discrete enhancers. Our findings of numerous ΔNp63-dependent open chromatin regions together with RNA-seq data allowed us to identify direct targets of ΔNp63 on a genomic scale during epidermal fate specification. First, we identified ΔNp63-dependent and p63 motif-containing open chromatin regions as ΔNp63-bound enhancers and promoters. To further validate these regions as bona fide ΔNp63-recognized DNA elements, we performed ΔNp63 ChIP-seq in primary keratinocytes and found most of our identified ΔNp63 enhancers/promoters were indeed bound by ΔNp63 (see below). Most, if not all, previously identified ΔNp63 targets such as Zfp750 (Sen et al., 2012), Irf6 (Richardson et al., 2006) and miR-205 (Tucci et al., 2012) contained ΔNp63-dependent open chromatin peaks and were switched on during fate specification (Figure 3C). We found a large number of genes critically involved in epidermal and subsequent HF fate specification under direct regulation of ΔNp63. Judging by the RNA changes, the most prominently targeted pathways were Edar and Wnt/β-catenin. Although Edaradd was the only gene of the Edar pathway strongly affected (−176×) by the loss of ΔNp63, a single mis-sense mutation on Edaradd phenocopies Edar and Eda mutants (Headon et al., 2001). In comparison, four Wnt ligands, two Fzd receptors, Lef1 and β-catenin were strongly regulated by ΔNp63 (Figures 3D and S3A–E). The central role of ΔNp63 in governing the epidermal fate was further highlighted by the TF’s control of numerous core components of signaling pathways such as Notch, Fgf, Bmp (Figures 3E and S3F–I). These data suggest that ΔNp63 not only plays an essential role in driving the epidermal fate but also activates gene expression for signaling pathways, TFs and microRNAs that are required for subsequent epidermal and HF lineage formation. Our genomic datasets profiling both normal and ΔNp63 KO epidermal cells also reveal the requirement of ΔNp63 to remodel open chromatin regions for numerous critical regulators of skin at the onset of skin development.
Single-cell analysis reveals the requirement of ΔNp63 for specifying epidermal fate and inducing skin lineages
To resolve the cellular states and further interrogate the role of ΔNp63 during epidermal fate specification at the single-cell resolution, we randomly profiled a total of 8,339 cells isolated from the dorsal skin of WT, ΔNp63-GFP het and KO littermates at E13 and E15, respectively, with the 10× Genomics scRNA-seq platform. In each sample, we detected 8 distinct cell types including ×10% epithelial cells identified by their unique molecular signatures (Figures 4A–B and Table S3). Notably, all 8 cell populations were indistinguishable and largely overlapping when we visualized cellular states using t-distributed stochastic neighbor embedding (tSNE) between WT and ΔNp63-GFP het samples and between two KO samples in both stages, respectively (Figures S4A–B). These findings provided a molecular explanation for the indistinguishable phenotypes between WT and ΔNp63 het and also reflected the robustness and reproducibility of our scRNA-seq. Overall, the Krt5+ and Krt8+ epithelial populations were the most distinct cell populations found exclusively in the control (WT and het) and KO skin, respectively. Additionally, dermal cells showed more differences in E15 control and KO samples (see below).
Figure 4. Single cell analysis reveals ΔNp63-dependent epidermal fate specification and skin lineage formation.

(A-B) Distinct cell populations are detected in control (WT and Het) and KO (KO1 and KO2) samples from E13 (A) and E15 (B) dorsal skin by scRNA-seq.
(C) tSNE plot of epidermal cell populations of E13 control and KO. Epidermal cells are extracted from the Krt8+ and Krt5+ epidermal populations in (A). Magenta circle marks KO populations.
(D) Feature plots show expression of selected genes at the single-cell level in E13 control and KO epidermis.
(E) tSNE plot of epidermal cell populations of E15 control and KO. Epidermal cells are extracted from the Krt8+ and Krt5+ epidermal populations in (B). Magenta circle marks KO population.
(F-G) Feature plots show expression of selected genes at the single-cell level in E15 control and KO epidermis. Black circle marks distinct epidermal lineages in control and magenta circle marks KO populations.
(H) tSNE plot of dermal cell populations of E13 control and KO (left panel), and violin plot showing less Lef1+ cells in E13KO dermis (right panel). Dermal cells are extracted from (A). (I) tSNE plot of dermal cell populations of E15 control and KO. Black circle marks the dermal condensate, magenta circle marks a population of Ly6a+/Cd26+ dermal cells that is increased in KO. Dermal cells are extracted from (B).
(J) Feature plots show expression of dermal markers at the single-cell level in E15 control and KO dermis. Black and magenta circles annotate the same populations as in (I). See also Figure S4 and Table S3.
We next separated out epidermal cells for detailed analyses. We first focused on epithelial cells at E13 and used Seurat (Butler and Satija, 2017) to perform dimensionality reduction and generated t-SNE plot for the epithelial populations (Figure 4C and STAR Method). At this stage, epidermal progenitors from control skin were relatively homogenous sharing a similar transcriptome characteristic of initially specified basal progenitors with universal expression of Krt14, Wnt3a and Fzd10 whereas the KO cells still expressed Krt8 (Figure 4D). A few differentiated cells were also detected with the elevated expression of Notch1, Perp, Hes1, Krt1/10 and the reduced expression of basal genes such as Itgb4, marking the initial appearance of the suprabasal cells (Figures 4D and S4C). In contrast, the KO cells were uniformly Krt8+ and lacked the expression of Wnt components such as Wnt3a and Fzd10 as well as basal genes such as Itgb4 and Lama3, which are involved in the formation of basement membrane (Figures 4D and S4C). Notably, a KO population was strongly enriched for mesenchymal genes such as Dlk1, Fn1 and Vim (Figure S4C), reminiscent of epithelial-to-mesenchymal transition (EMT) (Latil et al., 2017). These results suggest that the KO cells fail to specify Krt5+ epidermal fate and to form the basement membrane for cell adhesion and signaling. Some KO cells transition toward a mesenchymal cellular state in the absence of ΔNp63 (see below).
At E15, the expression of epidermal differentiation markers was further elevated to form a distinct suprabasal cell populations (Figure 4E). Terminal differentiation markers such as Lor were readily detected in a subset of the suprabasal cells, indicative of the temporal progression of IFE differentiation (Figure 4F). HF progenitors emerged as a transcriptionally distinct population with robust expression of Sox9, Fgfr1, Pthlh (Figure 4F). We also detected a few cells with strong expression of Dkk4, which is a canonical target of Wnt/Lef1 and Eda/NF-κB and marks the earliest appearance of hair placode (Bazzi et al., 2007; Sick et al., 2006; Zhang et al., 2009). In contrast, the KO cells failed to generate discernible cellular heterogeneity with clearly demarcated populations of SCs and differentiated cells (Figure 4E). Strikingly, although these cells still expressed high levels of Krt8, they continued on a path of epidermal differentiation marked by high levels of differentiation genes such as Grhl3 and Zfp750 (Figure 4G).
Because the formation of dermal lineages such as the upper dermis that includes the dermal condensate (DC) and the lower dermis that expresses Sca1 (also known as Ly6a) is not completely understood (Driskell et al., 2013; Rinkevich et al., 2015), we used our temporal scRNA-seq data to resolve the formation of dermal cell lineages and analyze the role of ΔNp63 in priming the dermal microenvironment indirectly. At E13, despite the complete failure of the Krt8-to-Krt5 transition in the KO epidermis, the dermal cells were similar between the control and KO skin although the KO dermis had slightly less Lef1+ cells (Figure 4H). At E15, however, the dermal populations in control and KO skin became different. A DC population emerged as a distinct population in the control dermal cells and they were marked by high expression of Sox2, Ptch1, Ebf1, Lef1, Bmp4, Ptch1 and Fgfr1 (Figures 4I–J and S4D). We noted that the Lef1+ population was more widespread than the DC cluster, reflecting Wnt responsive but non-DC dermal cells (Figure S4D). In contrast, the DC cluster was conspicuously absent in the KO dermis (Figure 4I), consistent with the lack of hair placode formation in the KO epidermis. Interestingly, the expression of Wnt5a and Wnt11 was not changed in the KO dermis despite the failure of the DC formation (Figure S4E). This suggests that these dermal Wnt ligands are not sufficient to induce the DC fate. Instead, the KO dermal cells contained an increased population of Ly6a+/CD26+ cells (Figure 4J). The Ly6a+ population was proposed to be associated with the lower dermis but not the upper dermis, which contributes to the DC formation (Driskell et al., 2013). Indeed, when we visualized the dermal layers in the E15 KO skin using Sca1 (Ly6a) staining, the upper dermis marked by Sca1neg was strongly reduced whereas the lower dermis marked by Sca1high was expanded (Figure S4F). Taken together, these scRNA-seq data reveal 1) the requirement of ΔNp63 in specifying epidermal fate; 2) the basal cells in the epidermis and hair placode are not formed in the absence of ΔNp63; 3) the DC population is not formed and a Ly6a+/CD26+ population is expanded in the dermis of ΔNp63 KO skin; 4) some ΔNp63 KO epidermal cells transition toward an EMT state and undergo abnormal epidermal differentiation.
ΔNp63–independent transcriptional programs drive EMT and abnormal epidermal differentiation
To probe ΔNp63-independent transcriptional mechanisms that underlie the EMT and abnormal epidermal differentiation, we first searched for highly enriched TF motifs in the open chromatin regions of E13 KO cells. TEAD, AP2α/γ, Klf4 and, to a lesser extent, AP1 motifs were enriched, indicating that these TFs function in KO cells independently of ΔNp63 (Figure 5A). Next, we searched in the open chromatin regions surrounding the elevated EMT marker genes detected by scRNA-seq including Col1a1, Dlk, Fn1, Prrx1, Twist2 and Vim (Table S4) for enriched TF motifs. We found the enrichment for Sp1, CTCF, Klf4, AP2 and Smad motifs (Figure 5B). Indeed, AP2, Klf4 and Smad motifs were found in the open chromatin regions near the Vim locus (Figure 5C). Of note, ATAC-seq signals from a distal open chromatin region harboring these motifs were strongly elevated in KO (Figure 5C), correlating with the expression of Vim in KO but not control skin (Figure 5D). Intriguingly, these EMT genes and their associated TF motifs are reminiscent of EMT signatures observed in squamous cell carcinoma during tumorigenic EMT (Latil et al., 2017). Thus, the embryonic EMT state in the absence of ΔNp63 may have a similar molecular basis of the tumorigenic EMT, which is also accompanied by the loss of ΔNp63 expression. Consistent with their independence of ΔNp63, the mRNA levels of AP1, AP2 and Tead TFs were only slightly fluctuated (Figure 5E). In the case of Klf4, its mRNAs were downregulated in E13 KO (−2.1x, Figure 5E), which was supported by scRNA-seq (Figure 5F). This is because Klf4 is a target of Zfp750, which is a ΔNp63 target (Figure 3C) (Sen et al., 2012). However, by E15, Klf4 expression was recovered and more KO cells expressed Klf4 than control cells (Figure 5F). This suggests that Klf4 expression is also regulated by ΔNp63-independent mechanisms (see below). In support to RNA-seq data, the expression of AP2 and Tead in both control and KO skin was confirmed by IF staining (Figure 5G).
Figure 5. ΔNp63–independent TFs drive EMT and epidermal differentiation.

(A) Highly enriched TF motifs in the open chromatin regions of E13 KO.
(B) Highly enriched TF motifs in the open chromatin regions surrounding the EMT genes in E13 KO.
(C) ATAC-seq and TF motif tracks of Vim in E13, E13 KO epidermis. Boxed region shows AP2, Klf4 and Smad motifs in a distal enhancer to Vim that is elevated in E13 KO.
(D) IF staining of Vim, in control (ΔNp63-GFP het) and ΔNp63 KO (ΔNp63-GFP homozygous) at E15. White dashed lines mark the epidermal-dermal boundary.
(E) RNA expression fold changes of AP1, AP2, Tead and Klf4 in ΔNp63KO comparing to control at E13.
(F) Violin plot shows expression of Klf4 in E13 and E15 control and KO samples measured by scRNA-seq.
(G) IF staining of AP2 and pan-Tead in control and KO skin at E13.
(H) Highly enriched TF motifs in the open chromatin regions surrounding the differentiation genes in E13 KO.
(I) ATAC-seq and TF motif tracks of K1f4 in E9, E13, E13 KO epidermis, HFSC and IFE. Boxed region shows an AP1 motif near the TSS.
(J-K) IF staining of Klf4/K10 at E15 (J) and c-Jun/K5, c-Jun/K8 at E13 (K) in control and KO skin. Scale bars in D, G, J and K, 50 μm. See also Figure S5 and Tables S4–5.
Next, we investigated ΔNp63-independent, abnormal epidermal differentiation that was prominent in E15 KO. In open chromatin regions surrounding the differentiation markers (Table S5), Sp1, AP1 and Klf4 sites were highly enriched and AP1 motifs were often detected at the promoter region of these differentiation genes (Figures 5H and S5). Notably, multiple AP1 binding sites were identified in the Klf4 locus (Figure 5I), indicating that AP1 can drive Klf4 expression. Because AP1 and Klf4 were well-characterized for their role in driving epidermal differentiation (Eckert et al., 1997; Rorke et al., 2015; Segre et al., 1999; Sen et al., 2012), these data suggest that a part of IFE differentiation program mediated by AP1 and Klf4 was still executed in KO epithelial cells despite their inability to acquire Krt5+ fate and establish basal cell property. Indeed, Klf4 was also detected in a few Krt10+, differentiated epidermal cells in KO skin, lending further support to our genomic analyses (Figure 5J). Finally, c-Jun, an AP1 TF, was broadly expressed in most Krt8+ KO cells, in contrast to the suprabasal expression pattern observed in control skin (Figure 5K). Together, these data provide a molecular basis for ΔNp63-independent transcriptional programs that are mediated by AP2α/γ, TEAD, Klf4 and AP1 to drive an EMT state and abnormal epidermal differentiation in KO skin.
ΔNp63 directly activates the expression of Wnt components
Our data suggest that ΔNp63 directly binds to and opens discrete enhancer elements of many essential components of the Wnt/β-catenin, Eda, Notch and Bmp pathways at the onset of epidermal fate specification (Figures 3D–E and S3). We further validated the downregulation of several key genes in these pathways in E13 KO (Figure 6A) and used in situ hybridization to confirm the widespread expression of Fzd6 in E13 control but not KO epidermis (Figure 6B). Next, we used in vitro enhancer assays and in vivo enhancer deletion strategies to confirm the regulation of ΔNp63 on these enhancers (Figure 6C). We cloned individual enhancers and created point mutations specifically disrupting the p63 binding motif (Figures 6D and S6A). To directly test the ability of ΔNp63 to activate these enhancers, we examined enhancer activities with a luciferase assay in cultured keratinocytes, which express a high level of ΔNp63. We observed robust activation of the minimal promoter upon insertion of each of these enhancers, and disrupting the p63 binding motif strongly reduced the activation (Figure 6E). To further confirm the regulation of Wnt genes through these enhancers by ΔNp63 in vivo, we deleted individual enhancers of three Wnt genes using CRISPR-Cas9 mediated genome editing with two sgRNAs for each enhancer in mice (Figures 6F and S6B–C). In each single enhancer deletion, we observed the reduction of Wnt gene expression in the skin of multiple independently generated mouse lines quantified by qPCR (Figure 6G). Although we could not rule out the possibility that other TFs may also bind to the same enhancer regions, these enhancers are all bound by ΔNp63 and their open chromatin states depend upon ΔNp63, indicating the requirement of ΔNp63 expression for the function of these enhancers. For the Wnt10b enhancer, the CRISPR deleted region was located within the enhancer fragment (Figure 6C), whose activity was abolished by point mutations in the ΔNp63 binding motif. Together, these data reveal that ΔNp63 directly regulates the expression of Wnt machinery by binding to discrete enhancers and remodeling their chromatin during epidermal fate specification.
Figure 6. ΔNp63 directly activates the expression of Wnt machinery.

(A) qPCR validation of selected Wnt, Notch and Bmp gene expression in E13 control and KO epidermis (n=4, ***P<0.001).
(B) Detection of Fzd6 mRNA by in situ hybridization in control and KO dorsal skin at E13. White dashed line marks the epidermal-dermal boundary.
(C) ATAC-seq tracks of E13, E13 KO and p63 ChIP-seq show the position of a p63 enhancer for the luciferase assay (enhancer frag.) and CRISPR/Cas9 deletion (CRISPR del.) within the Wnt10b locus.
(D) The sequences of WT and mutated p63 enhancer elements of Wnt10b, β-catenin and Wnt4. Red circles highlight the most conserved nucleotides in the p63 motif that are mutated for the luciferase assay.
(E) ΔNp63-dependent enhancer activity is shown by luciferase assay. Blue bars represent the normalized luciferase activity (set at 100% for each enhancer) of the reporter fused with ΔNp63 enhancer regions from each gene; orange bars represent the luciferase activity of the reporter with mutated p63 binding sequences. Data shown are mean ± s.d. (n=5, ***P<0.001).
(F) Deletion of a p63 enhancer of Wnt10b by CRISPR-Cas9 genome editing in vivo. Two sgRNAs were used for the deletion. Arrows point to the predicted cleavage sites. Deleted enhancer is confirmed by genotyping and sequencing. Arrowheads point to WT and deletion (del) bands. Precise and identical deletion was observed in multiple mice.
(G) qPCR measurement of mRNA expression of Wnt3a, Wnt4 and Wnt10b in p63 enhancer KO (EnKO) generated by CRISPR-Cas9 genome editing. (n=3 for each enhancer KO, *P<0.05, **P<0.01, ***P<0.001).
(H-J) Wnt activities are shown by LacZ staining in control and ΔNp63 KO at E11 (H), E13 (I) and E15 (J). Red dashed lines mark the epidermal-dermal boundary. Red arrows point to dermal condensate and hair placode both with LacZ+ cells in (J). All scale bars, 50 μm. See also Figure S6.
Epidermal Wnt ligands are known to be critical for placode formation and dermal Wnt/β-catenin activities (Chen et al., 2012). To determine the function of ΔNp63-controlled epidermal Wnt expression, we examined Wnt activities in control and ΔNp63 KO embryonic skin using a Wnt reporter line (BAT-GAL) (Maretto et al., 2003). The lacZ signals were considerably weaker in ΔNp63 KO embryos in E11, E13 and E15 (Figure S6D). In control skin at E11, and more prominently at E13, a layer of dermal cells with a strong lacZ signal was located beneath the epidermal progenitors, prior to HF induction. In ΔNp63 KO skin, the layer of dermal cells with strong lacZ signals was not observed. Only a few dermal cells with reduced lacZ signals were scattered in the dermis, and showed no aggregation pattern toward the epidermal progenitors (Figures 6H–I). These observations confirmed that in the absence of ΔNp63, epidermal Wnt production is severely reduced, and this compromises Wnt activation in the dermis. Consistent with the lack of epidermal fate specification and the failure of hair placode formation revealed by our scRNA-seq data, ΔNp63 KO skin did not form hair placode and the DC by E15 as indicated by the Wnt reporter (Figure 6J). Together, these data confirm that ΔNp63-dependent epidermal gene expression including Wnt ligands is required to induce hair placode formation. In the absence of hair placode, the DC population is also not formed due to the absence of signals such as Fgf20 (Huh et al., 2013).
Activated Wnt signaling promotes epidermal fate specification
The Wnt/β-catenin signaling pathway has been well characterized for its role in inducing HFs (Chen et al., 2012; Gat et al., 1998; Huelsken et al., 2001; Zhang et al., 2009) and maintaining adult epidermal and HF lineages (Choi et al., 2013; Lim et al., 2013). In addition, widespread epidermal expression of Wnt ligands have been shown previously (Chen et al., 2012; Reddy et al., 2001; Zhang et al., 2009). However, it is unknown whether the Wnt/β-catenin signaling has any role in the initial epidermal fate specification. Our findings so far provided mechanistic insights into ΔNp63-dependent expression of the Wnt machinery between E9 and E13 (Figure 6) and the loss of Tcf/Lef1 motif-containing open chromatin was a prominent feature of E13 KO cells (Figure 3A). We hypothesized that the Wnt/β-catenin pathway promotes the Krt8-to-Krt5 transition at the early stage. To test this hypothesis, we used a Krt8-CreER model (Van Keymeulen et al., 2011) that allows genetic recombination in the Krt8+ progenitors by a single injection of tamoxifen at E9 (Figure S7A–B), a time point before the commonly used Krt14-Cre becomes active. We deleted β-catenin at E9 and examined the defects at E13. Lef1 expression was largely lost in the progenitors upon deletion of β-catenin (Figure 7A). Loss of β-catenin at the early stage strongly compromised the Krt8-to-Krt5 transition. In the E13 β-catenin cKO skin, Krt8 expression remained high whereas Krt5 induction was reduced, similar to the ΔNp63 KO phenotypes (Figure 7B). Furthermore, Krt1, a marker for epidermal differentiation, was detectable in control epidermis but largely absent from the cKO skin (Figure 7C). We also deleted β-catenin with a ΔNp63-Cre knock-in model (Pignon et al., 2013), in which the deletion was mosaic but also prior to the Krt8-to-Krt5 transition (Figure S7C). This allowed us to test the cell intrinsic role of activated Wnt signaling in epidermal fate specification. Indeed, only β-catenin deleted epithelial cells failed to transition from Krt8+ cells to Krt5+ cells at E13 (Figure 7D). In addition, we observed reduced signals of E-Cadherin and α-catenin in Krt8-CreER/β-catenin cKO skin (Figure S7D).
Figure 7. Active Wnt signaling promotes the robustness of epidermal fate specification.

(A) IF staining of β-catenin and Lef1 in control and Krt8-CreER/β-catenin cKO. White dashed lines mark the epidermal-dermal boundary.
(B-C) IF staining of K5/K8 (B) and K5/K1 (C) in control and Krt8-CreER/β-catenin cKO.
(D) IF staining of β-catenin/tdTomato (tdT) and K5/K8 in p63-Cre/β-catenin cKO. (E) IF staining of β-catenin in normal skin at E11, E13 and E15. White arrowheads point to cells with both cytoplasmic and nuclear signals of β-catenin at E11.
(F) Wnt activities are measured by LacZ staining in normal skin at E9, E11, E13 and E15. Black dashed lines mark the epidermal-dermal boundary. All scale bars in A-F, 50 μm.
(G) ATAC-seq and Tcf/Lef1 motif tracks of Krt14 in E9, E13, E13KO, together with a TCF ChIP-seq track. Boxed region shows the TCF/Lef1 motif in an open chromatin region. See also Figure S7 and Table S6.
To confirm that Wnt signaling is activated in early epidermal progenitors, we stained β-catenin in E11, E13 and E15 skin. We observed diffusing signals of β-catenin covering both cytoplasmic and nuclear compartments in E11 and, to a lesser extent, E13 progenitors but not in E15 IFE progenitors (Figure 7E). Furthermore, when we used the BAT-GAL mice to visualize Wnt active cells in early epidermal cells, we observed many LacZ+ cells in epidermal progenitors at E9 and E11 (Figure 7F). In contrast, LacZ+ cells became much more restricted in the epidermis at E13 and E15 (Figure 7F). These LacZ+ epidermal cells are likely HF progenitors that form hair placode (Zhang et al., 2009). We noted, however, both nuclear β-catenin signals and LacZ levels in early epidermal progenitors (E9 and E11) were weaker than the strong signals observed in hair placode and dermal condensate. To rule out potential cell extrinsic effect resulted from dermal Wnt activation, we deleted β-catenin in the dermis using a Pdgfra-CreER model at E9 and observed faithful Krt5 expression despite slightly reduced Lef1 expression in E13 epidermis (Figure S7E).
To begin to understand how active Wnt/β-catenin signaling regulates gene expression during the Krt8-to-Krt5 transition, we identified Tcf/Lef1 motif-containing open chromatin regions that are reduced in ΔNp63 KO cells and their associated genes (Table S6). Among these genes, Dkk4 is a well-known Wnt responding gene and Krt14 is an essential marker for Krt5+ epidermal progenitors. For the Krt14 locus, we further validated the predicted Tcf/Lef1 enhancer (Figure 7G) by using a previously published Tcf ChIP-seq dataset (Lien et al., 2014). These data indicate that Wnt signaling is transcriptionally active in these early epidermal progenitors.
Finally, to determine the effect of early β-catenin deletion for a long term, we examined Krt8-CreER/β-catenin and p63-Cre/β-catenin cKO skin at E15 and in adult, respectively. In contrast to the early Krt8-to-Krt5 transition defects observed in E13 skin, Krt5 was robustly expressed in these later stages (Figure S7F). In addition, IFE lineage was present whereas HF lineage was absent in Krt8-CreER/β-catenin cKO skin (Figure S7F). In p63-Cre/β-catenin cKO skin, we observed some HFs due to mosaic deletion of β-catenin (Figure S7F). These data suggest that early Wnt activation promotes the robustness of the Krt8-to-Krt5 transition but other TFs and signaling pathways can eventually compensate for the loss of β-catenin. Taken together, these data reveal that the rapid induction of Wnt/β-catenin in Krt8+ progenitors ×E9 establishes a critical window to promote robust epidermal fate specification in a cell intrinsic manner.
Discussion
The role of ΔNp63 in epidermal fate specification and epidermal lineage formation
We have provided a comprehensive analysis for the transcriptome and open chromatin landscape of Krt8+ progenitors, Krt5+ epidermal progenitors and ΔNp63 KO epidermal cells. Although ΔNp63 has been shown to maintain epidermal SC self-renewal in developmentally mature keratinocytes in both mouse and human (Senoo et al., 2007; Truong et al., 2006), the role of this master TF during embryonic skin development is far more widespread. At the single-cell level, the ability of ΔNp63 to establish a basal cell program and to activate the expression of essential components of many signaling pathways is required to execute epidermal fate specification, and these signaling pathways in turn generate cellular heterogeneity for epidermal lineage formation. Most notably, our study has illuminated a coordinated genetic circuit with which Krt8+ progenitors acquire the fate of Krt5+ epidermal cells and concurrently organize their dermal microenvironment by activating signaling pathways including Wnt through the action of ΔNp63. Given the direct and strong activation of multiple signaling pathways by ΔNp63, our findings also provide mechanistic links to further study the defects in teeth, hair, sweat glands and other skin appendages often observed in patients with ΔNp63 mutations (Celli et al., 1999).
The role of ΔNp63-independent programs in driving embryonic-to-adult transition and epidermal differentiation
Our comprehensive survey of open chromatin landscape among embryonic skin progenitors and adult skin epithelial SCs as well as ΔNp63 KO cells has revealed a stage-specific pattern of open chromatin, which reflect the dynamic usage of TFs in each stage. Guided by these genome-scale findings, we identify a ΔNp63-independent TF program mediated by AP2, AP1 and Klf4. Thus, despite the failure to specify the epidermal fate and to form SC lineages, ΔNp63 KO epithelial cells continue on a path of epidermal differentiation. These data provide mechanistic insights into previous findings of the persistence of epidermal differentiation markers despite of severely compromised epidermal fate specification (Yang et al., 1999).
Our data also reveal that the embryonic open chromatin is enriched for AP2 TFs whereas the adult open chromatin is enriched for AP1 TFs. Intriguingly, all 6 AP1 TFs that are expressed in the skin harbor AP2 motifs at or near their promoter regions, indicating an AP2-AP1 cascade of sequential TF activation during skin development. Interestingly, we also observed that a subset of ΔNp63 KO epidermal cells express EMT markers, similar to the EMT markers found in tumorigenic EMT (Latil et al., 2017). Our findings have provided a framework to study ΔNp63-independent transcriptome mediated by AP2, AP1, Klf4 and other TFs in in normal development and diseases.
The role of Wnt activation in early epidermal progenitors
We have provided mechanistic understanding of ΔNp63-dependent Wnt expression at the onset of epidermal fate specification. Our data suggest that Wnt signaling is active in early epidermal progenitors between E9 and E11 and promotes the robustness of epidermal gene expression. We note that the formation of DC is governed by Fgf20, a direct target of Eda and Wnt signaling in hair placode (Huh et al., 2013). Thus, ΔNp63-dependent activation of Eda and Wnt signaling is required to induce the DC fate indirectly likely through Fgf20 produced by hair placode cells. Because ΔNp63 transcriptionally activates the expression of Eda and Wnt components at the onset of skin development when HF is not formed, these data suggest that HF fate is intrinsically wired in the epigenome of these early epidermal progenitors. Collectively, ΔNp63-dependent Wnt expression provides a molecular basis for the coordination between epidermal and dermal cells during skin morphogenesis. Interestingly, p53-mediated Wnt expression in mouse embryonic stem cells and during mesendodermal differentiation has been reported (Lee et al., 2010; Wang et al., 2017). Given the similarity between p53 and p63 binding motifs, p53/63-mediated Wnt expression could be a widespread mechanism to activate Wnt signaling in many cell types.
In conclusion, our studies combining genetic mouse models with genome-wide interrogation of open chromatin and transcriptome at the single-cell level have provided key insights into skin development and the formation of epidermal SC lineages and their niche. These insights into transcription and signaling cascades that direct mammalian skin formation have broad implications for understanding the architecture of genetic regulatory circuits for tissue development, and should help guide the precise engineering of epidermal and dermal cells to regenerate fully functional skin.
STAR Method
Contact for Reagent and Resource Sharing
Further information and requests for resources and reagents should be directed to and will be fulfilled by the Lead Contact Rui Yi (yir@colorado.edu).
Experimental Model and Subject Details
Mice.
Mice were housed in an AAALAC accredited animal facility at the University of Colorado Boulder under barrier laboratory conditions in a temperature- and relative humidity-controlled (i.e., 20 ± 1 C and 40%, respectively) environment with a normal 12-h light-dark cycle. Mice were housed in sterile, static filter-top shoebox caging, with sanichip bedding, nestlet enrichment, irradiated food and R/O water available ad libitum.
The following mouse lines were used: Np63-GFP (Romano et al., 2012), Ctnnb1 fl/fl (Jackson Lab, #004152), Krt8-CreER (Jackson Lab, #017947), Pdgfra-CreER (Jackson Lab, #018280), BAT-GAL (Jackson Lab, #005317), Np63-Cre (Jackson Lab, #024564) and Rosa26-LSL-tdTomato (Jackson Lab, #021876).
Krt8-CreER and Pdgfra-CreER induction was performed in pregnant female animals at embryonic day 9 (E9) and analyzed at E13.Tamoxifen dissolved in 10% Ethonal and 90% peanut oil (20mg/ml) was injected into pregnant females (4mg/animal) by intraperitoneal (IP) injection. All animal experiments were approved by the IACUC at the University of Colorado Boulder. For all experiments that used mouse embryos, male and female embryos were used indistinguishably because no differences were detected at the phenotypical level between male and female embryos.
Method Details
Flow cytometry.
ΔNp63-GFP mice were used for isolating epidermal cells. Entire E9 embryos were digested in 0.05% Trypsin at 37°C for 5min. For E13 embryos, dorsal skin was dissected from GFP heterozygous (Het) or homozygous (KO) embryos. Skin samples were incubated in 0.5% collagenase (Worthington, LS004188) at 37°C for 30min. Cells were spun down for 10min at 300g and then incubated in 0.05% Trypsin (Gibco) at 37°C for 5min. Single cell suspension was used to sort for GFP+ cells on Moflo XDP cell sorter (Beckman Coulter).
Immunofluorescence and staining protocol for BAT-gal mice.
Immunofluorescence staining was performed as described previously (Wang et al., 2016). Briefly, OCT sections were fixed for 10 min in 4% PFA in PBS and washed three times for 5 min in PBS at RT. When staining with mouse monoclonal antibodies, we used the reagents and protocol from the MOM Basic kit (Vector Labs). In other cases, the following block/diluent solution was used: 2.5% NGS, 2.5% NDS, 2% gelatin and 0.3% Triton X-100 in PBS. The following primary antibodies were used: P63 (1:500, Cell Signaling, #4892), Keratin 5 (K5, 1:2000, Covance, #SIG-3475), Keratin 1 (K1, 1:500, Covance, # PRB-165P), Keratin 8(K8, 1:2000, Abcam,#ab14053), Lef1 (1:500,Cell signaling, #9383s), β-Catenin (1:1000, BD Biosciences, #610153 ), Sca1 (1:100, R&D systems, #MAB1226-SP), Keratin 10 (1:1000, Thermal Fisher, #MA5–13705), Klf4 (1:100,R&D systems,#AF3158), c-Jun (1:250, Cell Signaling, #9165S), Klf4 (1:100, R&D systems, #AF3158), AP2 (1:250,Abcam, #ab52222), Pan-Tead (1:100, Cell Signaling, #13295), Vimentin (1:100, Cell Signaling, #13295), α-catenin(1:500, Cell Signaling, #3236), E-cadherin (1:500, Gift from E. Fuchs Rockefeller University). For X-gal staining, embryos of BAT-gal mice at different stages (E9, E11, E13 and E15) were prefixed in 4% PFA for 1h at 4°C, washed three times and then incubated in staining solution containing 1mg/ml X-gal at 37°C overnight. After post-fixation in 4% PFA overnight at 4°C followed by dehydration in 30% sucrose (room temperature, 5–6 h), embryos were then embedded in OCT compound. The frozen samples were cut into 10 μm sections using a Leica 1900 cryostat. Eosin was used as the counterstain. Images were obtained using a Leica DM5500B microscope with a Leica camera (bright field) or Hamamatsu C1060–10B camera (fluorescence) and processed with MetaMorph (MDS Analytical Technologies). Confocal imaging was performed using a Nikon A1 laser-scanning confocal microscope and acquired with NIS Elements (Nikon) software in the University of Colorado Boulder, Light Microscopy Core Facility.
Real-time PCR.
Total RNAs were isolated using TRIZOL reagent (Invitrogen). 100ng-1ug of total RNA was reverse-transcribed using SuperScript III first-strand synthesis supermix (Invitrogen). Real-time PCR was performed using iQ SYBR Green Supermix system (Bio-Rad) on a CFX384 real-time machine (Bio-Rad). Differences between samples and controls were calculated using the 2−ΔΔ(Ct) method. All qPCR primers are listed in table S7.
In situ hybridization.
In situ probe for Fzd6 was prepared following the manual of DIG RNA labeling kit (Roche, #11175025910). The Fzd6 fragment was amplified from cDNA. These fragments were validated by sequencing and inserted into multiple cloning sites of pSPT19. Standard RNA labeling reaction was performed according to the manufacture’s manual. In situ hybridization was performed as previously described (Wang et al., 2013). Briefly, frozen skin sections were fixed and permeabilized before incubation with in situ probes overnight. The signals were visualized with NBT/BCIP reagents.
CRISPR-Cas9 genome editing in mice.
sgRNAs were designed according to the website http://portals.broadinstitute.org/gpp/public/analysis-tools/sgrna-design. Two sgRNAs were picked for the targeted region for deletion based on previous publication (Ran et al., 2013). The sgRNA target sequences for Wnt10b, Wnt3a and Wnt4 were listed in Figure 6 and related Figure S6. Following the cloning protocol released by Feng Zhang’s lab, each sgRNA was cloned into the PX459 vector. In-vitro transcription of sgRNAs was performed according to the manual of MEGAshortscript kit (Ambion, #AM1354) and purified using MEGAclear kit (Ambion, #AM1908). Purified sgRNAs together with Cas9 mRNA were mixed and prepared for mouse injection.
DNA cloning, transfection and luciferase assay.
PCR fragments for Wnt10b, Wnt4, β-catenin, Edaradd, Bmpr1b, Myc and Krt14 containing P63 binding motif were amplified from mouse genomic DNA. The primers are listed in table S7. These fragments were validated by sequencing and inserted into multiple cloning sites of the pGL4.23 plasmid (Promega). Mutations at target sites were obtained by recombinant PCR. Plasmids were transfected into mouse keratinocyte cells. Dual-luciferase assays were carried as described previously (Wang et al., 2013). Briefly, 50ng of Firefly luciferase reporter, 2ng of Renilla luciferase control and 348ng of MIGR empty vector were transfected into proliferative keratinocytes using TransIT-LT1 reagents (Mirus). Relative luciferase activities were measured 48h after transfection using the Dual-Luciferase Assay Reporter System (Promega).
RNA-seq assay.
Total RNAs from FACS-purified cells were isolated using TRIZOL (Invitrogen) and the quality was assessed by Agilent 2100 bioanalyzer. Libraries were prepared using SMARTer Stranded RNA-seq kit and sequenced at Genomics/Microarray Core Facility at University of Colorado Denver on Illumina Hiseq 2000, 2500 or 4000. Three biological replicates were used for E9 het, E13 het and E13 KO RNA-seq.
RNA-seq analysis.
RNA-seq reads (120 nt, single-ended) were aligned to the mouse genome (NCBI37/mm10) using TopHat2 (version 2.0.13) (Kim et al., 2013). Data tracks were visualized by Integrative Genomics Viewer (IGV) (Robinson et al., 2011). Expression of each gene was calculated from the resulting alignment bam file by HTSeq-count (Anders et al., 2015). Differentially expressed genes were determined using R package edgeR (Robinson et al., 2010) with p value smaller than 0.01 and two-fold changes as the cutoff.
ATAC-seq and ChIP-seq.
Assay for transposes accessible chromatin followed by sequencing (ATAC-seq) was performed as previously described (Wang et al., 2016). ChIP experiments were performed using the ChIP-IT Express kit (Active Motif, #53008), following the manufacture’s protocol. P63 antibody was purchased from Cell signaling (#4892). Two biological replicates were used for E9 het, three biological replicates were used for E13 het, three biological replicates were used for E13 KO. One sample was used for p63 ChIP-seq.
Single-cell RNA-seq analysis.
Single-cell RNAseq was performed according to manufacturer’s instruction (10X Genomics). Two pairs of WT, ΔNp63-GFP het and ΔNp63-GFP KO were assayed at E13 and E15, respectively. Each sample was targeted to obtain ×1,000 cells. Single-cell RNAseq reads were sequenced on Illumina Hi-Seq 4000 and mapped to mouse genome (NCBI37/mm10) using Cellranger (version 1.3.1) (Zheng et al., 2017). Different samples were aggregated using “cellranger aggr” command with normalization using mapped reads. Cell populations were visualized using Loupe Cell Browser.
For epidermal and dermal sub-population analysis, the sub-population information was extracted from the cellranger cluster analysis and then used as input for Seurat re-analysis (version 1.4) (Butler and Satija, 2017). The detailed information for cell number in all populations in our study is listed below.
| Cell population | Cell number | Figure | Cell population | Cell number | Figure |
|---|---|---|---|---|---|
| E13WT | 929 cells | Figure S4A | E15WT | 633 cells | Figure S4B |
| E13Het | 1223 cells | Figure S4A | E15Het | 1087 cells | Figure S4B |
| E13KO1 | 1108 cells | Figure S4A | E15KO1 | 1122 cells | Figure S4B |
| E13KO2 | 731 cells | Figure S4A | E15KO2 | 1506 cells | Figure S4B |
| El3 total | 3991 cells | Figure 4A | El5 total | 4348 cells | Figure 4B |
| E13 Epi | 566 cells | Figures 4C–D, S4C | El5 Epi | 250 cells | Figures 4E–G |
| El3 Dermal | 2745 cells | Figure 4H | El5 Dermal | 2998 cells | Figures 4I–J, S4D |
Quantification and Statistical Analysis
Statistical analysis.
Unpaired one-way Student’s t-test was performed and the 0.05 level of confidence was accepted for statistical significance. For all experiments with error bars, the standard deviation (s.d.) was calculated to indicate the variation within each experiment. For all measurements, at least three biological replicates were chosen as the minimum number necessary to achieve statistically significant differences between groups. No statistical method was used to pre-determine the sample size. The experiments were not randomized. The investigators were not blinded to allocation during experiments and outcome assessment. For single cell RNA-seq analysis, the cluster tendency of E13 and E15 epidermal populations were calculated by Hopkin’s statistics.
ATAC-seq alignment and peak calling.
ATAC-seq reads (100 nt or 126 nt, single-ended) were aligned to the mouse genome (NCBI37/mm10) using Bowtie2 (version 2.2.3) (Langmead and Salzberg, 2012) using option of “-local”. Mitochondrial reads were excluded from downstream analysis. Data tracks were visualized by Integrative Genomics Viewer (IGV). Peak calling was performed on each individual sample by MACS2 (version 2.0.9) (Zhang et al., 2008) with parameter of “-nomodel -q 1e-3”. Peaks from different ATAC-seq samples were merged for downstream analysis.
Differential peak analysis and motif analysis.
Pairwise comparisons of ATAC peaks between two conditions were performed using R package edgeR, with reads count of each peak calculated by HTSeq-count. Significance was defined as p value smaller than 0.05 and a fold change threshold of 3. De novo motif search was performed using the script of findMotifsGenome.pl in the HOMER package (Heinz et al., 2010) with a parameter of “-size given”. For the motif search in E9 het, E13 het and E13 KO peaks, a default mm10 genomic background was used; for the motif search in differentially opened peaks, non-changed ATAC peaks (less than 1.5 fold) were used as the background. Incidences of specific motifs were examined by the script of annotatePeaks.pl in the HOMER package.
K-means Clustering of ATAC peaks.
To compare open chromatin signal across multiple samples, K-means Clustering was performed using seqMINER (version 1.3.4) (Ye et al., 2011). 18 Million randomly sampled mapped read from each sample were used as input. Peaks called by MACS2 for all the samples were combined and merged using bedtools (version 2.25.0) (Quinlan and Hall, 2010); and then used as genome coordinate. Signals were calculated in a 1 kb region (±500 bp) surrounding the center of the peak with 50 nt bin.
Gene set enrichment analysis.
GSEA was performed using ranked fold change values (E13KO over E13het) against two datasets (E9het over E13het enriched signature gene dataset and E13het over E9het enriched signature gene dataset). The enrichment score was calculated according to the GSEA documentation.
Principal component analysis.
Transcriptome profiling of E14 epidermal, E14 placode, E14 dermal condensate and E14 dermal fibroblast were obtained from Sennett R. et al. Normalized read counts used for PCA were generated using R package DEseq2 (Love et al., 2014). The read counts were log transformed and lines containing missing values were excluded. The remaining data were further down-sized by selecting genes with normalized read counts > 500 in at least one of the samples. A total of 6904 genes were selected for PCA. PCA was performed using the function of prcomp in R and the first two principal components were plotted.
Data and Software Availability
Data Deposition and Access.
All sequencing data are deposited to NCBI GEO database with the accession numbers GSE97213 and GSE102086.
Link:
https://www.ncbi.nlm.nih.gov/geo/query/acc.cgi?token=ularamyirpsnzed&acc=GSE97213
https://www.ncbi.nlm.nih.gov/geo/query/acc.cgi?acc=GSE102086
Supplementary Material
Transcriptome and open chromatin change profoundly during epidermal specification
ΔNp63 remodels epidermal open chromatin and activates Wnt signaling in the skin
Single-cell analyses reveal ΔNp63-depdent and -independent gene regulation programs
ΔNp63-dependent epidermal fate specification orchestrates dermal lineage formation
Acknowledgments
We thank T. Cech, P. Muhlrad and D. Roop for comments and all members of the Yi laboratory for suggestions. We thank B. Gao and K. Diener for single-cell experiments and sequencing, Y. Han for FACS. This work was supported by National Institute of Health AR059697, AR059697–07S1, AR066703, AR071435 and an American Cancer Society Research Scholar Award 124718-RSG-13-197-01-DDC (all to R.Y.).
Footnotes
Publisher's Disclaimer: This is a PDF file of an unedited manuscript that has been accepted for publication. As a service to our customers we are providing this early version of the manuscript. The manuscript will undergo copyediting, typesetting, and review of the resulting proof before it is published in its final citable form. Please note that during the production process errors may be discovered which could affect the content, and all legal disclaimers that apply to the journal pertain.
Declaration of Interests
The authors declare no competing interests.
References
- Anders S, Pyl PT, and Huber W (2015). HTSeq--a Python framework to work with high-throughput sequencing data. Bioinformatics 31, 166–169. [DOI] [PMC free article] [PubMed] [Google Scholar]
- Bao X, Rubin AJ, Qu K, Zhang J, Giresi PG, Chang HY, and Khavari PA (2015). A novel ATAC-seq approach reveals lineage-specific reinforcement of the open chromatin landscape via cooperation between BAF and p63. Genome Biol 16, 284. [DOI] [PMC free article] [PubMed] [Google Scholar]
- Bazzi H, Fantauzzo KA, Richardson GD, Jahoda CAB, and Christiano AM (2007). The Wnt inhibitor, Dickkopf 4, is induced by canonical Wnt signaling during ectodermal appendage morphogenesis. Dev. Biol 305, 498–507. [DOI] [PubMed] [Google Scholar]
- Blanpain C, and Fuchs E (2006). Epidermal stem cells of the skin. Annu. Rev. Cell Dev. Biol 22, 339–373. [DOI] [PMC free article] [PubMed] [Google Scholar]
- Buenrostro JD, Giresi PG, Zaba LC, Chang HY, and Greenleaf WJ (2013). Transposition of native chromatin for fast and sensitive epigenomic profiling of open chromatin, DNA-binding proteins and nucleosome position. Nat Meth 10, 1213–1218. [DOI] [PMC free article] [PubMed] [Google Scholar]
- Butler A, and Satija R (2017). Integrated analysis of single cell transcriptomic data across conditions, technologies, and species. BioRxiv 164889. [DOI] [PMC free article] [PubMed] [Google Scholar]
- Celli J, Duijf P, Hamel BC, Bamshad M, Kramer B, Smits AP, Newbury-Ecob R, Hennekam RC, Van Buggenhout G, van Haeringen A, et al. (1999). Heterozygous germline mutations in the p53 homolog p63 are the cause of EEC syndrome. Cell 99, 143–153. [DOI] [PubMed] [Google Scholar]
- Chen D, Jarrell A, Guo C, Lang R, and Atit R (2012). Dermal β-catenin activity in response to epidermal Wnt ligands is required for fibroblast proliferation and hair follicle initiation. Development 139, 1522–1533. [DOI] [PMC free article] [PubMed] [Google Scholar]
- Choi YS, Zhang Y, Xu M, Yang Y, Ito M, Peng T, Cui Z, Nagy A, Hadjantonakis A-K, Lang RA, et al. (2013). Distinct functions for Wnt/β-catenin in hair follicle stem cell proliferation and survival and interfollicular epidermal homeostasis. Cell Stem Cell 13, 720–733. [DOI] [PMC free article] [PubMed] [Google Scholar]
- Crum CP, and McKeon FD (2010). p63 in epithelial survival, germ cell surveillance, and neoplasia. Annu Rev Pathol 5, 349–371. [DOI] [PubMed] [Google Scholar]
- Dhouailly D (1973). Dermo-epidermal interactions between birds and mammals: differentiation of cutaneous appendages. Development 30, 587–603. [PubMed] [Google Scholar]
- Driskell RR, Lichtenberger BM, Hoste E, Kretzschmar K, Simons BD, Charalambous M, Ferron SR, Herault Y, Pavlovic G, Ferguson-Smith AC, et al. (2013). Distinct fibroblast lineages determine dermal architecture in skin development and repair. Nature 504, 277–281. [DOI] [PMC free article] [PubMed] [Google Scholar]
- Eckert RL, Crish JF, Banks EB, and Welter JF (1997). The epidermis: genes on - genes off. J. Invest. Dermatol 109, 501–509. [DOI] [PubMed] [Google Scholar]
- Gat U, DasGupta R, Degenstein L, and Fuchs E (1998). De Novo hair follicle morphogenesis and hair tumors in mice expressing a truncated beta-catenin in skin. Cell 95, 605–614. [DOI] [PubMed] [Google Scholar]
- Hardy MH (1992). The secret life of the hair follicle. Trends Genet 8, 55–61. [DOI] [PubMed] [Google Scholar]
- Headon DJ, Emmal SA, Ferguson BM, Tucker AS, Justice MJ, Sharpe PT, Zonana J, and Overbeek PA (2001). Gene defect in ectodermal dysplasia implicates a death domain adapter in development. Nature 414, 913–916. [DOI] [PubMed] [Google Scholar]
- Heinz S, Benner C, Spann N, Bertolino E, Lin YC, Laslo P, Cheng JX, Murre C, Singh H, and Glass CK (2010). Simple Combinations of Lineage-Determining Transcription Factors Prime cis-Regulatory Elements Required for Macrophage and B Cell Identities. Molecular Cell 38, 576–589. [DOI] [PMC free article] [PubMed] [Google Scholar]
- Huelsken J, Vogel R, Erdmann B, Cotsarelis G, and Birchmeier W (2001). beta-Catenin controls hair follicle morphogenesis and stem cell differentiation in the skin. Cell 105, 533–545. [DOI] [PubMed] [Google Scholar]
- Huh S-H, Närhi K, Lindfors PH, Häärä O, Yang L, Ornitz DM, and Mikkola ML (2013). Fgf20 governs formation of primary and secondary dermal condensations in developing hair follicles. Genes Dev 27, 450–458. [DOI] [PMC free article] [PubMed] [Google Scholar]
- Kakugawa S, Langton PF, Zebisch M, Howell SA, Chang T-H, Liu Y, Feizi T, Bineva G, O’Reilly N, Snijders AP, et al. (2015). Notum deacylates Wnt proteins to suppress signalling activity. Nature 519, 187–192. [DOI] [PMC free article] [PubMed] [Google Scholar]
- Kim D, Pertea G, Trapnell C, Pimentel H, Kelley R, and Salzberg SL (2013). TopHat2: accurate alignment of transcriptomes in the presence of insertions, deletions and gene fusions. Genome Biology 14, R36. [DOI] [PMC free article] [PubMed] [Google Scholar]
- Langmead B, and Salzberg SL (2012). Fast gapped-read alignment with Bowtie 2. Nat. Methods 9, 357–359. [DOI] [PMC free article] [PubMed] [Google Scholar]
- Lara-Astiaso D, Weiner A, Lorenzo-Vivas E, Zaretsky I, Jaitin DA, David E, Keren-Shaul H, Mildner A, Winter D, Jung S, et al. (2014). Chromatin state dynamics during blood formation. Science 345, 943–949. [DOI] [PMC free article] [PubMed] [Google Scholar]
- Latil M, Nassar D, Beck B, Boumahdi S, Wang L, Brisebarre A, Dubois C, Nkusi E, Lenglez S, Checinska A, et al. (2017). Cell-Type-Specific Chromatin States Differentially Prime Squamous Cell Carcinoma Tumor-Initiating Cells for Epithelial to Mesenchymal Transition. Cell Stem Cell 20, 191–204.e5. [DOI] [PMC free article] [PubMed] [Google Scholar]
- Laurikkala J, Mikkola ML, James M, Tummers M, Mills AA, and Thesleff I (2006). p63 regulates multiple signalling pathways required for ectodermal organogenesis and differentiation. Development 133, 1553–1563. [DOI] [PubMed] [Google Scholar]
- Lee K-H, Li M, Michalowski AM, Zhang X, Liao H, Chen L, Xu Y, Wu X, and Huang J (2010). A genomewide study identifies the Wnt signaling pathway as a major target of p53 in murine embryonic stem cells. Proc. Natl. Acad. Sci. U.S.A 107, 69–74. [DOI] [PMC free article] [PubMed] [Google Scholar]
- Lien W-H, Polak L, Lin M, Lay K, Zheng D, and Fuchs E (2014). In vivo transcriptional governance of hair follicle stem cells by canonical Wnt regulators. Nat. Cell Biol 16, 179–190. [DOI] [PMC free article] [PubMed] [Google Scholar]
- Lim X, Tan SH, Koh WLC, Chau RMW, Yan KS, Kuo CJ, van Amerongen R, Klein AM, and Nusse R (2013). Interfollicular epidermal stem cells self-renew via autocrine Wnt signaling. Science 342, 1226–1230. [DOI] [PMC free article] [PubMed] [Google Scholar]
- Love MI, Huber W, and Anders S (2014). Moderated estimation of fold change and dispersion for RNA-seq data with DESeq2. Genome Biol 15, 550. [DOI] [PMC free article] [PubMed] [Google Scholar]
- Lu CP, Polak L, Keyes BE, and Fuchs E (2016). Spatiotemporal antagonism in mesenchymal-epithelial signaling in sweat versus hair fate decision. Science 354. [DOI] [PMC free article] [PubMed] [Google Scholar]
- Maretto S, Cordenonsi M, Dupont S, Braghetta P, Broccoli V, Hassan AB, Volpin D, Bressan GM, and Piccolo S (2003). Mapping Wnt/beta-catenin signaling during mouse development and in colorectal tumors. Proc. Natl. Acad. Sci. U.S.A 100, 3299–3304. [DOI] [PMC free article] [PubMed] [Google Scholar]
- Medawar A, Virolle T, Rostagno P, de la Forest-Divonne S, Gambaro K, Rouleau M, and Aberdam D (2008). ΔNp63 Is Essential for Epidermal Commitment of Embryonic Stem Cells. PLOS ONE 3, e3441. [DOI] [PMC free article] [PubMed] [Google Scholar]
- Pignon J-C, Grisanzio C, Geng Y, Song J, Shivdasani RA, and Signoretti S (2013). p63-expressing cells are the stem cells of developing prostate, bladder, and colorectal epithelia. Proc. Natl. Acad. Sci. U.S.A 110, 8105–8110. [DOI] [PMC free article] [PubMed] [Google Scholar]
- Quinlan AR, and Hall IM (2010). BEDTools: a flexible suite of utilities for comparing genomic features. Bioinformatics 26, 841–842. [DOI] [PMC free article] [PubMed] [Google Scholar]
- Ran FA, Hsu PD, Lin C-Y, Gootenberg JS, Konermann S, Trevino AE, Scott DA, Inoue A, Matoba S, Zhang Y, et al. (2013). Double Nicking by RNA-Guided CRISPR Cas9 for Enhanced Genome Editing Specificity. Cell 154, 1380–1389. [DOI] [PMC free article] [PubMed] [Google Scholar]
- Reddy S, Andl T, Bagasra A, Lu MM, Epstein DJ, Morrisey EE, and Millar SE (2001). Characterization of Wnt gene expression in developing and postnatal hair follicles and identification of Wnt5a as a target of Sonic hedgehog in hair follicle morphogenesis. Mech. Dev 107, 69–82. [DOI] [PubMed] [Google Scholar]
- Richardson RJ, Dixon J, Malhotra S, Hardman MJ, Knowles L, Boot-Handford RP, Shore P, Whitmarsh A, and Dixon MJ (2006). Irf6 is a key determinant of the keratinocyte proliferation-differentiation switch. Nat Genet 38, 1329–1334. [DOI] [PubMed] [Google Scholar]
- Rinkevich Y, Walmsley GG, Hu MS, Maan ZN, Newman AM, Drukker M, Januszyk M, Krampitz GW, Gurtner GC, Lorenz HP, et al. (2015). Skin fibrosis. Identification and isolation of a dermal lineage with intrinsic fibrogenic potential. Science 348, aaa2151. [DOI] [PMC free article] [PubMed] [Google Scholar]
- Robinson JT, Thorvaldsdóttir H, Winckler W, Guttman M, Lander ES, Getz G, and Mesirov JP (2011). Integrative genomics viewer. Nat Biotech 29, 24–26. [DOI] [PMC free article] [PubMed] [Google Scholar]
- Robinson MD, McCarthy DJ, and Smyth GK (2010). edgeR: a Bioconductor package for differential expression analysis of digital gene expression data. Bioinformatics 26, 139–140. [DOI] [PMC free article] [PubMed] [Google Scholar]
- Romano R-A, Smalley K, Magraw C, Serna VA, Kurita T, Raghavan S, and Sinha S (2012). ΔNp63 knockout mice reveal its indispensable role as a master regulator of epithelial development and differentiation. Development 139, 772–782. [DOI] [PMC free article] [PubMed] [Google Scholar]
- Rorke EA, Adhikary G, Young CA, Roop DR, and Eckert RL (2015). Suppressing AP1 factor signaling in the suprabasal epidermis produces a keratoderma phenotype. J. Invest. Dermatol 135, 170–180. [DOI] [PMC free article] [PubMed] [Google Scholar] [Research Misconduct Found]
- Schneider MR, Schmidt-Ullrich R, and Paus R (2009). The hair follicle as a dynamic miniorgan. Curr. Biol 19, R132–142. [DOI] [PubMed] [Google Scholar]
- Segre JA, Bauer C, and Fuchs E (1999). Klf4 is a transcription factor required for establishing the barrier function of the skin. Nat. Genet 22, 356–360. [DOI] [PubMed] [Google Scholar]
- Sen GL, Boxer LD, Webster DE, Bussat RT, Qu K, Zarnegar BJ, Johnston D, Siprashvili Z, and Khavari PA (2012). ZNF750 is a p63 target gene that induces KLF4 to drive terminal epidermal differentiation. Dev. Cell 22, 669–677. [DOI] [PMC free article] [PubMed] [Google Scholar]
- Sennett R, Wang Z, Rezza A, Grisanti L, Roitershtein N, Sicchio C, Mok KW, Heitman NJ, Clavel C, Ma’ayan A, et al. (2015). An Integrated Transcriptome Atlas of Embryonic Hair Follicle Progenitors, Their Niche, and the Developing Skin. Developmental Cell 34, 577–591. [DOI] [PMC free article] [PubMed] [Google Scholar]
- Senoo M, Pinto F, Crum CP, and McKeon F (2007). p63 Is essential for the proliferative potential of stem cells in stratified epithelia. Cell 129, 523–536. [DOI] [PubMed] [Google Scholar]
- Shalom-Feuerstein R, Lena AM, Zhou H, De La Forest Divonne S, Van Bokhoven H, Candi E, Melino G, and Aberdam D (2011). ΔNp63 is an ectodermal gatekeeper of epidermal morphogenesis. Cell Death Differ 18, 887–896. [DOI] [PMC free article] [PubMed] [Google Scholar]
- Sick S, Reinker S, Timmer J, and Schlake T (2006). WNT and DKK determine hair follicle spacing through a reaction-diffusion mechanism. Science 314, 1447–1450. [DOI] [PubMed] [Google Scholar]
- Subramanian A, Tamayo P, Mootha VK, Mukherjee S, Ebert BL, Gillette MA, Paulovich A, Pomeroy SL, Golub TR, Lander ES, et al. (2005). Gene set enrichment analysis: A knowledge-based approach for interpreting genome-wide expression profiles. PNAS 102, 15545–15550. [DOI] [PMC free article] [PubMed] [Google Scholar]
- Takahashi K, and Yamanaka S (2006). Induction of pluripotent stem cells from mouse embryonic and adult fibroblast cultures by defined factors. Cell 126, 663–676. [DOI] [PubMed] [Google Scholar]
- Truong AB, Kretz M, Ridky TW, Kimmel R, and Khavari PA (2006). p63 regulates proliferation and differentiation of developmentally mature keratinocytes. Genes Dev 20, 3185–3197. [DOI] [PMC free article] [PubMed] [Google Scholar]
- Tucci P, Agostini M, Grespi F, Markert EK, Terrinoni A, Vousden KH, Muller PAJ, Dötsch V, Kehrloesser S, Sayan BS, et al. (2012). Loss of p63 and its microRNA-205 target results in enhanced cell migration and metastasis in prostate cancer. Proc. Natl. Acad. Sci. U.S.A 109, 15312–15317. [DOI] [PMC free article] [PubMed] [Google Scholar]
- Van Keymeulen A, Rocha AS, Ousset M, Beck B, Bouvencourt G, Rock J, Sharma N, Dekoninck S, and Blanpain C (2011). Distinct stem cells contribute to mammary gland development and maintenance. Nature 479, 189–193. [DOI] [PubMed] [Google Scholar]
- Wang D, Zhang Z, O’Loughlin E, Wang L, Fan X, Lai EC, and Yi R (2013). MicroRNA-205 controls neonatal expansion of skin stem cells by modulating the PI(3)K pathway. Nat. Cell Biol 15, 1153–1163. [DOI] [PMC free article] [PubMed] [Google Scholar]
- Wang L, Siegenthaler JA, Dowell RD, and Yi R (2016). Foxc1 reinforces quiescence in self-renewing hair follicle stem cells. Science 351, 613–617. [DOI] [PMC free article] [PubMed] [Google Scholar]
- Wang Q, Zou Y, Nowotschin S, Kim SY, Li QV, Soh C-L, Su J, Zhang C, Shu W, Xi Q, et al. (2017). The p53 Family Coordinates Wnt and Nodal Inputs in Mesendodermal Differentiation of Embryonic Stem Cells. Cell Stem Cell 20, 70–86. [DOI] [PMC free article] [PubMed] [Google Scholar]
- Yang A, Schweitzer R, Sun D, Kaghad M, Walker N, Bronson RT, Tabin C, Sharpe A, Caput D, Crum C, et al. (1999). p63 is essential for regenerative proliferation in limb, craniofacial and epithelial development. Nature 398, 714–718. [DOI] [PubMed] [Google Scholar]
- Yang A, Zhu Z, Kapranov P, McKeon F, Church GM, Gingeras TR, and Struhl K (2006). Relationships between p63 binding, DNA sequence, transcription activity, and biological function in human cells. Mol. Cell 24, 593–602. [DOI] [PubMed] [Google Scholar]
- Ye T, Krebs AR, Choukrallah M-A, Keime C, Plewniak F, Davidson I, and Tora L (2011). seqMINER: an integrated ChIP-seq data interpretation platform. Nucleic Acids Res 39, e35. [DOI] [PMC free article] [PubMed] [Google Scholar]
- Zhang Y, Liu T, Meyer CA, Eeckhoute J, Johnson DS, Bernstein BE, Nusbaum C, Myers RM, Brown M, Li W, et al. (2008). Model-based Analysis of ChIP-Seq (MACS). Genome Biology 9, R137. [DOI] [PMC free article] [PubMed] [Google Scholar]
- Zhang Y, Tomann P, Andl T, Gallant NM, Huelsken J, Jerchow B, Birchmeier W, Paus R, Piccolo S, Mikkola ML, et al. (2009). Reciprocal requirements for EDA/EDAR/NF-kappaB and Wnt/beta-catenin signaling pathways in hair follicle induction. Dev. Cell 17, 49–61. [DOI] [PMC free article] [PubMed] [Google Scholar]
- Zheng GXY, Terry JM, Belgrader P, Ryvkin P, Bent ZW, Wilson R, Ziraldo SB, Wheeler TD, McDermott GP, Zhu J, et al. (2017). Massively parallel digital transcriptional profiling of single cells. Nat Commun 8, 14049. [DOI] [PMC free article] [PubMed] [Google Scholar]
Associated Data
This section collects any data citations, data availability statements, or supplementary materials included in this article.