

Abstract
The two roles of cytochrome c (cyt c), in oxidative phosphorylation and apoptosis, critically depend on redox properties of its heme iron center. The K79G mutant has served as a parent protein for a series of mutants of yeast iso-1 cyt c. The mutation preserves the Met80 coordination to the heme iron, as found in WT* (K72A/C102S), and many spectroscopic properties of K79G and WT* are indistinguishable. The K79G mutation does not alter the global stability, fold, rate of Met80 dissociation, or thermodynamics of the alkaline transition (pKa) of the protein. However, the reduction potential of the heme iron decreases; further, the pKH of the trigger group and the rate of the Met-to-Lys ligand exchange associated with the alkaline transition decrease, suggesting changes in the environment of the heme. The rates of electron self-exchange and bimolecular electron transfer (ET) with positively-charged inorganic complexes increase, as does the intrinsic peroxidase activity. Analysis of the reaction rates suggests that there is increased accessibility of the heme edge in K79G and supports the importance of the Lys79 site for bimolecular ET reactions of cyt c, including those with some of its native redox partners. Structural modeling rationalizes the observed effects to arise from changes in the volume of the heme pocket and solvent accessibility of the heme group. Kinetic and structural analyses of WT* characterize the properties of the heme crevice of this commonly employed reference variant. This study highlights the important role of Lys79 for defining functional redox properties of cyt c.
For Table of Contents use only
Introduction
The mitochondrial protein cytochrome c (cyt c) continues to be of great interest to biochemists owing to its ever growing repertoire of functions.1 In addition to its key role as an electron carrier in the electron-transport chain, cyt c is also instrumental in apoptosis by mediating oxidation of cardiolipin (CL) in mitochondrial membranes2–4 and, upon its release to cytosol, binding to Apaf-1 to form an apoptosome. An edge of the heme in cyt c is partially exposed to the solvent and multiple Lys residues surround the heme crevice.5, 6 Previous studies have revealed that this positively charged surface is the site of binding interactions with physiological redox partners bc1 complex,7, 8 cyt c oxidase,9, 10 and cyt c peroxidase11 as well as the negatively charged WD40 domain of Apaf-1.12 Further, a patch consisting of several of these Lys residues (Lys72, 73, 86, and 87; site A) has been implicated in electrostatic interactions with CL membranes.13, 14
At mildly alkaline pH, Lys73 or Lys79 located in the crevice loop (Ω-loop D, residues 71–85), substitutes for the native heme iron ligand Met80.15–20 This ligand switch has been suggested to be relevant for regulation of biological electron flow21, 22 and conformational change upon CL binding.23, 24 Site-directed mutagenesis replacing Lys73 and Lys79 has provided a useful tool to study the properties of individual alkaline conformers or to prevent coordination of these residues to the iron atom altogether.15
While the side chain of Lys73 is fully exposed to solvent, Lys79 is involved in hydrogen bonding with a heme propionate group HP6 as well as Tyr46 and Ser47 (Figure 1).6 The side chain of Lys79 lies across the opening of the heme crevice, contributing to the cluster of basic residues that determine the electrostatic properties of this surface site. Previous chemical modification and mutational studies have revealed that perturbations at residue 79 alter ET with several protein redox partners;25, 26 but, apart from its charge effects, the role of Lys79 has not been clearly defined.
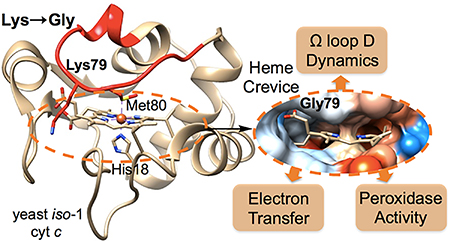
Figure 1.

Ribbon diagram of yeast iso-1 cyt c (2ycc.pdb, ref 6). The colors of the ribbons reflect the relative stabilities of substructures of cyt c as determined by Englander and co-workers (ref 80). The substructures are labeled as in ref 82. The hydrogen-bonding interactions formed by the highlighted residue, Lys79, are shown on the left with the hydrogen bonds indicated by dash lines. Site A, within the dotted border, is associated with electrostatic interactions with CL membranes. This site involves several Lys residues, including Lys72, 73, 86 and 87.
In our recent work, we have employed the K79G mutation to favor coordination of Cys78 to the heme iron in a family of T78C/K79G mutants of yeast iso-1 cyt c.27, 28 We have shown that the K79G mutation does not alter spectroscopic features of the parent WT* and results in minimal changes in thermal stability, and apparent pKa for the Met-to-Lys alkaline transition.28, 29 While the above properties of WT* and K79G appeared largely similar, we still wondered if the mutation might have altered other properties of cyt c.
Herein, we present detailed characterization of the effects of the K79G mutation on protein structure, stability, conformational dynamics, and redox kinetics. We show that this mutation alters the dynamics of the alkaline transition, accelerates the rate of bimolecular ET with positively-charged redox partners, and increases intrinsic peroxidase activity of cyt c. Since Lys79 is highly conserved in mitochondrial cyt c proteins,30 we propose that the residue is critical for the integrity of the heme crevice as well as for tuning redox function and ligand switching of cyt c. Our results emphasize that point mutations may have multifaceted effects on the structure and redox properties of metalloproteins and thus any mutational studies require thorough characterization by both thermodynamic and kinetic methods.
Materials and Methods
Site-Directed Mutagenesis, Protein Expression, and Purification.
The mutant was prepared by introducing changes in the Rbs (WT*)31 plasmid with a QuikChange kit (Agilent). The parent pseudo-wild-type construct WT* carried two additional mutations, Lys72Ala and Cys102Ser. Expression and purification of WT* and K79G were performed according to published procedures.32 Protein conversion to the ferric and ferrous forms was achieved by adding excess potassium ferricyanide and sodium dithionite, respectively.
Spectroscopic Measurements.
Electronic absorption spectra and circular dichroism (CD) spectra were acquired on an Agilent 8453 diode-array spectrophotometer and a JASCO-J815 CD spectropolarimeter, respectively. Protein extinction coefficients were determined by pyridine hemochrome assays.33
EPR spectra were recorded on a Bruker EMX 300 X-band EPR spectrometer at 10 K. The following conditions were employed: microwave frequency of 9.49 GHz, microwave power of 3.21 mW, modulation amplitude of 1.00 G, and time constant of 20.48 ms.
1H NMR spectra were recorded on a 500 MHz Bruker NMR spectrometer. Samples of ferric proteins (0.5–1 mM) were prepared in a 100% D2O buffer containing 50 mM CAPS (pD 10.5), sodium phosphate (pD 7.4) or acetic acid-d4 (pD 4.5) by repeated centrifugal filtration. The ferrous samples were prepared in a 50 mM sodium phosphate buffer containing 10% D2O with the addition of 1 mM sodium dithionite. The pulse sequences and parameters were the same as in our previous work.34
Saturation Transfer NMR.
The sample for saturation transfer 1H NMR measurement was prepared by mixing ferric and ferrous forms of protein at the desired ratio in a 50 mM sodium phosphate buffer at pH 7.4; 10% D2O (vol:vol) was added to the final protein solutions. The concentrations of ferric and ferrous WT* were 1 mM. The concentrations of ferric and ferrous K79G were 0.2 mM and 1.8 mM, respectively.
Saturation transfer 1H NMR experiments were performed according to a published procedure.35 The Met80 ε-CH3 resonance of ferrous protein was monitored following saturation of the corresponding resonance of ferric form. The dependence of the intensity of this signal on saturation time was fit to eq 1:
| (1) |
In eq 1, I0 is the initial intensity, kobs is the observed rate constant, T1 is the spin-lattice relaxation time of the ferrous Met80 ε-CH3 resonance in the presence of ferric form. The second-order rate constants (kESE) were calculated by dividing kobs by the concentration of ferric protein.
Cyclic Voltammetry Measurements.
Gold working electrodes (CH Instruments) were polished with 0.3-micron aluminum oxide powder in deionized water followed by ultrasonication for 30 – 60 seconds. This process was then repeated using 0.05-micron aluminum oxide powder. The electrodes were then cycled electrochemically at high potentials in stages, as described elesewhere.36 Electrodes were rinsed with deionized water and then absolute ethanol before overnight incubation in 10 mM 3-mercapto-1-propanol in ethanol.
Four different buffer solutions were prepared: 0.1 M sodium phosphate at pH 6.0 and at pH 7.4, 20 mM MES with 0.1 M NaCl at pH 6.0, and 20 mM MES with 0.1 M sodium acetate at pH 6.0. The pH of each buffer was adjusted to pH 6.0 or 7.4 using small volumes of 1 M NaOH. Protein samples were exchanged into the desired buffer solution using a PD-10 desalting column, and re-concentrated if necessary using centrifugal filtration units. A thiol-modified gold electrode was rinsed with ethanol, then with deionized water. Then a 10-μL sample of the protein solution was carefully micropipetted onto the electrode surface and a Thermo Scientific MINI dialysis cup (3000 MWCO) was placed over the tip of the electrode, as previously described.37 Superfluous extruded plastic was trimmed from the interior of the dialysis cup to improve electrode insertion and the working electrode bodies were carefully sanded down to a 6.2-mm diameter to reach the dialysis membrane.
The working electrode was placed in a glass vial containing approximately 10 mL degassed buffer solution (under argon) along with a Pt wire as the counter electrode and a Saturated Calomel Electrode as a reference. The entire cell assembly was placed within a grounded Faraday cage and cyclic voltammetry was obtained at 0.02 V/s and 0.1 V/s using a CH Instruments electrochemical workstation. The temperature of the room was recorded before each experiment, and measured electrode potentials ESCE were converted to the Standard Hydrogen Electrode ESHE, based on ESHE = ESCE + 243 mV at 22 °C.38
GuHCl Denaturation Experiments.
Protein stability was examined with guanidine hydrochloride (GuHCl) denaturation experiments monitoring CD spectra at 222 nm and absorbance at 695 nm at pH 4.5 as previously described.27, 32 Protein concentrations were about 10 μM for CD experiments and about 200 μM for the charge-transfer band measuremens. Changes in ellipticity at 222 nm and absorbance at 695 nm as a function of GuHCl concentration were fit to eq 2,39 where [GuHCl]1/2 is the midpoint of the unfolding transition, mD is the slope of the unfolding transition, mf and bf are the slope and y-intercept of the signal from the folded protein, respectively, and mu and bu are the slope and y-intercept of the signal from the unfolded protein, respectively. The Gibbs free energy of denaturation, ΔGD, was the product of mD and [GuHCl]1/2.
| (2) |
Equilibrium and Kinetics Studies of Imidazole Binding.
Experiments were performed using a published procedure with minor modifications.34 All the measurements were done in a 50 mM sodium phosphate buffer at pH 7.4. Changes in absorbance at 405 nm and 419 nm with increasing imidazole concentration were analyzed and the apparent binding constant () was extracted by fitting these data to a one-site binding model. Kinetic binding experiments were performed using a Bio-Logic SFM-300 stopped-flow instrument. Time courses of absorbance at 410 nm were fit to a monoexponential rise to yield the observed rates. The limiting rate constant (corresponding to the dissociation rate of the Met80 ligand, Scheme 1), , in the imidazole binding process was determined by fitting the plots of versus imidazole concentration to eq 3,40 where and are the binding and dissociation rate constants of Met80, whereas and are the rate constants of binding and dissociation of imidazole.
Scheme 1.

| (3) |
pH-Jump Kinetics.
The experiments were done with ferric WT* and K79G proteins in buffers containing 100 mM NaCl at protein concentrations around 10 μM. The initial pH of protein solution was adjusted to 6.0 by adding 1 M HCl or 1 M NaOH. The final pH was achieved by mixing the protein sample with 12 mM jump buffers (sodium phosphate, pH 7.0–7.4; Tris, pH 7.8–8.6; boric acid, pH 9.0–10.0; CAPS, pH 10.2–11.0). The jump buffer was mixed with the protein solution in a 5:1 (vol:vol) ratio using a Bio-Logic SFM-300 stopped-flow instrument. The time dependence of the absorbance signal at 405 nm, the wavelength of the maximum change in the spectra, was recorded and fit to a monoexponential rise function to yield . The dependence of on pH was fit to eq 4 according to the mechanism in Scheme 2,15 where kf and kb are the forward and backward rate constants for the alkaline transition, respectively, and KH is the ionization constant for the group that triggers the alkaline transition (trigger group). The conformational equilibrium constant, KC, was determined by dividing kf by kb. Therefore, the apparent pKa of the alkaline transition is the sum of pKH and pKc.
Scheme 2.

| (4) |
Electron-Transfer Experiments.
Hexaammineruthenium (II) complex (a6Ru2+) was synthesized by reducing commercial-grade [Ru(NH3)6]Cl3 (Strem Chemicals) with zinc,41 and the reaction product was confirmed by IR spectroscopy. All a6Ru2+ stock solutions were prepared immediately before use in a nitrogen-filled glove box (COY Laboratory Products). The concentrations of a6Ru2+ solutions were determined using electronic absorption spectra (ε400=30 M−1cm−1).42 The reduction reactions were carried out anaerobically under N2 atmosphere on a Bio-Logic SFM-300 stopped-flow instrument in a plexiglass glove box. The lines in the stopped-flow instrument were flushed with a dithionite solution and rinsed with deoxygenated water prior to loading the instrument with samples. The final concentration of protein was about 5 μM. The final concentrations of a6Ru2+ varied from 50 to 500 μM. Buffers were 10 mM sodium phosphate at pH 7.0 and contained 100 mM or 1 M NaCl for experiments at low or high ionic strength, respectively. Traces were fit to a monoexponential equation.
The same instrument, also under anaerobic conditions, was employed to measure kinetics of oxidation of ferrous proteins by Co(phen)33+. Co(phen)3Cl3 was synthesized using a published procedure.43 The ferrous protein and Co(phen)3Cl3 stock solutions were prepared in a deoxygenated 10 mM sodium phosphate buffer at pH 7.4 containing 100 mM NaCl in a glove box. The concentration of Co(phen)3Cl3 was determined by electronic absorption spectra (ε303=19.2 mM−1cm−1).44 The final concentrations of proteins were about 5 μM.
Marcus Theory Calculations.
Bimolecular ET rate constants between cyt c and a6Ru2+ (or Co(phen)33+) were calculated using the Marcus theory cross-relationship (eq 5):45
| (5) |
where k11 and k22 are the electron-self-exchange rate constants of the protein and redox complex, respectively, and K12 is the equilibrium constant for the cross-reaction. The k11 and ΔE (the difference in the reduction potentials of the two reactants) values for WT* and K79G variants were determined in this work. The reduction potentials of Co(phen)33+ and a6Ru2+ are 370 mV and 51 mV, respectively.46, 47 The k22 values of Co(phen)33+ and a6Ru2+, 4.5 ×101 mM−1s−1 and 3 × 10³ mM−1s−1, respectively, were taken from the literature.48, 49 K12 was calculated according to eq 6:
| (6) |
Peroxidase Assays.
Peroxidase assays were performed using guaiacol as substrate.50 The final concentrations of the protein, guaiacol, and H2O2 were 3 μM, 5 mM, and 50 μM, respectively. The buffers were either 25 mM HEPES at pH 7.4 or 25 mM sodium acetate at pH 4.5. The formation of the product, tetraguaiacol, was followed by monitoring the absorbance at 470 nm on an Agilent 8453 diode-array spectrophotometer.51 For each mutant, three traces were collected and the rates were extracted from the slopes of the linear phase. Since the formation of one tetraguaiacol molecule consumes four guaiacol molecules, the slopes from the absorption measurements were multiplied by the coefficient four and divided by the extinction coefficient of tetraguaiacol to obtain reaction rates.
Molecular Dynamics Simulations.
Models of WT* and K79G were constructed based on the crystal structure of ferric yeast iso-1 C102T cyt c (pdb entry: 2ycc).6 Structural analysis and simulations were performed by VMD52 (Visual Molecular Dynamics) and NAMD (Not just A Molecular Dynamics)53 programs, respectively, as previously described.54 Force field parameters for the heme prosthetic group and backbone peptides have been published elsewhere.55, 56 All the structural models were for ferric proteins. The coordinates of the water molecules from the original crystal structure were included in the simulation and the protein structure was further solvated in a water box that extended 3 Å from the protein surface. Only the protein structure and the locations of the buried water molecules within the protein were taken into consideration during the analysis.
Results
Spectroscopic Characterization of the Heme Ligation.
Yeast WT has a trimethyllysine in position 72, tmK72. Since this posttranslational modification does not happen during expression in E. coli,57 the K72A mutation was introduced to prevent Lys72 misligation to the heme iron. The K72A/C102S variant, WT*, was a parent system for the K79G mutant we describe here. Like WT*, ferric K79G also displays the Soret absorption band maximum at 409 nm and a charge-transfer band at 695 nm (Figure S1A); the extinction coefficients of the two variants are very similar. EPR spectra of both variants show g values characteristic of the Met-ligated heme iron species (Figure S1B). Moreover, the downfield region of the ferric cyt c 1H NMR spectrum displays two strong resonances of 8-CH3 and 3-CH3 protons around 35 ppm, which are signatures of the Met-ligated heme iron (Figure S1C).15 Ferrous WT* and K79G also have very similar electronic absorption and NMR spectra (Figure S1D). Collectively, these findings suggest that, similar to WT*, Met80 is the ligand to the heme iron in both ferric and ferrous K79G.
EPR and NMR spectra of ferric K79G at pH 4.5 and pH 7.4 are very similar (Figures S2 and S3) suggesting that, as in WT*, the Met80 coordination is preserved at lower pH. In contrast, distinct features at pH 10.5 suggest the formation of the alkaline state at higher pH. These spectroscopic results are in accord with pH titrations monitoring electronic absorption spectra.28
Characterization of the Protein Structure.
The position and magnitude of CD signals of K79G strongly resemble those of WT* in both far- and near-UV regions (Figure S4), suggesting minimal structural perturbations in secondary and tertiary structure upon the mutation. In the absence of crystallographic or NMR structures for WT* and K79G, we have constructed structural models of these variants and K79A using MD simulations. Figure S5 shows the WT* model together with the structure of WT (produced in yeast, with tmK72 residue) obtained from crystallographic studies.6 The structures of WT and WT* are very similar (RMSD = 0.728 Å), with the distances from the coordinating atoms of the axial ligands to the heme iron almost unchanged. As a consequence of tmK72A replacement, the internal water molecule W166 is repositioned 2.57 Å farther from the ferric iron and two more hydrogen bonds, to HP6 and Asn52, are formed by this molecule. While there are only two water molecules, W121 and W168, on the proximal side of His18 in WT, additional water molecules, W5971 and W6313, situated close to the protein surface are introduced in WT* (Figure S5). These two water molecules, along with W121, W168, and W166, are in the channel previously proposed to provide access to the heme.58 The solvent accessible surface area (SASA) and the heme-pocket volume of WT* increase compared to that of WT (Table S1). The modeled structure of the Met-ligated WT* largely overlaps with the structure of the hydroxide-ligated WT* (RMSD is 0.820 Å).58 In both Met- and hydroxide-ligated WT* structures, there is an increase in the number of internal water molecules compared to that in WT (Figure S5), suggesting a role for the tmK72A replacement alone, without changes in ligation to the heme iron, in modifying hydration properties of the heme.
Based on our modeling (Figure S5), the structures of WT* and K79G are very similar (RMSD=0.821 Å). The replacement of the bulky residue, Lys79, with Gly does not change metal-ligand distances, but does reshape the heme crevice and alter its environment. The heme becomes more accessible to the solvent and the volume of the heme pocket increases (Table S1). The structural water molecule, W166, near Met80 is repositioned in K79G. Meanwhile, the distance between the hydroxyl group of Tyr67 and the sulfur atom of Met80 is shortened from 3.63 Å in WT* to 3.12 Å in K79G. The number of water molecules near His18 remains unchanged, but their relative positions are altered. The two waters W121 and W168 move apart and are no longer connected by a hydrogen bond. The removal of the bulky Lys79 side chain creates a cavity that is filled by an extra water molecule (W4933) in the model. The HP6 group, which resides in the hydrophobic pocket in WT*, becomes directly exposed to the solvent in K79G. Another change seen in the K79G variant is the disappearance of the hydrogen bonds formed by the water molecule W168 to HP6 and Arg38.
In trying to understand if these structural changes are uniquely associated with glycine, we have modeled the structure of K79A (Figure S5). The changes in shape and solvent accessibility of the heme crevice in K79A are less dramatic than those seen in K79G (Table S1). In fact, both the pocket volume and SASA of the heme are slightly smaller in K79A compared to WT*. Hydrogen bonds formed by the structurally relevant water W166 to Thr78 and HP6 are disrupted in K79A and the distance between Tyr67 and Met80 increases to 3.80 Å. The extra water molecule near HP6 found in K79G is absent in the structural model of K79A.
Characterization of Protein Stability.
Since His misligation to the heme iron in denatured cyt c complicates thermodynamic analysis of protein denaturation,59, 60 stability studies were carried out at pH 4.5. Changes in CD spectra at 222 nm (Figure S6A) and the charge-transfer band at 695 nm (Figure S6B) in GuHCl solutions report on the loss of the α-helical structure and heme iron-Met80 ligation, respectively. With both measurements, ΔGD values for WT* and K79G are very similar (Table 1) suggesting that global stability of the protein or local stability of the heme crevice loop are largely unaffected by the mutation.
Table 1.
Thermodynamic Parameters for the Unfolding Transitions of Yeast Iso-1 Ferric Cyt c Variants at pH 4.5
| Variant | CD spectroscopy | UV-visible spectroscopy | ||||
|---|---|---|---|---|---|---|
| [GuHCl]1/2
(M) |
mD (kcal mol−1M−1) |
ΔGD (kcal mol−1) |
[GuHCl]1/2 (M) |
mD (kcal mol−1M−1) |
ΔGD (kcal mol−1) |
|
| WTa | 0.96± 0.03 | 4.28 ± 0.25 | 4.11 ± 0.16 | 0.68 ± 0.02 | 5.23 ± 0.76 | 3.56 ± 0.53 |
| WT* | 1.07± 0.07 | 3.08 ± 0.62 | 3.30 ± 0.70 | 0.81 ± 0.01 | 4.80 ± 0.24 | 3.89 ± 0.20 |
| K79G | 1.09 ± 0.04 | 3.87 ± 0.74 | 4.22 ± 0.82 | 0.89 ± 0.01 | 5.56 ± 0.48 | 4.95 ± 0.43 |
Heme Iron Reduction Potentials.
Reduction potentials in 0.1 M phosphate were measured for both WT* and K79G, at pH 6.0 and 7.4 (Table 2 and Figure S7). Reduction potentials fall with increasing pH for both variants, as would be expected for a decrease in charge upon deprotonation of ionizable groups near the heme. The downward shift in potential of 14 mV for WT* and 11 mV for K79G from pH 6 to 7.4 in sodium phosphate is similar to that reported elsewhere for WT.61 Overall, the potential of K79G is lower than that of WT*, but the difference is small.
Table 2.
Reduction Potentialsa of Yeast Iso-1 Ferric Cyt c Variants
| Variant | Em (mV) vs. SHE | |||
|---|---|---|---|---|
| pH 6.0 0.1 M Pi |
pH 6.0 0.1 M Cl− |
pH 6.0 0.1 M acetate |
pH 7.4 0.1 M Pi |
|
| WTb | 290c | |||
| WT* | 286 | 287 | 288 | 272 (274±4)d |
| K79G | 276 | 274 | 278 | 265 (266±2)d |
| K79Ab | 292e | |||
| K79Sb | 234f | |||
| K79Tb | 258f | |||
All the reduction potentials (±2 mV vs. SHE) were measured using cyclic voltammetry unless otherwise indicated. Buffers used here were 0.1 M sodium phosphate (Pi) at pH 6.0 and 7.4, and 20 mM MES at pH 6.0 with 0.1 M sodium chloride or 0.1 M sodium acetate.
These variants contain tmK72 and a background C102T mutation. The rest of the variants contain K72A and C102S mutations.
From ref 15.
Values in parenthesis were obtained from spectroelectrochemistry measurements done in 0.1 M sodium phosphate buffer at pH 7.4; from ref 28.
From ref 70.
From ref 86.
The reduction potential of WT* (K72A/C102S) measured at pH 6 (286 mV) is not significantly different from that (290 mV) of WT under the same conditions.15 The replacement of tmK72 with Ala does not appear to alter the heme iron reduction potential. In fact, previous studies of Lys to Ala mutations in cyt c have not consistently observed changes in the iron reduction potential.15, 62 However, comparisons among literature reports are difficult as buffer conditions are seldom identical; further, the assumptions and literature sources used for determining reference electrode potentials may differ by over 3 mV.63
We next compared three different buffers (containing phosphate, chloride, and acetate ions) at pH 6.0 (Figure S7 and Table 2). The reduction potentials for either WT* or K79G were largely unaffected by variation in the anion used and a small potential drop upon the K79G mutation persisted with all the three buffers. In the case of equine and bovine cyt c binding of phosphate or chloride anions to the protein has been reported to lower the heme iron reduction potential,64, 65 with a shift of ≈ 8 mV seen for 0.1 M chloride relative to 0.1 M acetate. Although yeast cyt c has also been found to interact with phosphate,66–69 our observations suggest that the influence of anion binding on potential is much smaller for WT* than for mammalian cyt c. Further, it appears that the interaction of Lys79 with HP6 in WT* is not in competition with specific anion binding.
Though there is some uncertainty as to whether the K72A mutation imparts a lower reduction potential in cyt c, the K79A mutants studied by others did not exhibit a lower potential than WT.15, 62, 70 This result suggests that the lower potential observed here for K79G relates to the replacement specifically to Gly rather than simple removal of the positive Lys charge. An increase in heme exposure to solvent has been identified as one of many factors that can lower the reduction potential,71–74 though a decrease of ≤10 mV suggests that structural perturbations associated with the K79G mutation are relatively small.
Imidazole Binding Experiments.
Addition of imidazole to ferric WT* and K79G shifts the Soret absorption maximum from 409 nm to 407 nm (Figure S8), consistent with the substitution of Met80 with imidazole. The value of K79G is about three-fold greater than that of WT* (Table 3), suggesting that the heme iron in the mutant more readily accommodates the addition of the exogenous ligand. Kinetics of absorption changes in the imidazole binding experiment depend on both the concentration of the exogenous imidazole ligand and the lability of the endogenous ligand (eq 3).40 For both WT* and K79G, the values of Met dissociation rate constants are the same within error bounds (Table 3) and match the value (60 s−1) for horse heart cyt c. 40 Extensive studies of this latter cyt c have concluded that Met80 dissociation rates are governed by opening of the heme crevice.
Table 3.
Equilibrium and Kinetic Parameters for the Alkaline Transition and Imidazole Binding for Yeast Iso-1 Ferric Cyt c Variantsa
| variant | kf (s−1) | kb × 102 (s−1) | Kc × 10−2 | pKH | pKab | (mM−1)c | (s−1)c |
|---|---|---|---|---|---|---|---|
| WT* | 41.0 ± 4.4 | 8.0 ± 1.5 | 5.1 ± 1.1 | 11.5 ± 0.1 | 8.8 ± 0.1d | 0.36 ± 0.04 | 39 ± 13 |
| WTe | 48 ± 2 | 3.5 ± 1 | 13.9 ± 8 | 11.7 ± 2 | 8.7 ± 2 | n.d. | n.d. |
| K79G | 8.4 ± 1.9 | 10.6 ± 3.4 | 0.8 ± 0.3 | 10.5 ± 0.1 | 8.6 ± 0.1d | 1.1 ± 0.1 | 50 ± 7 |
| K79Ae | 160 ± 5 | 4.0 ± 7 | 40 ± 70 | 12.0 ± 3 | 8.44 ± 1 | n.d. | n.d. |
The WT and K79A variants contain tmK72 and a background C102T mutation, whereas WT* and K79G contain K72A and C102S mutations.
pKa values were determined by pH titration experiments. According to the mechanism of the alkaline transition, pKa equals the sum of pKH and pKc.
represents the apparent binding constant of imidazole and is the rate constant of Met80 dissociation.
From ref 28.
From ref 15.
Kinetics of the Alkaline Transition.
Kinetic parameters for the alkaline conformational transition were obtained from time-resolved changes in absorption spectra upon upward pH jumps (Figure S9 and Table 3). Since the proteins degrade in strongly alkaline conditions, the highest pH employed in these experiments was 11. The pH dependences of for WT* and K79G are clearly different, with the mutant undergoing the transition at lower pH (Figure 2). As pH=11 was still too low to capture the entire pH transition range, it was difficult to obtain independent estimates of the kf and kb values from the kinetic data alone, particularly for WT*. Therefore, the sum of the pKc and pKH was set at the pKa value obtained from equilibrium titrations, and all of the kinetic parameters were determined by fitting as a function of pH to eq 4 with such a constraint and also recognizing that kf/kb = Kc.
Figure 2.

Plots of versus [H+] for ferric WT* (black) and K79G (red) yeast iso-1 cyt c variants. The curves are fits of the data to eq 4, where the sum of pKc and pKH is fixed at the pKa value determined by pH titration experiment and kb is substituted by the product of kf, 10pKa, and KH. Results from the pH-jump experiments at 22 ± 2 °C are shown in Table 3.
The rates for the back conversion (Lys-to-Met, rate constants kb) are slow, consistent with a high barrier for dissociation of the hard base Lys from the ferric heme iron. The kb values for K79G and its parent WT* are the same within error bounds. A similar trend has been reported earlier for K79A and its parent WT.15
The rates for the forward process (Met-to-Lys, rate constants kf) are much faster. For WT*, the kf value is within error bounds of the rate constant for the heme crevice opening obtained from imidazole binding experiments. This result suggests that the opening of the heme crevice associated with Met80 dissociation is the rate-determining step and Lys coordination happens on the same timescale or faster. For K79G, the rate constant kf is notably slower than for this variant. In fact, the pH dependence of cannot be adequately fit with (Figure S10).
Comparison of WT15 and WT* parameters suggests that the mutation K72A in WT* does not appear to affect the apparent pKa or kf values. Earlier experiments with WT and K79A used an uppermost pH value of 10, which is well below pKH; as a consequence, the accuracy of kf estimates for these two variants is not clear. In our analyses, we were able to produce reasonably good fits of these published dependences15 with a broad range of kf values (Figure S11). While it seems that kf of K73A is indeed lower than kf of WT or K79A, the ligand exchange kinetics for K79A and WT can be fit well with kf fixed at any value from 8.5 s−1 to 160 s−1. Thus, our kf values for WT* and K79G cannot be readily compared to those values for WT and K79A15 without additional experiments on this earlier set of tmK72-containing cyt c variants produced in yeast.
ET Experiments.
Kinetic progress curves for reduction of ferric variants by a6Ru2+ are monoexponential at all concentrations of a6Ru2+ studied for both WT* and K79G. The values depend linearly on the concentration of a6Ru2+ (Figure 3); bimolecular ET rate constants, kET, are summarized in Table 4. The kET value of WT* at 0.1 M NaCl is within error of the known value for the WT protein,75 suggesting that the background K72A mutation has little effect on ET reactivity. The similar kinetics of reduction of Met80-ligated K73H and K72A/K73H by a6Ru2+ are in accord with our findings in this study,76 demonstrating that the Lys72 mutation does not influence the mechanism of cyt c ET with a6Ru2+.
Figure 3.

Plots of versus a6Ru2+ concentration for WT* (black) and K79G (red) yeast iso-1 cyt c at pH 7.0. Samples were prepared in a 10 mM sodium phosphate buffer at pH 7.0 containing 0.1 M NaCl (A) or 1 M NaCl (B), respectively. The solid curves are fits of versus a6Ru2+ concentration to .
Table 4.
ET Rate Constants of Met80-ligated Yeast Iso-1 Cyt c Variants
| variant | kET (mM−1s−1) | kESE (mM−1s−1) | |
|---|---|---|---|
| 0.1 M NaCl | 1 M NaCl | ||
| WTa | 48 ± 4b | n.a. | n.a. |
| WT* | 37.1 ± 1.0 | 261.8 ± 21.5 | 1.28 ± 0.22 |
| K79G | 381.8 ± 19.9 | 742.8 ± 30.6 | 20.8 ± 9.04 |
| K73Ha | 39 ± 5b | n.a. | n.a. |
| K72A/K73H | 47 ± 1c | n.a. | n.a. |
| K73H/K79Aa | 133 ± 9d | n.a. | n.a. |
| N52G/K79Aa | 160 ± 40d | n.a. | n.a. |
These variants contain tmK72 and a background C102S mutation. The rest of the variants contain K72A and C102S mutations.
From ref 75.
From ref 76.
From ref 25.
On the other hand, the K79G mutation, affecting a Lys residue situated more closely to the heme edge, does introduce notable changes in ET kinetics. At 0.1 M NaCl the kET value of K79G is about ten-fold larger than that of WT*, whereas, at 1 M NaCl, the difference is only two-fold. The effects of ionic strength suggest that for both WT* and K79G electrostatic interactions are important for the formation of the cyt c-a6Ru2+ precursor complex.
The mutation also accelerates kinetics of cyt c oxidation by Co(phen)33+ (Figure S12). As the reaction with the K79G mutant is already very fast at 0.1 M NaCl, we were not able to assess the effects of ionic strength on these oxidation kinetics. Previous studies of oxidation of WT horse heart cyt c by Co(phen)33+, however, suggest that the reaction rates do increase at higher ionic strength.77
We have also used NMR to determine electron-self-exchange rate constants (kESE) of WT* and K79G (Figure S13). The kESE value for K79G is much greater than the analogous value for WT* (Table 4), consistent with removal of a positive charge near the heme edge and implicating this region as the interaction site in the electron-self-exchange reaction of the cyt c proteins. We have tried to extend our kESE measurements to high ionic strength, but the signal-to-noise ratio from these experiments was too low to obtain reliable kinetic parameters at high salt concentrations.
Having in hand experimental information on the reduction potentials (driving forces) and kESE rate constants, we calculated bimolecular ET constants for cross-reactions of WT* and K79G with a6Ru2+ and Co(phen)33+ complexes (Table 5). Reactions of horse heart cyt c with both a6Ru2+ and Co(phen)33+ have been analyzed previously using Marcus theory and this treatment has predicted ET rate constants not too different from those observed experimentally.47
Table 5.
Bimolecular Electron Transfer Rate Constants from Redox Experiments and the Prediction by Marcus Theory for Yeast Iso-1 Cyt c Variants.
| reaction | variant | K12 | (mM−1s−1) | (mM−1s−1) | |
|---|---|---|---|---|---|
| Fe(III) cyt c + a6Ru2+ | WT* | 5.42 × 10³ | 37.1 ± 1.0 | 144.3 ± 11.9 | 3.9 ± 0.3 |
| K79G | 4.12 × 10³ | 381.8 ± 19.9 | 1603 ± 317 | 4.2 ± 0.9 | |
| Fe(II) cyt c + Co(phen)33+ | WT* | 4.52 × 101 | 4.3 ± 0.1 | 1.61 ± 0.14 | 0.37 ± 0.03 |
| K79G | 5.94 × 101 | 181.5 ± 7.0 | 23.6 ± 4.6 | 0.13 ± 0.03 |
In our analysis, we found the largest discrepancy between the calculated and experimental values of rate constants for the K79G reaction with Co(phen)33+. The calculations overestimate the rate constants for the a6Ru2+ reaction, possibly because the work term for bringing together the hydrophilic a6Ru2+ with the hydrophobic regions of cyt c was neglected.78 However, the ratios between the kET values for WT* and K79G from experiment and theory are almost the same (Table S2), suggesting that similar reaction mechanisms are involved in both WT* and K79G. However, this is not the case for the Co(phen)33+ reaction (Table 5): while the experimental and calculated rate constants are very similar for WT*, there are clear differences for the mutant.
Peroxidase Assays.
Peroxidase activity of WT* and K79G has been assayed at pH 4.5 and 7.4 (Figure S14). As for other six-coordinate cyt c proteins,51 both variants exhibit a lag phase at the beginning of the product formation curves (≈200 s for K79G and ≈1000 s for WT*). During this activation phase, formation of protein radicals has been proposed and the reducing substrate, guaiacol, is possibly oxidized by these radicals.51 The shorter lag period for K79G suggests that Lys79 in WT* may hinder the access of H2O2 to the heme crevice or generation of activated species. As shown in Figure S14, peroxidase activity of K79G is greater than that of WT* at both pH 4.5 and pH 7.4, even though the ligands to the heme iron are the same for both proteins under these conditions. For both variants, the rates of guaiacol consumption at pH 4.5 are lower than those at pH 7.4. Decreased peroxidase activity at lower pH, previously reported for other cyt c proteins51, could be attributed to H2O2 protonation, which hinders catalysis.51
Discussion
Cyt c has been the subject of numerous mutational studies aimed to gain better understanding of its folding,79–82 electron transfer,35, 75 and conformational rearrangements.20, 83, 84 Special interest has been drawn to the heme crevice loop and the residues that surround it owing to the significance of this structural element in the functional regulation of cyt c. The proper folding of this loop is important for the native Met ligation to the heme iron in cyt c, the extent of the heme surface exposure, and interactions of cyt c with its redox partners,20 all of which are critical for the protein’s ET function. Furthermore, opening and closing of this loop regulates substrate access to the heme in peroxidase function, including the insertion of the CL acyl chain in the protein cavity.14, 24, 85 By focusing on alterations of these properties in cyt c variants that carry replacements in the crevice loop sequence, one can rationalize the role of this loop and cyt c structure in governing the redox functions of cyt c.
The decrease in reduction potential in our K79G mutant compared to the parent WT* is relatively small and falls within the range of changes reported for other mutations of Lys79 to a small neutral residue (Table 2).15, 70, 86 However, we do observe notable changes in several kinetic assays with K79G suggesting that alterations in the structure and dynamics of the heme crevice occur upon replacing Lys79. Structural modeling as well as analyses of global stability and local dynamics of the heme crevice loop upon this mutation provide clues regarding the origin of these effects and shed light on the role of Lys79.
Effects of the tmK72A Mutation on Properties of Yeast Iso-1 Cyt c.
As WT* has served as a base for our K79G mutant, we start our discussion with the analysis of our findings on this variant. With the development of the E. coli expression system, the WT* variant became a common mimic of WT in studies of yeast cyt c.20, 57 Comparison with WT suggests that the replacement of tmK72 with Ala does not affect the global stability of cyt c but increases the intrinsic peroxidase activity of the protein.15, 58, 76 Considering the experimental uncertainty of the cyclic voltammetry measurements (Table 2), the reduction potential of WT* does not appear to change significantly from the value of WT measured under the same conditions.15, 70 These findings suggest that structural and dynamic alterations near the heme upon the tmK72A mutation are likely minor, but the details of these perturbations have remained unknown. A crystal structure of the hydroxide-ligated WT* has revealed an extensive buried water channel.58 Since the expulsion of the Met80 ligand from the heme crevice may in large part be responsible for the observed structural differences between WT and hydroxide-ligated WT*, the effects of tmK72A replacement alone have been difficult to delineate.
Our modeling has revealed that the tmK72A mutation causes changes in internal water molecules, which are consistent with the proposed water channel in the structure of hydroxide-ligated WT*.58 Further, the repositioning of W166 and Tyr67 may release steric hindrance around Met80 and facilitate its ejection from the heme crevice as has been observed in the structure of the hydroxide-ligated WT*.58
The mutation tmK72A does not appear to greatly affect the kb values for the Lys-to-Met ligand exchange. Given the uncertainty in previously reported kf values for WT,15 we cannot comment on the changes in kinetics of the Met-to-Lys ligand exchange but the same apparent pKa values, together with the same kb values, suggest that the differences, if any, are small.
The tmK72A replacement enhances peroxidase activity of yeast cyt c,58 but the changes in activity are less pronounced compared to those upon K72A mutation in human cyt c.87 Similar global stabilities, apparent pKa and kinetic parameters of alkaline transition for yeast WT and WT* reiterate previous conclusions that steric hindrance within the heme crevice loop is minimal in the yeast protein.87 Together these results imply that Lys72 plays a less important role in determining functional properties of yeast cyt c compared to its mammalian counterparts.
Effects of the K79G Mutation on the Structure and Global Stability of Yeast Iso-1 Cyt c.
The similarity in CD spectra as well as unfolding parameters of WT* and K79G suggest that structural changes associated with the mutation are localized near the site of the mutation and have minimal effects on global properties of the cyt c polypeptide. The modeling has identified changes in solvation and rearrangements at the replacement site, most notably the increase in the solvent accessible surface area and the volume of the heme pocket in K79G relative to WT*. These changes are expected to lower the heme iron reduction potential71, 72, 74 and increase peroxidase activity of the mutant, and, indeed, this is what we have observed experimentally.
Effects of the K79G Mutation on the Dynamics of the Heme Crevice.
The native Met80 ligand in cyt c is displaced by a number of exogenous ligands40, 88, 89 (herein we have employed imidazole) as well as by Lys73 and Lys79 at alkaline pH.20 Characterization of these ligand substitution reactions provides information regarding the accessibility of the heme crevice and dynamics of the surrounding Ω loop.
The greater imidazole binding constant for K79G compared to that of WTis consistent with the larger solvent exposure of the heme and higher volume of the heme pocket of the mutant we find in our structural models. However, even though the dimensions of the heme pocket change in the mutant, the rate of Met80 dissociation , limited by opening of the heme crevice, does not.
The rate constants for the Met-to-Lys (kf) and Lys-to-Met (kb) reactions offer additional insight into the dynamics of the heme crevice loop. The kf value for K79G is lower than that of WT*, suggesting that the K79G mutation hinders the loop rearrangement associated with the forward alkaline transition. Since Met80 dissociation occurs on the same timescale in both variants, the differences must arise from changes in rates of Lys coordination. Although the K79G mutation removes some interloop hydrogen-bonding interactions formed by the Lys79 side chain, it hardly affects the rest of the local hydrogen-bonding network that stabilizes the heme crevice loop. The motion of this loop thus remains relatively constrained in K79G and coordination by a more distant (compared to Lys79 in WT*) Lys73 must rely on larger-scale structural rearrangements.
In contrast, the kb values are not affected by the K79G mutation. The magnitude of these values is similar to those of other cyt c variants whose structures remain largely intact.15, 20, 90 The values fall within the range of Lys dissociation rates for Lys-ligated cyt c variants.29, 34 As Lys dissociation rates correlate with the extent of perturbations in protein tertiary structure, analysis of these rates provides a diagnosis of structural properties of Lys-ligated conformers.29 Based on the kb values, we place alkaline conformers of WT* and K79G in between M80K,29 which has a well-defined tertiary structure, and Y67R/M80A cyt c, which has a fluctuating structure with molten-globular characteristics.34 This placement agrees with the NMR structure of Lys73-ligated cyt c.91
In our K79G and the K73H20, 76 variants studied by Bowler and coworkers, the nature of the loop rearrangement associated with the backward alkaline transition should be fairly similar, yet the kb values for the His-ligated conformers are larger. These findings suggest that intrinsic differences in dissociation rates of His and Lys ligands modulate the kinetics of the backward ligand-substitution reaction. In the case of the Lys-ligated conformers, the slow Lys dissociation process governs the backward Lys-to-Met transition, explaining the similarity of kb values in a large set of previously studied cyt c mutants.15, 20, 90 In the case of the His-ligated conformers, the rates of His dissociation are faster and conformational rearrangements become rate-controlling steps.
An energy diagram in Figure 4 summarizes the results of our thermodynamic and kinetic characterization of the alkaline transition. The K79G mutation does not affect the stability of the native state but does destabilize both the transition state (TS) and the alkaline state. The comparable increase in the free energy of the TS and the alkaline state suggests that Lys79 is involved in stabilizing interactions in both of these states. Since the dynamics of the alkaline transition is impeded in the forward direction, but remains unchanged in the backward direction, the thermodynamic equilibrium, Kc, for the formation of the alkaline conformer becomes more unfavorable in K79G relative to WT*.
Figure 4.

Energy level diagram displaying the effect of K79G yeast iso-1 cyt c variant on the stability of the Met80-ligated native state, the alkaline state (Lys73-ligated in K79G; Lys73- and Lys79-ligated in WT*), and the transition state (TS) for the alkaline transition, relative to WT*. The native states of K79G and WT* are assumed to be equal, given that the global stabilities of both variants are the same within error (Table 1). The difference in stability of the native state and alkaline state is calculated as ΔG° = - RT ln KC using the values for KC given in Table 3. The destabilization of the TS is calculated by ΔΔG = - RT ln [kf(K79G) / kf (WT*)].
Despite these changes in Kc, the apparent pKa for the alkaline transition remains unchanged. Since pKa is the sum of pKc for the thermodynamic equilibrium and the pKH of the trigger group, a downshift in the pKH value must compensate for the unfavorable thermodynamic equilibrium. These findings suggest that the K79G mutation perturbs the environment in close vicinity to the trigger group. The largest structural differences between WT* and K79G in our models are in the region surrounding the heme propionate HP6, the group suggested to have an anomalously high pKa>9.20, 92, 93 The K79G mutation gives rise to direct interaction of HP6 with the solvent, which is expected to bring down the pKa value of this group. The experimentally observed decrease in pKH is in accord with this prediction, adding support to the importance of HP6 in protonation equilibria associated with alkaline transition.
Effects of the K79G Mutation on ET Reactions of Cyt c.
The K79G mutation increases the solvent exposure of the heme group and lowers the heme iron’s reduction potential. These changes, together with the removal of the positive surface charge near the heme edge, are expected to affect redox reactivity of cyt c.
Each of the three ET reactions studied (electron self-exchange of cyt c, electron self-exchange of a6Ru2+ or Co(phen)33+, and cross-reactions) involves interactions of two positively charged reactants. The rate increase in K79G can be partially attributed to the removal of the positive charge (and thus a decrease in electrostatic repulsions) near the heme edge, the purported site of cyt c ET reactions with multiple redox partners.7, 9, 11, 30 Indeed, the effects of ionic strength in this work as well as previous investigations47 illustrate the importance of electrostatic interactions for these reactions. The increase in ET rates with a6Ru2+ and Co(phen)33+ upon introducing the K79G mutation suggests that, during their ET reactions, both of these small complexes interact with cyt c near Lys79. The fast rates of ET from a6Ru2+ to Met80-ligated cyt c of previously studied N52G/K79A and K73H/K79A add further support to this conclusion.25 Based on findings from Lys modification studies,5, 94 it has been previously argued that the surface region near Lys27 in cyt c (Figure 5) is the preferred site for interactions with Co(phen)33+. The Co(phen)33+ complex is fairly large (6.0 Å radius)95 and, in principle, can sample the protein regions near or in between Lys27 and Lys79, particularly if surface diffusion is involved to optimize electronic coupling in the precursor complex. This interaction area provides access to the heme crevice and is employed in the ET complex of cyt c with its physiological redox partner, the bc1 complex.7
Figure 5.

(A) Hydrophobicity surface of yeast iso-1 cyt c (2ycc.pdb, ref 6) showing the positions of lysine residues. (B) Spatial displacement of residues (main-chain Cα atom) of K79G compared to the structural model of WT*. (C) Hydrophobicity surface near the exposed heme edge of WT*. (D) Hydrophobicity surface near the exposed heme edge of K79G. The space encircled with the dashed line is occupied by the Lys79 in WT*, but remains empty in K79G. The amino acid hydrophobicity is shown in the Kyte-Doolittle scale with colors ranging from blue for the most hydrophilic to white at 0.0 and to red for the most hydrophobic.
For the reaction with uniformly hydrophilic a6Ru2+, the ratios for WT* and K79G are very similar and match the value for the horse heart protein (Table 5). For the reaction with Co(phen)33+, however, the ratios for WT* and the mutant do differ. For the low-spin Co(phen)33+ complex, the energy barrier for ET is large, and penetration of the hydrophobic phenanthroline ligand into the protein interior has been suggested to lower the activation barrier for the reduction of Co3+.96, 97 Further, studies of oxidative quenching of the triplet state of zinc-substituted cyt c by Co(phen)33+ have revealed that an increase in heme exposure accelerates ET rates,98 likely by favoring direct interactions of the metal complex with the heme. Our observed ET rates suggest that such processes are more favored in K79G, supporting the conclusion from our structural models that the heme crevice is more accessible in this variant.
Effects of the K79G Mutation on the Intrinsic Peroxidase Activity.
In addition to increasing bimolecular ET rates, the K79G mutation enhances peroxidase activity of cyt c compared to that of the Met-ligated WT*.58 Our modeled structures of WT* and K79G suggest that Lys79 replacement with Gly not only opens up the heme pocket, improving the access of the substrate to the heme, but also modifies the hydrogen-bonding network near the heme, providing a possible water channel near HP6. A similar channel in the structure of the hydroxide-ligated WT* has been previously hypothesized to help in shuttling protons during the peroxidase reaction.58
The Role of Gly in the Mutant Cyt c.
Several other mutations of Lys79 have been studied. Among them, K79A15, 70 and double mutants carrying K79A25, 99 as one of the replacements, have been examined in the most depth. Similar to our K79G, the bimolecular ET rates of the K79A variants increase following mutation of Lys79.25 However, the heme iron reduction potential remains largely unaffected in K79A15 (Table 2) and the rate of the forward alkaline transition increases rather than decreases.25, 99 Like K79G, K79A has an uncharged residue at position 79 with a relatively small side chain; however, alanine is less flexible than glycine, and its side chain is more hydrophobic.100 Our modeling suggests distinct differences in the shape and solvation of the heme crevice between K79G and K79A. Clearly, the identity of residue 79 matters, with different replacements resulting in distinct properties of the heme.
For both K79A and K79G, the positive charge of Lys79 is removed upon mutational replacements, affecting bimolecular rates. Studies of Lys mutants of cyt c, including of K79A, have revealed that surface charge removal changes the protein orientation and the distance between the heme group and a negatively-charged surface on an electrode.62 Evidently, modifications of Lys79 have multiple mechanisms of affecting cyt c redox function. The reshaping of the heme crevice in K79G highlights the pliable nature of this region and its importance in defining functional properties of the heme group in cyt c.
Conclusions
The small and flexible Gly residue at position 79 in K79G reshapes the heme crevice of cyt c, thereby increasing the volume of the heme pocket and favoring its interactions with the solvent. The structural changes associated with the mutation are localized near the heme and have minimal effects on global properties and stability of cyt c. The mutation lowers the heme iron reduction potential, accelerates ET rates of cyt c with the positively-charged redox partners, and increases the protein’s intrinsic peroxidase activity. Our findings add support to the notion that surface residues in the protein and perturbations in their conformational and electrostatic properties upon complex formation may be intimately connected to the redox reactivity of the heme group.101
While the apparent pKa of the alkaline transition does not change upon the K79G mutation, both the rate of the Met-to-Lys exchange and the pKH of the trigger group decrease. These findings emphasize that characterization of only a limited set of protein properties may miss the multifaceted nature of mutational effects.
Supplementary Material
Acknowledgements.
This work was supported by the NIH R01-GM098502 (E.V.P.) grant. We thank Bruce E. Bowler (University of Montana) for the Rbs (WT*) cyt c plasmid and Alexandre A. Pletnev (Dartmouth College) for the synthesis of Co(phen)3Cl3. We also thank the Berry College Faculty Development Grant program for additional support (K.R.H.) and Madeline L. Weaver (Berry College) for assistance with the cyclic voltammetry experiments and procedures. Y.D. was partially supported by China Scholarship Council.
Footnotes
Supporting Information Available. Fourteen figures showing spectroscopic characterizations of WT* and K79G at pH 7.4; NMR spectra of ferric WT* and K79G at different pH values; EPR spectra of ferric WT* and K79G at different pH values; CD spectra of ferric WT* and K79G at pH 7.4; crystal structures and structural models of the studied variants; GuHCl titration curves of ferric WT* and K79G at pH 4.5; cyclic voltammetry of WT* and K79G; absorption spectral change and kinetics of imidazole binding to ferric K79G; absorption spectral change and kinetics of pH jump of ferric WT* and K79G; dependence of pH-jump rate constant on H+ concentration for ferric K79G; dependence of pH-jump rate constant on H+ concentration for ferric WT and K79A; dependence of observed rate constant on Co(phen)33+ concentration for WT* and K79G; kinetics of the saturation transfer NMR experiments of WT* and K79G; absorption spectral change and comparison of peroxidase activity of ferric WT* and K79G; two tables showing the solvent accessibility and volume of the heme pocket of studied variants; comparison of the bimolecular ET rate constants obtained from experiments and Marcus calculations.
References
- [1].Alvarez-Paggi D, Hannibal L, Castro MA, Oviedo-Rouco S, Demicheli V, Tórtora V, Tomasina F, Radi R, and Murgida DH (2017) Multifunctional cytochrome c: learning new tricks from an old dog, Chem. Rev 117, 13382–13460. [DOI] [PubMed] [Google Scholar]
- [2].O’Brien ES, Nucci NV, Fuglestad B, Tommos C, and Wand AJ (2015) Defining the apoptotic trigger: the interaction of cytochrome c and cardiolipin, J. Biol. Chem 290, 30879–30887. [DOI] [PMC free article] [PubMed] [Google Scholar]
- [3].Kagan VE, Bayir HA, Belikova NA, Kapralov O, Tyurina YY, Tyurin VA, Jiang J, Stoyanovsky DA, Wipf P, Kochanek PM, Greenberger JS, Pitt B, Shvedova AA, and Borisenko G (2009) Cytochrome c/cardiolipin relations in mitochondria: a kiss of death, Free radical biology & medicine 46, 1439–1453. [DOI] [PMC free article] [PubMed] [Google Scholar]
- [4].Kagan VE, Tyurin VA, Jiang J, Tyurina YY, Ritov VB, Amoscato AA, Osipov AN, Belikova NA, Kapralov AA, Kini V, Vlasova II, Zhao Q, Zou M, Di P, Svistunenko DA, Kurnikov IV, and Borisenko GG (2005) Cytochrome c acts as a cardiolipin oxygenase required for release of proapoptotic factors, Nat. Chem. Biol 1, 223–232. [DOI] [PubMed] [Google Scholar]
- [5].Butler J, Chapman SK, Davies DM, Sykes AG, Speck SH, Osheroff N, and Margoliash E (1983) Preferred sites for electron transfer between cytochrome c and iron and cobalt complexes, J. Biol. Chem 258, 6400–6404. [PubMed] [Google Scholar]
- [6].Berghuis AM, and Brayer GD (1992) Oxidation state-dependent conformational changes in cytochrome c, J. Mol. Biol 223, 959–976. [DOI] [PubMed] [Google Scholar]
- [7].Lange C, and Hunte C (2002) Crystal structure of the yeast cytochrome bc1 complex with its bound substrate cytochrome c, Proc. Natl. Acad. Sci. U.S.A 99, 2800–2805. [DOI] [PMC free article] [PubMed] [Google Scholar]
- [8].Rieder R, and Bosshard HR (1980) Comparison of the binding sites on cytochrome c for cytochrome c oxidase, cytochrome bc1, and cytochrome c1. Differential acetylation of lysyl residues in free and complexed cytochrome c, J. Biol. Chem 255, 4732–4739. [PubMed] [Google Scholar]
- [9].Roberts VA, and Pique ME (1999) Definition of the interaction domain for cytochrome c on cytochrome c oxidase: III. prediction of the docked complex by a complete, systematic search, J. Biol. Chem 274, 38051–38060. [DOI] [PubMed] [Google Scholar]
- [10].Döpner S, Hildebrandt P, Rosell FI, Mauk AG, von Walter M, Buse G, and Soulimane T (1999) The structural and functional role of lysine residues in the binding domain of cytochrome c in the electron transfer to cytochrome c oxidase, Eur. J. Biochem 261, 379–391. [DOI] [PubMed] [Google Scholar]
- [11].Pelletier H, and Kraut J (1992) Crystal structure of a complex between electron transfer partners, cytochrome c peroxidase and cytochrome c, Science 258, 1748–1755. [DOI] [PubMed] [Google Scholar]
- [12].Rao PN, Gullipalli D, and Bhuyan AK (2009) Bacterially expressed recombinant WD40 domain of human Apaf-1, Protein Expr. Purif 67, 53–60. [DOI] [PubMed] [Google Scholar]
- [13].Rytömaa M, and Kinnunen PK (1994) Evidence for two distinct acidic phospholipid-binding sites in cytochrome c, J. Biol. Chem 269, 1770–1774. [PubMed] [Google Scholar]
- [14].Sinibaldi F, Howes BD, Droghetti E, Polticelli F, Piro MC, Di Pierro D, Fiorucci L, Coletta M, Smulevich G, and Santucci R (2013) Role of lysines in cytochrome c–cardiolipin interaction, Biochemistry 52, 4578–4588. [DOI] [PubMed] [Google Scholar]
- [15].Rosell FI, Ferrer JC, and Mauk AG (1998) Proton-linked protein conformational switching: definition of the alkaline conformational transition of yeast iso-1-ferricytochrome c, J. Am. Chem. Soc 120, 11234–11245. [Google Scholar]
- [16].Theorell H, and Åkesson Å (1941) Studies on cytochrome c. I. Electrophoretic purification of cytochrome c and its amino acid composition, J. Am. Chem. Soc 63, 1804–1811. [Google Scholar]
- [17].Theorell H, and Åkesson Å (1941) Studies on cytochrome c. II. The optical properties of pure cytochrome c and some of its derivatives, J. Am. Chem. Soc 63, 1812–1818. [Google Scholar]
- [18].Theorell H, and Åkesson Å (1941) Studies on cytochrome c. III. Titration curves, J. Am. Chem. Soc 63, 1818–1820. [Google Scholar]
- [19].Theorell H (1941) Studies on cytochrome c. IV. The magnetic properties of ferric and ferrous cytochrome c, J. Am. Chem. Soc 63, 1820–1827. [Google Scholar]
- [20].Cherney MM, and Bowler BE (2011) Protein dynamics and function: making new strides with an old warhorse, the alkaline conformational transition of cytochrome c, Coord. Chem. Rev 255, 664–677. [Google Scholar]
- [21].Sampson V, and Alleyne T (2001) Cytochrome c/cytochrome c oxidase interaction, Eur. J. Biochem 268, 6534–6544. [DOI] [PubMed] [Google Scholar]
- [22].Weber C, Michel B, and Bosshard HR (1987) Spectroscopic analysis of the cytochrome c oxidase-cytochrome c complex: circular dichroism and magnetic circular dichroism measurements reveal change of cytochrome c heme geometry imposed by complex formation, Proc. Natl. Acad. Sci. U.S.A 84, 6687–6691. [DOI] [PMC free article] [PubMed] [Google Scholar]
- [23].Bradley JM, Silkstone G, Wilson MT, Cheesman MR, and Butt JN (2011) Probing a complex of cytochrome c and cardiolipin by magnetic circular dichroism spectroscopy: implications for the initial events in apoptosis, J. Am. Chem. Soc 133, 19676–19679. [DOI] [PubMed] [Google Scholar]
- [24].Basova LV, Kurnikov IV, Wang L, Ritov VB, Belikova NA, Vlasova II, Pacheco AA, Winnica DE, Peterson J, Bayir H, Waldeck DH, and Kagan VE (2007) Cardiolipin switch in mitochondria: shutting off the reduction of cytochrome c and turning on the peroxidase activity, Biochemistry 46, 3423–3434. [DOI] [PMC free article] [PubMed] [Google Scholar]
- [25].Baddam S, and Bowler BE (2006) Tuning the rate and pH accessibility of a conformational electron transfer gate, Inorg. Chem 45, 6338–6346. [DOI] [PubMed] [Google Scholar]
- [26].Northrup SH, Thomasson KA, Miller CM, Barker PD, Eltis LD, Guillemette JG, Mauk AG, and Inglis SC (1993) Effects of charged amino acid mutations on the bimolecular kinetics of reduction of yeast iso-1-ferricytochrome c by bovine ferrocytochrome b5, Biochemistry 32, 6613–6623. [DOI] [PubMed] [Google Scholar]
- [27].Zhong F, Lisi GP, Collins DP, Dawson JH, and Pletneva EV (2014) Redox-dependent stability, protonation, and reactivity of cysteine-bound heme proteins, Proc. Natl. Acad. Sci. U.S.A 111, E306–E315. [DOI] [PMC free article] [PubMed] [Google Scholar]
- [28].Amacher JF, Zhong F, Lisi GP, Zhu MQ, Alden SL, Hoke KR, Madden DR, and Pletneva EV (2015) A compact structure of cytochrome c trapped in a lysine-ligated state: loop refolding and functional implications of a conformational switch, J. Am. Chem. Soc 137, 8435–8449. [DOI] [PMC free article] [PubMed] [Google Scholar]
- [29].Zhong F, and Pletneva EV (2018) Ligation and reactivity of methionine-oxidized cytochrome c, Inorg. Chem 57, 5754–5766. [DOI] [PMC free article] [PubMed] [Google Scholar]
- [30].Moore GR, and Pettigrew GW (1990) Cytochorme c: Evolutionary, structural, and physicochemical aspects, Springer-Verlag, New York. [Google Scholar]
- [31].Duncan MG, Williams MD, and Bowler BE (2009) Compressing the free energy range of substructure stabilities in iso-1-cytochrome c, Protein Science 18, 1155–1164. [DOI] [PMC free article] [PubMed] [Google Scholar]
- [32].Hanske J, Toffey JR, Morenz AM, Bonilla AJ, Schiavoni KH, and Pletneva EV (2012) Conformational properties of cardiolipin-bound cytochrome c, Proc. Natl. Acad. Sci. U.S.A 109, 125–130. [DOI] [PMC free article] [PubMed] [Google Scholar]
- [33].Berry EA, and Trumpower BL (1987) Simultaneous determination of hemes a, b, and c from pyridine hemochrome spectra, Anal. Biochem 161, 1–15. [DOI] [PubMed] [Google Scholar]
- [34].Gu J, Shin D-W, and Pletneva EV (2017) Remote perturbations in tertiary contacts trigger ligation of lysine to the heme iron in cytochrome c, Biochemistry 56, 2950–2966. [DOI] [PMC free article] [PubMed] [Google Scholar]
- [35].Liptak MD, Fagerlund RD, Ledgerwood EC, Wilbanks SM, and Bren KL (2011) The proapoptotic G41S mutation to human cytochrome c alters the heme electronic structure and increases the electron self-exchange rate, J. Am. Chem. Soc 133, 1153–1155. [DOI] [PMC free article] [PubMed] [Google Scholar]
- [36].Jeuken LJC, Mcevoy JP, and Armstrong FA (2002) Insights into gated electron-transfer kinetics at the electrode−protein interface: a square wave voltammetry study of the blue copper protein azurin, J. Phys. Chem. B 106, 2304–2313. [Google Scholar]
- [37].Hoke KR, and Chandler MR (2013) Cyclic voltammetry of cytochrome c as an undergraduate laboratory exercise, The Chemical Educator 18, 263–268. [Google Scholar]
- [38].Bard AJ, and Faulkner LR (2001) Electrochemical methods: fundamentals and applications, 2nd ed. John Wiley & Sons, New York. [Google Scholar]
- [39].Creighton TF (1997) Protein structure: a practical approach, Oxford University Press, New York. [Google Scholar]
- [40].Sutin N, and Yandell JK (1972) Mechanisms of the reactions of cytochrome c : rate and equilibrium constants for ligand binding to horse heart ferricytochrome c, J. Biol. Chem 247, 6932–6936. [PubMed] [Google Scholar]
- [41].Fergusson JE, Love JL, and Armor JN (1972) Ruthenium ammines, In Inorg. Synth, pp 208–213, John Wiley & Sons, Inc. [Google Scholar]
- [42].Meyer TJ, and Taube H (1968) Electron-transfer reactions of ruthenium ammines, Inorg. Chem 7, 2369–2379. [Google Scholar]
- [43].Maki N (1969) Methods of preparing the 2,2′-dipyridyl and 1,10-phenanthroline cobalt(III) complexes of the [CoX2dip2]- and [CoX2phen2]-type, Bull. Chem. Soc. Jpn 42, 2275–2281. [Google Scholar]
- [44].Welch TW, and Thorp HH (1996) Distribution of metal complexes bound to DNA determined by normal pulse voltammetry, J. Phys. Chem 100, 13829–13836. [Google Scholar]
- [45].Marcus RA (1965) On the theory of electron‐transfer reactions. VI. Unified treatment for homogeneous and electrode reactions, J. Chem. Phys 43, 679–701. [Google Scholar]
- [46].Lim HS, Barclay DJ, and Anson FC (1972) Formal potentials and cyclic voltammetry of some ruthenium-ammine complexes, Inorg. Chem 11, 1460–1466. [Google Scholar]
- [47].Sutin N (1977) Electron transfer reactions of cytochrome c, In Bioinorganic Chemistry—II, pp 156–172, American Chemical Society. [Google Scholar]
- [48].Ewall RX, and Bennett LE (1974) Reactivity characteristics of cytochrome c(III) adduced from its reduction by hexaammineruthenium(II) ion, J. Am. Chem. Soc 96, 940–942. [Google Scholar]
- [49].Farina RD, and Wilkins RG (1968) Electron-transfer rate studies of a number of cobalt-(II)-cobalt(III) systems, Inorg. Chem 7, 514–518. [Google Scholar]
- [50].Doerge DR, Divi RL, and Churchwell MI (1997) Identification of the colored guaiacol oxidation product produced by peroxidases, Anal. Biochem 250, 10–17. [DOI] [PubMed] [Google Scholar]
- [51].Diederix REM, Ubbink M, and Canters GW (2001) The peroxidase activity of cytochrome c-550 from Paracoccus versutus, Eur. J. Biochem 268, 4207–4216. [DOI] [PubMed] [Google Scholar]
- [52].Humphrey W, Dalke A, and Schulten K (1996) VMD - Visual Molecular Dynamics, J. Mol. Graphics 14, 33–38. [DOI] [PubMed] [Google Scholar]
- [53].Phillips JC, Braun R, Wang W, Gumbart J, Tajkhorshid E, Villa E, Chipot C, Skeel RD, Kalé L, and Schulten K (2005) Scalable molecular dynamics with NAMD, J. Comput. Chem 26, 1781–1802. [DOI] [PMC free article] [PubMed] [Google Scholar]
- [54].Ying T, Zhong F, Xie J, Feng Y, Wang Z-H, Huang Z-X, and Tan X (2009) Evolutionary alkaline transition in human cytochrome c, J. Bioenerg. Biomembr 41, 251–257. [DOI] [PubMed] [Google Scholar]
- [55].Autenrieth F, Tajkhorshid E, Baudry J, and Luthey-Schulten Z (2004) Classical force field parameters for the heme prosthetic group of cytochrome c, J. Comput. Chem 25, 1613–1622. [DOI] [PubMed] [Google Scholar]
- [56].Mackerell AD, Feig M, and Brooks CL (2004) Extending the treatment of backbone energetics in protein force fields: Limitations of gas-phase quantum mechanics in reproducing protein conformational distributions in molecular dynamics simulations, J. Comput. Chem 25, 1400–1415. [DOI] [PubMed] [Google Scholar]
- [57].Pollock WBR, Rosell FI, Twitchett MB, Dumont ME, and Mauk AG (1998) Bacterial expression of a mitochondrial cytochrome c. Trimethylation of Lys72 in yeast iso-1-cytochrome c and the alkaline conformational transition, Biochemistry 37, 6124–6131. [DOI] [PubMed] [Google Scholar]
- [58].McClelland LJ, Mou T-C, Jeakins-Cooley ME, Sprang SR, and Bowler BE (2014) Structure of a mitochondrial cytochrome c conformer competent for peroxidase activity, Proc. Natl. Acad. Sci. U.S.A 111, 6648–6653. [DOI] [PMC free article] [PubMed] [Google Scholar]
- [59].Colón W, Wakem LP, Sherman F, and Roder H (1997) Identification of the predominant non-native histidine ligand in unfolded cytochrome c, Biochemistry 36, 12535–12541. [DOI] [PubMed] [Google Scholar]
- [60].Godbole S, and Bowler BE (1999) Effect of pH on formation of a nativelike intermediate on the unfolding pathway of a Lys 73 → His variant of yeast iso-1-cytochrome c, Biochemistry 38, 487–495. [DOI] [PubMed] [Google Scholar]
- [61].Cutler RL, Davies AM, Creighton S, Warshel A, Moore GR, Smith M, and Mauk AG (1989) Role of arginine-38 in regulation of the cytochrome c oxidation-reduction equilibrium, Biochemistry 28, 3188–3197. [DOI] [PubMed] [Google Scholar]
- [62].Battistuzzi G, Borsari M, Bortolotti CA, Di Rocco G, Ranieri A, and Sola M (2007) Effects of mutational (Lys to Ala) surface charge changes on the redox properties of electrode-immobilized cytochrome c, J. Phys. Chem. B 111, 10281–10287. [DOI] [PubMed] [Google Scholar]
- [63].Hills GJ, and Ives DJG (1961) The calomel electrode and other mercury-mercurous salt electrodes, in Reference Electrodes (Ives DJG, and Janz GJ, Eds.), pp 127–178. Academic Press, New York. [Google Scholar]
- [64].Battistuzzi G, Borsari M, Dallari D, Lancellotti I, and Sola M (1996) Anion binding to mitochondrial cytochromes c studied through electrochemistry. Effects of the neutralization of surface charges on the redox potential, Eur. J. Biochem 241, 208–214. [DOI] [PubMed] [Google Scholar]
- [65].Gopal D, Wilson GS, Earl RA, and Cusanovich MA (1988) Cytochrome c: ion binding and redox properties. Studies on ferri and ferro forms of horse, bovine, and tuna cytochrome c, J. Biol. Chem 263, 11652–11656. [PubMed] [Google Scholar]
- [66].Dethmers JK, Ferguson-Miller S, and Margoliash E (1979) Comparison of yeast and beef cytochrome c oxidases. Kinetics and binding of horse, fungal, and Euglena cytochromes c, J. Biol. Chem 254 11973–11981. [PubMed] [Google Scholar]
- [67].Osheroff N, Brautigan DL, and Margoliash E (1980) Mapping of anion binding sites on cytochrome c by differential chemical modification of lysine residues, Proceedings of the National Academy of Sciences of the United States of America 77, 4439–4443. [DOI] [PMC free article] [PubMed] [Google Scholar]
- [68].Liggins JR, Sherman F, Mathews AJ, and Nall BT (1994) Differential scanning calorimetric study of the termal unfolding transitions of yeast iso-1 and iso-2 cytochromes c and three composite isoenzymes, Biochemistry 33, 9209–9219. [DOI] [PubMed] [Google Scholar]
- [69].Taniuchi HS, Y.; San Miguel GI; Ferretti JA; Mack JW; Fisher A; Shah M; Schechter AN; Shiloach J (2001) A study of the influence of the hydrophobic core residues of yeast iso-2-cytochrome c on phosphate binding: a probe of the hydrophobic core-surface charge interactions, J. Protein Chem 20, 203–215. [DOI] [PubMed] [Google Scholar]
- [70].Ferrer JC, Guillemette JG, Bogumil R, Inglis SC, Smith M, and Mauk AG (1993) Identification of Lys79 as an iron ligand in one form of alkaline yeast iso-1-ferricytochrome c, J. Am. Chem. Soc 115, 7507–7508. [Google Scholar]
- [71].Liu J, Chakraborty S, Hosseinzadeh P, Yu Y, Tian S, Petrik I, Bhagi A, and Lu Y (2014) Metalloproteins containing cytochrome, iron-sulfur, or copper redox centers, Chem. Rev 114, 4366–4469. [DOI] [PMC free article] [PubMed] [Google Scholar]
- [72].Tezcan FA, Winkler JR, and Gray HB (1998) Effects of ligation and folding on reduction potentials of heme proteins, J. Am. Chem. Soc 120, 13383–13388. [Google Scholar]
- [73].Mao J, Hauser K, and Gunner MR (2003) How cytochromes with different folds control heme redox potentials, Biochemistry 42, 9829–9840. [DOI] [PubMed] [Google Scholar]
- [74].Stellwagen E (1978) Haem exposure as the determinate of oxidation-reduction potential of haem proteins, Nature 275, 73–75. [DOI] [PubMed] [Google Scholar]
- [75].Baddam S, and Bowler BE (2005) Conformationally gated electron transfer in iso-1-cytochrome c: engineering the rate of a conformational switch, J. Am. Chem. Soc 127, 9702–9703. [DOI] [PubMed] [Google Scholar]
- [76].McClelland LJ, Seagraves SM, Khan KA, Cherney MM, Bandi S, Culbertson JE, and Bowler BE (2015) The response of Ω-loop D dynamics to truncation of trimethyllysine 72 of yeast iso-1-cytochrome c depends on the nature of loop deformation, J. Biol. Inorg. Chem 20, 805–819. [DOI] [PMC free article] [PubMed] [Google Scholar]
- [77].McArdle JV, Gray HB, Creutz C, and Sutin N (1974) Kinetic studies of the oxidation of ferrocytochrome c from horse heart and Candida krusei by tris(1,10-phenanthroline)cobalt(III), J. Am. Chem. Soc 96, 5737–5741. [DOI] [PubMed] [Google Scholar]
- [78].Marcus RA, and Sutin N (1975) Electron-transfer reactions with unusual activation parameters. Treatment of reactions accompanied by large entropy decreases, Inorg. Chem 14, 213–216. [Google Scholar]
- [79].Hu W, Kan Z-Y, Mayne L, and Englander SW (2016) Cytochrome c folds through foldon-dependent native-like intermediates in an ordered pathway, Proc. Natl. Acad. Sci. U.S.A 113, 3809–3814. [DOI] [PMC free article] [PubMed] [Google Scholar]
- [80].Hoang L, Bédard S, Krishna MMG, Lin Y, and Englander SW (2002) Cytochrome c folding pathway: kinetic native-state hydrogen exchange, Proc. Natl. Acad. Sci. U.S.A 99, 12173–12178. [DOI] [PMC free article] [PubMed] [Google Scholar]
- [81].Winkler JR (2004) Cytochrome c folding dynamics, Curr. Opin. Chem. Biol 8, 169–174. [DOI] [PubMed] [Google Scholar]
- [82].Fetrow JS, Cardillo TS, and Sherman F (1989) Deletions and replacements of omega loops in yeast iso-1-cytochrome c, Proteins: Struct., Funct., Bioinf 6, 372–381. [DOI] [PubMed] [Google Scholar]
- [83].Schweitzer-Stenner R (2014) Cytochrome c: a multifunctional protein combining conformational rigidity with flexibility, New J. Sci 2014, 1–28. [Google Scholar]
- [84].Muenzner J, and Pletneva EV (2014) Structural transformations of cytochrome c upon interaction with cardiolipin, Chem. Phys. Lipids 179, 57–63. [DOI] [PMC free article] [PubMed] [Google Scholar]
- [85].Hüttemann M, Pecina P, Rainbolt M, Sanderson TH, Kagan VE, Samavati L, Doan JW, and Lee I (2011) The multiple functions of cytochrome c and their regulation in life and death decisions of the mammalian cell: from respiration to apoptosis, Mitochondrion 11, 369–381. [DOI] [PMC free article] [PubMed] [Google Scholar]
- [86].Lett CM, and Guillemette JG (2002) Increasing the redox potential of isoform 1 of yeast cytochrome c through the modification of select haem interactions, Biochem. J 362, 281–287. [DOI] [PMC free article] [PubMed] [Google Scholar]
- [87].Nold SM, Lei H, Mou T-C, and Bowler BE (2017) Effect of a K72A mutation on the structure, stability, dynamics, and peroxidase activity of human cytochrome c, Biochemistry 56, 3358–3368. [DOI] [PMC free article] [PubMed] [Google Scholar]
- [88].Viola F, Aime S, Coletta M, Desideri A, Fasano M, Paoletti S, Tarricone C, and Ascenzi P (1996) Azide, cyanide, fluoride, imidazole and pyridine binding to ferric and ferrous native horse heart cytochrome c and to its carboxymethylated derivative: a comparative study, J. Inorg. Biochem 62, 213–222. [DOI] [PubMed] [Google Scholar]
- [89].Karsisiotis AI, Deacon OM, Wilson MT, Macdonald C, Blumenschein TM, Moore GR, and Worrall JA (2016) Increased dynamics in the 40–57 Omega-loop of the G41S variant of human cytochrome c promote its pro-apoptotic conformation, Sci. Rep 6, 1–12. [DOI] [PMC free article] [PubMed] [Google Scholar]
- [90].Pearce LL, Gartner AL, Smith M, and Mauk AG (1989) Mutation-induced perturbation of the cytochrome c alkaline transition, Biochemistry 28, 3152–3156. [DOI] [PubMed] [Google Scholar]
- [91].Assfalg M, Bertini I, Dolfi A, Turano P, Mauk AG, Rosell FI, and Gray HB (2003) Structural model for an alkaline form of ferricytochrome c, J. Am. Chem. Soc 125, 2913–2922. [DOI] [PubMed] [Google Scholar]
- [92].Tonge P, Moore GR, and Wharton CW (1989) Fourier-transform infra-red studies of the alkaline isomerization of mitochondrial cytochrome c and the ionization of carboxylic acids, Biochem. J 258, 599–605. [DOI] [PMC free article] [PubMed] [Google Scholar]
- [93].Hartshorn RT, and Moore GR (1989) A denaturation-induced proton-uptake study of horse ferricytochrome c, Biochem. J 258, 595–598. [DOI] [PMC free article] [PubMed] [Google Scholar]
- [94].Drake PL, Hartshorn RT, McGinnis J, and Sykes AG (1989) pH dependence of rate constants for reactions of cytochrome c with inorganic redox partners and mechanistic implications, Inorg. Chem 28, 1361–1366. [Google Scholar]
- [95].Hanauer M, Neshat A, and Bigioni TP (2008) Tris(1,10-phenanthroline-κ2N,N’)cobalt(III) tris(trifluoromethanesulfonate) dihydrate, Acta Crystallographica Section C 64, m111–m113. [DOI] [PubMed] [Google Scholar]
- [96].Rush JD, Koppenol WH, Garber EA, and Margoliash E (1988) Conformational stability of ferrocytochrome c. Electrostatic aspects of the oxidation by tris(1,10-phenanthroline)cobalt(III) at low ionic strength, J. Biol. Chem 263, 7514–7520. [PubMed] [Google Scholar]
- [97].Wherland S, and Gray HB (1976) Metalloprotein electron transfer reactions: analysis of reactivity of horse heart cytochrome c with inorganic complexes, Proc. Natl. Acad. Sci. U.S.A 73, 2950–2954. [DOI] [PMC free article] [PubMed] [Google Scholar]
- [98].Tremain SM, and Kostić NM (2002) Molten-globule and other conformational forms of zinc cytochrome c. Effect of partial and complete unfolding of the protein on its electron-transfer reactivity, Inorg. Chem 41, 3291–3301. [DOI] [PubMed] [Google Scholar]
- [99].Baddam S, and Bowler BE (2005) Thermodynamics and kinetics of formation of the alkaline state of a Lys 79→Ala/Lys 73→His variant of iso-1-cytochrome c, Biochemistry 44, 14956–14968. [DOI] [PubMed] [Google Scholar]
- [100].Yan BX, and Sun YQ (1997) Glycine residues provide flexibility for enzyme active sites, J. Biol. Chem 272, 3190–3194. [DOI] [PubMed] [Google Scholar]
- [101].Galinato MGI, Kleingardner JG, Bowman SEJ, Alp EE, Zhao J, Bren KL, and Lehnert N (2012) Heme-protein vibrational couplings in cytochrome c provide a dynamic link that connects the heme-iron and the protein surface, Proc. Nat. Acad. Sci. USA 109, 8896–8900. [DOI] [PMC free article] [PubMed] [Google Scholar]
Associated Data
This section collects any data citations, data availability statements, or supplementary materials included in this article.