

Summary
From an organismal perspective, cancer cell populations can be considered analogous to parasites that compete with the host for essential systemic resources such as glucose. Here, we employed leukemia models and human leukemia samples to document a form of adaptive homeostasis, where malignant cells alter systemic physiology through impairment of both host insulin sensitivity and insulin secretion to provide tumors with increased glucose. Mechanistically, tumor cells induce high level production of IGFBP1 from adipose tissue to mediate insulin sensitivity. Further, leukemia-induced gut dysbiosis, serotonin loss and incretin inactivation combine to suppress insulin secretion. Importantly, attenuated disease progression and prolonged survival are achieved through disruption of the leukemia-induced adaptive homeostasis. Our studies provide a paradigm for systemic management of leukemic disease.
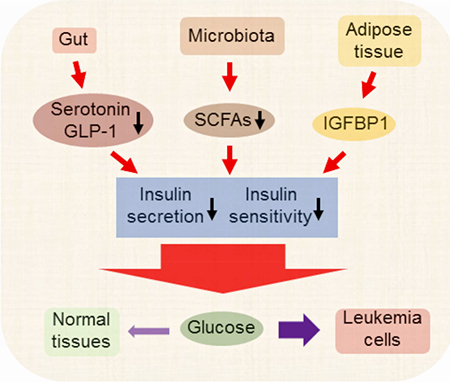
Ye et al. show that leukemia cells hijack host glucose by inducing IGFBP1 production from adipose tissue to mediate insulin sensitivity and by inducing gut dysbiosis, serotonin loss, and incretin inactivation to suppress insulin secretion. Disrupting this adaptive homeostasis attenuates leukemia progression.
Keywords: adaptive homeostasis, leukemia, IGFBP1, adipose tissue, insulin resistance, serotonin, microbiota, short-chain fatty acids
Graphical Abstract
Introduction
It is well established that cancer cells consume more glucose than normal cells, a component of malignant cell bioenergetics that has been documented in numerous studies (Hay, 2016). To date though, studies have mainly focused on cell intrinsic mechanisms by which glucose is preferentially utilized such as activation of glucose transporters and glycolysis. In the present study, we sought to approach glucose metabolism from a holistic perspective and to consider how cancer cells manage their need for glucose in the context of an entire mammalian organism. We note that relative to the total tissue mass of an organism, the volume of tumor is generally low. Therefore, we hypothesized that activation of intrinsic pathways alone may not be sufficient to provide adequate glucose to drive robust cancer cell growth. Indeed, to successfully compete for finite amounts of systemic glucose, malignant cells need to reduce the glucose utilization of normal tissues such as adipose tissue and muscle, both of which are major sites of glucose consumption. Hence, the focus of this study was to investigate the concept that the tumor cell populations may alter utilization of glucose through perturbation of normal physiology. This type of systemic rebalancing of biological processes has previously been reported, where stimuli such as aging or environmental stress induce the expansion or contraction of the homeostatic range, a process termed adaptive homeostasis (Davies, 2016).
Due to insulin resistance or/and abnormal insulin production, obese and diabetic patients reside in a state where their glucose utilization is hindered, a condition that causes increased levels of glucose in peripheral circulation. Therefore, in a diabetic macroenvironment, malignant cells would presumably have access to increased glucose. Furthermore, a common characteristic of type II diabetes is elevated insulin (hyperinsulinemia) (Shanik et al., 2008), a condition in which insulin increases proliferation of some cancer cells (Gallagher and LeRoith, 2010). Additionally, obesity/diabetes associated chronic inflammation also act to promote the spread and survival of tumors (Deng et al., 2016).
Further supporting a role for diabetic conditions in tumor pathogenesis, several studies have demonstrated the anti-cancer effects of anti-obesity/diabetic drugs (Dowling et al., 2012; Seguin et al., 2012). Of particular interest, drugs like metformin can have direct anti-cancer effects, but may also reduce hyperinsulinemia (Dowling et al., 2012), which could in turn modulate glucose metabolism and/or reduce direct stimulation of tumor cells. Together, these studies raise the possibility that anti-diabetic therapies may act to restore more normal systemic glucose metabolism and suppress growth of malignant cells.
Interestingly, obese populations are at a higher risk for certain types of solid tumors and leukemias (Basen-Engquist and Chang, 2011; Lichtman, 2010), suggesting a systemic link between tumor growth and metabolism. Indeed, previous studies have demonstrated that leukemic tumors alter multiple aspects of normal homeostasis. For example, we recently showed that inflammatory cytokines produced by leukemia cells elevate the lipolysis rate from adipose tissue leading to elevated serum free fatty acids (FFAs) (Ye et al., 2016). Leukemic tumors also influence tissue metabolism by inducing hypoxia (Benito et al., 2011). Previous studies in noncancer models have also shown that inflammation, fatty acids and hypoxia are potent inducers of insulin resistance (Rasouli, 2016; Samuel and Shulman, 2012). Based on the studies outlined above, we therefore sought to test the hypothesis that systemic adaptations caused by leukemia would result in insulin resistance and consequently reduce glucose utilization in normal tissues.
Results
Leukemia induces insulin resistance and reduces serum insulin level
To address the questions posed in this study, we first employed two independent mouse syngeneic models, generated by either the combination of BCR/ABL and NUP98/HOXA9 fusions (hereafter termed “BN” model), or the MLL/AF9 fusion (hereafter termed “MLL” model). Both systems provide models of aggressive primary acute myeloid leukemia (AML). Using systems of this type, we have previously demonstrated that adipose tissue (AT) serves as a reservoir for leukemia cells. Notably, AT resident leukemia cells are highly pro-inflammatory and induce both systemic secretion of inflammatory cytokines as well as lipolysis (Ye et al., 2016). Further, adipose tissue represents a non-hematopoietic microenvironment where leukemia cells are preferentially shielded from effects of chemotherapy. Thus, in our studies we examined leukemia burden in the disease-initiating environment of bone marrow (BM) as well as in the extramedullary context of adipose tissue.
The inflammatory cytokines and increased free fatty acids (FFAs) noted in our mouse models have the potential to act as inducers of insulin resistance (IR). We therefore directly examined insulin responsiveness using insulin tolerance tests (ITT). These studies demonstrated that the effect of insulin on leukemic mice was significantly impaired in the BN and MLL models (Figures 1A and S1A). To further evaluate systemic glucose metabolism in leukemic mice, we examined adipose and muscle tissues, which are the major glucose utilization sites in mammalian organisms and play critical roles in the development of IR. We found that both gonadal adipose tissue (GAT) and soleus muscle displayed a lower rate of basal and insulin-stimulated glucose utilization in leukemic mice compared to normal mice (Figures 1B and S1B). Additionally, a significantly weaker induction of p-Akt was observed in GAT from leukemic mice challenged with insulin (Figure 1C), suggesting a tissue intrinsic failure to mediate insulin signaling. Together, these data support the hypothesis that leukemic mice are insulin resistant.
Figure 1. Leukemia induces IR and reduces serum insulin level.

(A) Insulin tolerance tests (ITT) performed on normal and BN mice (n=8). (B) Glucose utilization by gonadal adipose tissue (GAT) from normal and BN mice at the basal and insulin-stimulated conditions (n=3). (C) Starved normal and BN mice were treated with insulin for 30 min and GAT were harvested for detection of p-Akt. (D) Fasting blood glucose levels in normal and BN mice (n=4). (E) Glucose utilization in normal hematopoietic cells, and leukemia and non-leukemia cells from BN bone marrow. (F) Sorted BN leukemia cells were treated with BSA, insulin (1 ng/ml), IGFBP1 (200 ng/ml), or insulin (1 ng/ml) plus IGFBP1 (200 ng/ml) for 30 min. Cells were harvested for detection of indicated protein. (G) Fasting serum insulin levels in normal, BN and MLL mice (n=5). (H) GAT leukemic burden in type-1 diabetic BN mice (n=5). (I-J) BN mice were treated with insulin. GAT and BM leukemic burden (I), and serum FFAs (J) were examined (n=6). Data are represented as mean ± SD. See also Figure S1.
Elevated levels of peripheral glucose are usually seen in individuals with IR. Therefore, we hypothesized that the induction of IR would provide leukemia cells with more glucose. Notably, blood glucose levels in leukemic mice were actually lower than normal mice (Figure 1D), suggesting that in balance, consumption of glucose by leukemia cells is so great, that even with increased availability, net glucose in circulation is reduced. This concept is supported by the studies shown in Figure 1E, where glucose utilization by normal hematopoietic cells or nonleukemia cells from leukemic BM were compared to leukemia cells. The data demonstrate that leukemia cells have dramatically increased glucose consumption. Notably, glucose utilization in normal hematopoietic cells and non-leukemia cells was enhanced by insulin; however, leukemia cells did not respond to insulin as reflected by their glucose utilization and p-Akt level (Figures 1E and 1F), indicating that the systemic insulin-resistant phenotype observed in leukemic mice will not affect glucose utilization by leukemic cells. Of note, in contrast to some studies suggesting that insulin promotes certain types of cancer growth (Gallagher and LeRoith, 2010), our findings indicate that at least in leukemias, insulin does not function as a promoter for glucose utilization and cell proliferation (Figure S1C).
A compensatory increase in serum insulin i.e. hyperinsulinemia is usually seen during the development of IR. Hyperinsulinemia has been suggested to be one of the mechanisms for higher risk for some cancer types due to its role in promoting cell proliferation (Arcidiacono et al., 2012). However, in both murine leukemia models, serum insulin levels were significantly reduced (Figures 1G and S1D), a phenomenon that is seen in type 1 diabetic patients. Therefore, we hypothesized that modulations of insulin levels would affect disease progression. To test this hypothesis, we first employed the streptozotocin (STZ)-induced type 1 diabetes model, a system in which pancreatic beta cells are damaged by administration of STZ, thereby inducing hypoinsulinemia and hyperglycemia (Figure S1E). Leukemia generated in these mice showed increased tumor burden in GAT and higher levels of serum FFAs than non-diabetic leukemic mice (Figures 1H and S1F). We did not observe increased BM leukemic burden in diabetic mice (Figure S1G). This is likely due to impairment of the BM microenvironment induced by STZ (Motyl and McCabe, 2009) as we observed reduced hematopoietic stem/progenitor cells (lin- Sca+c-kit+) in non-leukemic diabetic mice (Figure S1H). Next, we asked whether insulin supplementation would benefit leukemic mice. As shown in Figure 1I, insulin treatment significantly decreased leukemic burden in GAT and BM. Reduced lipolysis was achieved by insulin treatment as well (Figure 1J). Additionally, leukemia-induced body weight loss as well as atrophy of GAT was alleviated by insulin treatment (Ye et al., 2016) (Figures S1I and S1J). Insulin also reduced BM leukemic burden in MLL mice, while its effect on GAT leukemic burden was minimal (Figure S1K). Collectively, our data suggest that the physiological state induced by leukemia results in insulin resistance and loss of circulating insulin, both of which increase the glucose availability for the growth of leukemic tumors.
Adipose-derived IGFBP1 induces the development of insulin resistance in leukemia
Having established that leukemic mice are insulin resistant, we next addressed the mechanism by which this condition is induced. Adipose tissue, through its endocrine function, regulates systemic homeostasis and is known to be involved in the development of IR (Bjorndal et al., 2011). To investigate the potential role of adipose tissue in leukemia-induced IR, we compared the endocrine function between normal and leukemic adipose tissue. Adipokine arrays were performed on conditioned medium (CM) from normal and leukemic GAT. We observed that one of the adipokines, IGFBP1, was highly elevated in CM from leukemic GAT relative to normal GAT (Figure 2A). We validated this finding and found that IGFBP1 in the leukemic GAT CM was approximately 50-fold higher than control (Figure 2B). Notably, mRNA and protein levels of IGFBP1 were significantly increased in both GAT and inguinal adipose tissue (IAT) from leukemic mice relative to normal mice (Figures 2C and S2A). In normal physiology, IGFBP1 is primarily produced by the liver. While some elevation of IGFBP1 is evident in the liver of leukemic mice (Figure 2C), the majority of aberrant IGFBP1 is produced in the adipose tissue.
Figure 2. Adipose-derived IGFBP1 induces the development of IR in leukemia.

(A) Adipokine arrays on conditioned medium (CM) from normal and BN GAT. Red circle indicates IGFBP1. (B) IGFBP1 levels in CM from normal and BN GAT. (C) IGFBP1 protein levels in GAT, inguinal adipose tissue (IAT) and liver from normal and BN mice. Recombinant (RB) mouse IGFBP1 protein and liver protein extracts were served as positive controls. (D) Serum IGFBP1 levels in normal and BN mice (n=5). (E) Serum IGFBP1 levels in BN mice at different time points after leukemic transplantation (n=4). (F) 3T3-L1 adipocytes were serum starved for 1 hr and then treated with RGD peptides for 30 min. Cells were then treated with insulin (1 ng/ml) and IGFBP1 (200 ng/ml) for 30 min for detection of indicated protein. (G) ITT performed on normal mice treated with IGFBP1 (n=8). (H) Serum IGFBP1 levels in BN mice treated with insulin (n=6).. (I-J) Serum IGF1 levels in normal and BN mice were detected by ELSIA (n=6, I) and immunoblot (J). Data are represented as mean ± SD. See also Figure S2.
Previous studies have indicated that IGFBP1 may have a role in the development of insulin resistance (Lewitt et al., 2014). Therefore, to explore a potential in vivo role for IGFBP1, we first examined the serum level of IGFBP1 in leukemic mice and observed the IGFBP1 level at more than one hundred times the level detected in normal mice (Figure 2D). Further, in monitoring the development of leukemic disease, a gradual elevation of serum IGFBP1 was noted (Figure 2E). Elevated IGFBP1 was detected as early as day 6 after leukemic transplantation when disease burden was below 1% in both BM and GAT (Figure S2B). Elevated IGFBP1 was also evident in MLL mice (Figure S2C), and we confirmed that adipose tissues were the source of the aberrant IGFBP1 (Figures S2D and S2E). Together, these data suggest that the aberrant high level of IGFBP1 is a prevalent systemic feature of leukemic disease.
Having established that leukemia induces a prominent level of peripheral IGFBP1, we examined the role of IGFBP1 in the development of IR. We treated 3T3-L1 adipocytes with IGFBP1 and found that insulin effects on these adipocytes were partially blocked by IGFBP1 (Figure 2F). Next, we treated normal GAT explants with IGFBP1 in the presence or absence of insulin. As shown in Figure S2F, high doses of IGFBP1 partially impaired insulin effects on GAT. IGBFP1 functions as a ligand for integrin receptors due to its arginine-glycine-aspartic acid (RGD) motif in the C terminus (Wang et al., 2015). Additionally, the integrin receptor mediated pathway has been implicated in the development of IR (Kang et al., 2016). Therefore, we hypothesized that IGFBP1 mediated IR was at least partially through the integrin receptor mediated pathway. Indeed, an RGD peptide restored the insulin effect on IGFBP1-treated 3T3-L1 adipocytes as shown by increased p-Akt and p-IR (insulin receptor) levels (Figure 2F). To further examine IGFBP1 function in vivo, normal mice were treated with high doses of IGFBP1 for 2 weeks. Reduced insulin sensitivity was observed in IGFBP1 treated mice (Figure 2G). These data suggest that high doses of IGFBP1 induce IR.
Several previous studies have indicated an interplay between insulin and IGFBP1 (Lewitt et al., 2014). We found that insulin treatment decreased serum IGFBP1 in leukemic mice (Figure 2H). Further, IGFBP1 level was elevated in diabetic leukemic mice (Figure S2G). These data indicate that serum IGFBP1 is negatively correlated with serum insulin in the context of leukemia.
IGFBP1 binds to and affects IGF1 biological functions (Firth and Baxter, 2002). We observed a significantly decrease in serum IGF1 in BN mice compared to normal mice (Figures 2I and 2J). IGF1 plays a similar role in glucose metabolism as insulin (Schiaffino and Mammucari, 2011). Indeed, IGF1 treatment induced phosphorylation of Akt in 3T3-L1 adipocytes and this effect was attenuated by IGFBP1 (Figure S2H). Therefore, functional loss of IGF1 may contribute to the insulin resistant phenotype in leukemic mice as well.
Together, the above data suggest that leukemic tumors induce high level production of IGFBP1 from adipose tissue, which in turn acts to impair insulin/IGF1 function and induce an insulin resistant condition.
Modulation of IGFBP1 mediates leukemia growth in vivo
To further confirm that IGFBP1 contributes to leukemia-induced IR, leukemic mice were treated with an IGFBP1 neutralizing antibody. As shown in Figures 3A, 3B and S3A, insulin sensitivity and serum insulin levels were partially restored by blockage of IGFBP1, indicating that IGFBP1 not only mediates insulin sensitivity, but is also involved in regulating serum insulin levels. Importantly, GAT leukemic burden was significantly reduced by IGFBP1 blockage (Figure 3C), and BM leukemic burden was mildly but significantly reduced (Figure S3B). Further, lipolysis rate, atrophy of GAT, and overall body weight loss were all mitigated by IGFBP1 blockage (Figures 3D, S3C and S3D).
Figure 3. Modulation of IGFBP1 mediates leukemia growth in vivo.

(A) ITT performed on BN mice treated with anti-IGFBP1 antibody (n=8). (B-D) Fasting serum insulin (B), GAT leukemic burden (C) and serum FFAs (D) in BN mice treated with anti-IGFBP1 antibody (n=5). (E) Example images and quantification of femur trabecular bone mass examined by Micro-CT (n=4). (F-G) BM and GAT leukemic burden (F) and fasting serum insulin (G) in BN mice preconditioned with IGFPB1 (n=5). Data are represented as mean ±SD. See also Figure S3.
IGFBP1 has recently been identified as a promoter for osteoclasts through activation of the Erk signaling pathway (Wang et al., 2015). Given the fact that leukemia pathogenesis can induce severe bone loss (Frisch et al., 2012), we hypothesized that IGFBP1 blockage would reduce bone loss in leukemic mice. Indeed, increased trabecular bone mass was observed in leukemic mice that received anti-IGFBP1 treatment (Figures 3E and S3E). These data suggest that an adiposebone axis is activated by leukemia during disease progression.
Next, we tested whether IGFBP1-preconditioning would facilitate disease progression. As shown in Figures S3F and 3F, IGFBP1-preconditioned mice had higher serum IGFBP1 and higher BM leukemic burden. Additionally, early body weight loss as well as atrophy of GAT was found in IGFBP1-preconditioned mice (Figures S3G and S3H). Further, serum insulin was reduced in IGFBP1-preconditioned mice (Figures 3G and S3I). While GAT leukemic burden did not significantly vary between preconditioned and control groups, due to logistical constraints, the analysis was performed at relatively low disease burden, making detection of differences more challenging.
Besides its systemic effects, IGFBP1 also functions as a signaling molecule in hematopoietic cells (Wang et al., 2015), an activity which may have a direct effect on leukemia cell proliferation. Indeed, increased proliferation was observed in leukemia cells treated with IGFBP1 (Figure S1C). The mitogenic effect of IGFPB1 on leukemia cells was probably due to activation of the Erk signaling pathway, which was blocked by IGF1 (Figures 1F and S3J). Additionally, phosphorylated p38 was reduced in IGFBP1 treated leukemia cells (Figure 1F), suggesting that IGFBP1 also reduced cellular stress and might promote survival of leukemia cells.
Together, these data suggest that leukemic tumors induce production of IGFBP1, which in turn facilitates disease progression by modulating host insulin sensitivity and peripheral insulin levels as well as by affecting leukemia cell proliferation and survival.
Loss of active GLP-1 and serotonin contributes to inhibition of insulin secretion in leukemia pathogenesis
Reduced serum insulin further exacerbates IR, a scenario that is seen in late stage type 2 diabetic patients. Thus, we next investigated the mechanisms for reduced serum insulin in leukemic mice. Immunofluorescent (IF) staining was performed on pancreas from normal and leukemic mice to examine insulin production. As shown in Figure 4A, a comparable staining intensity of insulin was observed between normal and leukemic pancreas. Further, glucose stimulated insulin secretion assays (GSIS) showed even stronger insulin release in leukemic mice challenged with a high dose of glucose (Figures 4B and S4A). These data suggest that insulin synthesis in pancreatic cells was comparable between normal and leukemic mice, however, insulin secretion under physiologic glucose levels was impaired in leukemic mice. Interestingly, even with the strong induction of insulin caused by glucose bolus in leukemic mice and a much higher glucose utilization by leukemia cells (Figure 1F), glucose tolerance tests (GTT) demonstrated that the clearance of glucose was comparable between normal and leukemic mice (Figure 4C), further corroborating the fact that leukemic mice are insulin resistant.
Figure 4. Increased DPP4 and loss of active GLP-1 contribute to the inhibition of insulin secretion in leukemia pathogenesis.

(A) Immunofluorescent staining for insulin in pancreas from normal, BN and MLL mice. (B) Glucose stimulated insulin secretion (GSIS) performed on normal, BN and MLL mice (n=4). (C) Glucose tolerance test (GTT) performed on normal and BN mice (n=6). (D-E) Fasting serum DPP4 (D) and active GLP-1 levels (E) in normal and BN mice (n=5). (F-I) Fasting serum insulin (F), serum IGFBP1 (G), serum FFAs (H), and BM and GAT leukemic burden (I) in exenatide treated BN mice (n=6). Data are represented as mean ± SD. See also Figure S4.
To further investigate leukemia-induced suppression of insulin secretion, we examined peripheral levels of incretins and serotonin, both of which act to stimulate insulin release under various conditions (Kim and Egan, 2008; Sugimoto et al., 1990). Incretins such as GLP-1 regulate both insulin secretion and insulin sensitivity (Kim and Egan, 2008). We observed that DPP4, an enzyme known to inactivate incretins, was elevated in leukemic serum (Figure 4D), and that active GLP-1 was reduced (Figure 4E). To further evaluate the involvement of GLP-1 in insulin secretion in our model, leukemic mice were treated with Saxagliptin, a DPP4 inhibitor, or Exenatide, a GLP-1 receptor agonist. We found that treatment with either Saxagliptin or Exenatide partially restored insulin levels in leukemic mice (Figures 4F, S4B and S4C). Additionally, IGFBP1 and lipolysis was suppressed in treated mice (Figures 4G, 4H, S4D and S4E). Importantly, leukemic burden in both BM and GAT was reduced by Saxagliptin and Exenatide treatments (Figures 4I and S4F). Together, our data indicate that leukemia-induced production of DPP4 acts to suppress insulin secretion, which thereby promotes disease progression.
Next, we investigated the role of serotonin in leukemia-induced inhibition of insulin secretion. We found serum serotonin was drastically reduced in both models of leukemia (Figures 5A and S5A). Peripheral serotonin is primarily derived from gut. Expression of TPH1, encoding the rate-limiting enzyme for serotonin synthesis, was significantly reduced in the colon tissue of leukemic mice (hereafter termed ‘leukemic colons’) (Figure 5B). We also noticed reduced expression of MAOA, which encodes an enzyme to catabolize serotonin, probably due a rescue effect for serotonin loss. Serotonin regulates gastrointestinal (GI) transition (Yano et al., 2015). We observed that the average GI transition time for leukemic mice was significantly increased (Figure 5C), corroborating a functionally relevant reduction in serotonin in leukemic mice.
Figure 5. Loss of serotonin leads to the inhibition of insulin secretion in leukemia pathogenesis.

(A) Serotonin levels in normal and BN mice (n=4). (B) Expression of gene involved in serotonin metabolism in the colon tissues from normal and BN mice. (C) GI transition time in normal and BN mice (n=5). (D-G) Fasting serum insulin (D), serum IGFBP (E), GAT and BM leukemic burden (F), and serum FFAs (G) in serotonin treated BN mice (n=5). (H) Serum serotonin levels in anti-IGFBP1 antibody treated BN mice (n=5). Data are represented as mean ± SD. See also Figure S5.
To examine the role of serotonin in insulin secretion in our models, leukemic mice were supplemented with serotonin. As expected, serum insulin levels were partially restored by serotonin supplementation (Figures 5D and S5B). Further, IGFBP1 levels were suppressed and both BM and GAT leukemic burden was significantly reduced by serotonin treatment (Figure 5E, 5F). Additionally, the lipolysis rate, GAT atrophy, and overall body weight loss were suppressed by serotonin treatment (Figures 5G, S5C and S5D). Intriguingly, IGFBP1 blockage by anti-IGFBP1 antibody mildly restored serotonin levels in leukemic mice (Figure 5H) while IGFBP1-preconditioning decreased serotonin levels (Figure S5E), suggesting that the benefits of anti-IGFBP1 treatment on leukemic mice were at least partially acting through a serotoninmediated pathway and that there was interplay between these two molecules. Collectively, these data suggest that impaired serotonin production is a central systemic feature of leukemia pathogenesis, which acts to suppress insulin secretion and thereby promotes disease progression.
Leukemia-associated microbiota facilitates disease progression
The loss of serotonin and increased GI transition time noted above indicate the presence of pathological changes in the gut of leukemic mice. Indeed, the expression of several inflammatory genes were upregulated in leukemic colons (Figure S6A). Interestingly, dysregulated expression of anti-microbial genes was observed in leukemic colons (Figure 6A), indicating the colonic microenvironment was altered in leukemic mice. This type of change would be predicted to result in dysbiosis. Notably, it has recently been shown that gut microbiota serve as a central regulator for metabolism, where metabolites from microbiota influence gut homeostasis and have a profound impact on systemic homeostasis (Nicholson et al., 2012). Thus, we postulated that the microbiota could be an important component of the overall adaptive homeostasis we saw in leukemia.
Figure 6. Leukemia-associated microbiota facilitates disease progression.

(A) Expression of anti-microbial genes in the colon tissues from normal and BN mice. (B) 16S-rRNA-sequencing was performed on the fecal materials collected from normal and BN mice (day 13 after leukemic transplantation). Circle indicates Bacteroidales S24–7. (C-E) BM and GAT leukemia burden (C), serum IGFBP1 (D), and fasting serum insulin (E) in BN mice transplanted with fecal materials from normal or BN mice (n=7). (F) BM and GAT leukemic burden in BN mice treated with Abx (n=5). (G) Serum IGFBP1 levels in BN mice treated with Abx (n=5). (H) ITT performed on nonleukemic mice transplanted with normal or BN fecal materials (n=8). (I) Fasting blood glucose and fasting serum insulin levels in non-leukemic mice transplanted with normal or BN fecal materials (n=7). Data are represented as mean ± SD. See also Figure S6 and Table S1.
To compare the gut flora between normal and leukemic mice, 16S-rRNA-sequencing was performed on fecal materials from leukemic and normal mice. As shown in Figures 6B and S6B and Table S1, the composition of gut flora in leukemic mice differed from that of normal mice. To test the functional potential of leukemia-induced microbiota, we performed fecal materials transfer experiments. As outlined in Figure 6C, normal recipient mice were pretreated with an antibiotic cocktail (Abx) (Hill et al., 2010) and then transplanted with fecal materials from normal or leukemic mice. Following two weeks to allow gut colonization, animals were then transplanted with leukemia cells. As shown in Figure 6C, compared to animals transplanted with fecal materials from normal mice, GAT leukemic burden was significantly higher in mice transplanted with fecal materials from leukemic mice. Additionally, serum IGFBP1 was significantly increased and insulin was reduced in leukemic mice receiving leukemic fecal materials (Figures 6D, 6E and S6C). Together, these data suggest that leukemia-associated microbiota contribute to the overall systemic perturbations observed in leukemia and act to facilitate disease progression.
To further demonstrate the role of microbiota in disease progression, the gut microbiota of a cohort of mice was ablated using Abx and leukemic progression was monitored. We found that BM leukemic burden was mildly reduced, and GAT leukemic burden was remarkably decreased by Abx treatment (Figure 6F). Further, a striking reduction in serum IGFBP1 was observed in Abx-treated leukemic mice (Figure 6G). Additionally, serum insulin levels were partially restored and serum FFAs were reduced in Abx-treated animals (Figures S6D and S6E). Collectively, these data confirm that the microbiota play a role in leukemia progression.
Next, we asked whether the leukemic microbiota was linked to the regulation of insulin sensitivity. Previous studies have shown that transferring microbiota from obese or insulin resistant donors induces similar phenotypes in recipients (Baothman et al., 2016). As shown in Figure 6H, transfer of leukemic fecal materials impaired insulin sensitivity in recipient mice. Additionally, fasted blood glucose and insulin levels were significantly higher in mice receiving leukemic fecal materials (Figures 6I and S6F). Together, these data suggest that the leukemiaassociated microbiota contribute to the leukemia-induced insulin resistant phenotype.
Collectively, these findings indicate leukemic tumors induce dysbiosis and that leukemiaassociated microbiota facilitate leukemia progression at least partially through induction of IR.
Microbiota-derived short chain fatty acids (SCFAs) impede leukemia progression and are reduced in leukemic mice
Microbiota are a key regulator of gut homeostasis and dysbiosis contributes to pathological changes of gut. Indeed, we observed that leukemic mice had shortened colons and that there was a clear loss of gut epithelia integrity (Figures S7A and 7A). Additionally, genes that are directly involved in the regulation of epithelial integrity were dysregulated in leukemic colon (Figure S7B). Further, we observed morphological changes in leukemic colons and invasion of leukemia cells into the colon epithelia, which may contribute to the loss of epithelial integrity (Figure 7B).
Figure 7. Microbiota-derived short chain fatty acids (SCFAs) impede leukemia progression and are reduced in leukemic mice.

(A) Serum FITC-Dextran levels in normal and BN mice (n=5). (B) Hematoxylin and Eosin (H&E, left two images) staining and GFP (for leukemia cells, right two images) staining of colon tissues from normal and BN mice. (C) The amount of butyrate and propionate in fecal samples from normal and BN mice (n=8). (D-G) Serum FITCDextran (D), BM and GAT leukemic burden (E), serum IGFBP1 (F), and fasting serum insulin (G) in tributyrin treated BN mice (n=6). (H) BM and GAT leukemic burden in BN mice treated with combination of tributyrin and serotonin (Ser-Tri) (n=7). (I) Survival curve for BN mice treated with Ser-Tri therapy (tributyrin and serotonin) (n=8). (J) A cartoon showing the experimental procedure and the glucose utilization in vehicle treated and Ser-Tri therapy treated (one-time treatment) leukemic mice (n=4). (K) Representative images of 18F-fluorodeoxyglucose (FDG) uptake by PET-CT scanning in normal mice, untreated and Ser-Tri treated BN mice. Normalized uptake values fold change examined by FDG-PET are presented in the graph (n=4). (L)Schematic representation of the treatment protocol and the survival curve for BN mice treated with chemotherapy alone or chemotherapy combined with the Ser-Tri therapy (n=9). Data are represented as mean ± SD. See also Figure S7.
Given the multiple signs of gut dysfunction and dysbiosis noted above, we asked whether products of the microbiota were altered in leukemia mice. Specifically, short chain fatty acids (SCFAs) are secreted by specific types of gut bacteria and have major impacts on gut biology such as regulating gut epithelial integrity (Kelly et al., 2015). Interestingly, 16S-Rrna-sequencing showed that the proportion of several bacterial taxa with members capable of making SCFAs were significantly reduced in the fecal materials from leukemic mice including the Lachnospiraceae and Bacteroidales S24–7 families (Evans et al., 2014; Ormerod et al., 2016), and the butyrate producing genus Anaerostipes (Figures 6B, S6B and Table S1). Indeed, fecal samples from leukemic mice had lower levels of the SCFAs butyrate and propionate (Figure 7C). To test the functional relevance of this observation, we treated leukemic mice with tributyrin or propionate and observed a partial rescue of GI epithelial integrity (Figures 7D and S7C). Strikingly, tributyrin suppressed BM and GAT leukemic burden and propionate suppressed GAT leukemic burden (Figure 7E and S7D). Additionally, serum IGFBP1 levels were reduced and insulin levels were increased by tributyrin and propionate treatments (Figures 7F, 7G and S7ES7G). Together, these data suggest that dysbiosis in leukemic mice results in loss of microbiotaderived SCFAs, which contributes to the leukemia-induced adaptive homeostasis by influencing gut epithelial integrity and modulating IGFBP1 and insulin levels.
Restoring systemic glucose metabolism provides survival benefits
Our findings strongly suggest that tumor progression can be significantly affected by systemic glucose metabolism. Indeed, the data in Figures 5D, 5E, 7F and 7G show that serotonin and tributyrin supplementation, through distinct mechanisms, were effective means to restore serum insulin and IGFPB1 levels. Therefore, combined supplementations with both serotonin and tributyrin (hereafter termed ‘Ser-Tri’) were selected to treat leukemic mice. As shown in Figure 7H, leukemia burden was strongly suppressed in both BM and GAT by the Ser-Tri treatment. More importantly, Ser-Tri therapy provided leukemic mice with significant survival benefits (Figure 7I).
To confirm that the benefits of Ser-Tri therapy are due to modulations of systemic glucose metabolism, glucose utilization in leukemia cells and gonadal adipose tissue (GAT) was assessed. As shown in Figure 7J, in vivo analyses demonstrated that leukemia cells had a significant reduction in glucose utilization after Ser-Tri therapy treatment, whereas glucose utilization in GAT was increased (Figure 7J). Interestingly, in vitro analyses showed that the differences in glucose utilization between leukemia cells isolated from vehicle treated and Ser-Tri therapy treated leukemic mice were minimal (Figure 7J), indicating that the Ser-Tri therapy exerted its anti-leukemic effects by redirecting the systemic glucose flow from leukemia cells to host tissues not by directly affecting leukemia cell glucose metabolism.
To further investigate the effects of Ser-Tri therapy on systemic glucose metabolism, we employed positron emission tomography-computed tomography (PET-CT) to visualize the uptake of glucose. As shown Figures 7K and S7H, glucose uptake was already dramatically increased in the spleen and BM and conversely decreased in the muscle tissue from BN mice compared to normal ones. Ser-Tri therapy significantly reduced glucose uptake in both BM and spleen and promoted glucose uptake in muscle from BN mice (Figures 7K and S7H). Interestingly, we also observed that glucose uptake in the liver of BN mice was increased compared to normal mice and Ser-Tri treatment also reduced BN liver glucose uptake (Figure 7K). Our previous studies (data not shown) indicate strong leukemic infiltration of liver in the BN model, suggesting that liver is one of the many organs in which glucose metabolism should be altered. Together, these results strongly support the concept that leukemic progression can be significantly attenuated by modulations of systemic glucose metabolism alone.
Next, we asked whether modulation of the systemic glucose metabolism could be an adjuvant therapy for chemotherapy. Leukemic mice were treated with chemotherapy alone (Ye et al., 2016) or chemotherapy with the Ser-Tri therapy. As shown in Figure 7L, chemotherapy administered with the Ser-Tri therapy significantly increased the survival of leukemic mice compared to chemotherapy alone.
Collectively, our findings suggest that either alone or functioning as an adjuvant therapy, management of systemic glucose metabolism provides significant survival benefits.
Human leukemia induces an insulin resistant phenotype
To examine whether the findings in murine models can be recapitulated in human leukemia, we first compared the serum IGFBP1 level between normal controls, myelodysplastic syndrome (MDS) patients and acute myeloid leukemia (AML) patients. As shown in Figure 8A, an approximately 20-fold higher of IGFBP1 was observed in serum samples from AML patients compared to normal controls. Notably, serum IGFBP1 levels in MDS patients were elevated compared to normal controls, but less than AML patients (Figure 8A), consistent with a progressive increase in IGFBP1 production as pathogenesis proceeds from chronic to acute phase disease. Additionally, we found that serum IGFBP1 level was significantly correlated with leukemic blast counts in AML patients (Figure S8A). Further, BM aspirates from leukemia patients contained significantly higher IGFBP1 than in BM aspirates from normal controls (Figure 8B). To further confirm the correlation between IGFBP1 level and disease burden, we compared BM aspirate IGFPB1 levels between paired diagnostic, remission and relapsed AML samples. As shown in Figure 8C, the IGFPB1 level was significantly reduced in remission samples compared to diagnostic samples, but rebounded in relapsed samples. Similar results were observed in BN mice that underwent chemotherapy-induced remission followed by relapse (Figure S8B). Collectively, our results suggest that an aberrant elevation of IGFBP1 may function as a biomarker for disease burden.
Figure 8. Human leukemia induces an insulin resistant phenotype.

(A) Serum IGFBP1 levels in normal controls (n=6), MDS (n=10), and AML (n=13) patients. (B) IGFBP1 level in normal (n=5) and AML (n=5) BM aspirate. (C) IGFBP1 levels in paired BM aspirates from newly diagnostic, remission, and relapsed AML patients. (D) Cytokine arrays performed on serum samples from normal controls and AML patients. (E) Serum FFA levels in normal controls, and MDS and AML patients. (F) ITT performed on NSG mice transplanted with a human primary leukemia sample (n=8). (G) Serum IGFBP1 levels in normal NSG mice and NSG mice transplanted with a human primary leukemia sample (n=8). (H) Serum serotonin levels in normal controls, and MDS and AML patients. (I) Serotonin levels in paired BM aspirates from newly diagnostic, remission and relapsed AML patients. (J-K) Serum insulin levels (J) and serum glycated protein levels (K) in normal controls, and MDS and AML patients. (L) Schematic summary of system-wide perturbations leading to altered glucose utilization in leukemia. Data are represented as mean ± SD. See also Figure S8.
Next, we examined whether human leukemia would induce insulin resistance. We first compared serum cytokine profiles between normal controls and AML patients and found several inflammatory mediators including TNFSF13B, PF4, IL-8, TIM-3, PLAUR, ICAM-1 and CHI3L1 were all elevated in AML serum (Figures 8D and S8C), suggesting that AML patients are generally in an inflammatory state. Interestingly, using the TCGA survival dataset, we found that AML patients with higher expression of TNFSF13B or PF4 displayed a lower survival rate compared to patients with lower expression of TNFSF13B or PF4 (Figure S8D). Notably, two insulin resistance indicators leptin and resistin (Barnes and Miner, 2009; Yadav et al., 2013), were also increased in AML serum (Figures S8C and 8D). Further, we observed a progressive increase of serum FFAs from MDS to AML patients compared to normal controls (Figure 8E). These data indicate that the leukemia-induced host metabolic changes observed in mouse models were evident in human patients as well.
To further confirm that human leukemia induces insulin resistance in the host, we transplanted a primary human blast crisis chronic myeloid leukemia (bcCML) sample into immunodeficient NSG mice and performed insulin tolerance tests (ITT). As shown in Figure 8F, insulin effects on leukemic NSG mice were impaired compared to normal NSG mice, suggesting that human leukemia also induced insulin resistance. Additionally, serum IGFBP1 was significantly elevated in leukemic NSG mice (Figure 8G). Together, these data suggest that leukemia-induced production of inflammatory cytokines, IGFPB1 and FFAs leads to insulin resistance in AML patients.
Lastly, we asked whether there were indications of gut dysfunction in leukemia patients. We examined serotonin levels in human serum samples and found a progressive loss of serotonin from MDS to AML patients compared to normal controls (Figure 8H). Further, serotonin levels were increased in remission AML patient BM aspirate samples compared to paired diagnostic samples (Figure 8I). Seven of the nine paired samples tested show decreased serotonin levels in the relapsed state (Figure 8I). We next examined insulin levels in patient serum samples considering the regulatory role of serotonin in peripheral insulin levels. Interestingly, insulin levels were mildly but significantly reduced in AML serum but were elevated in MDS serum (Figure 8J). Further, glycated serum proteins, whose levels function as surrogates for blood glucose levels, were decreased in AML serum but were increased in MDS serum (Figure 8K). These data suggest that in the chronic phase of disease (MDS), there is already an insulin resistant phenotype. When disease progresses to an acute phase (AML), the consumption of systemic glucose is greatly increased so that even with reduced insulin levels, the peripheral glucose levels are reduced. These results were consistent with our observations in mouse models.
Collectively, our results suggest that human leukemia induces an insulin resistant phenotype through production of inflammatory mediators, IGFBP1 and FFAs to support tumor growth.
Discussion
The primary goal of this study was to investigate how leukemic malignancies may influence systemic regulation of glucose. We demonstrate that by co-opting multiple systemic regulatory mechanisms, leukemic tumors appear to induce a diabetic state in the host and desensitize normal tissues to glucose. We propose that this biological state represents a type of parasitism, whereby the tumor cells simultaneously deprive normal cells of glycolytic fuel while increasing the availability of glucose to drive their own growth.
We demonstrate that leukemic tumors induce insulin resistance. The underlying mechanisms that cause insulin resistance derive from a form of leukemia-induced adaptive homeostasis. As summarized in Figure 8L, we observe the involvement of multiple organs and an intricate interplay between processes that influence glucose metabolism. Among the most prevalent perturbations is a massive up-regulation of IGFBP1, which results in insulin resistance and inhibition of insulin secretion. In addition, secretion of insulin from pancreas was inhibited due to loss of active GLP-1 and strong suppression of peripheral serotonin. Concomitantly, dysbiosis appears to exacerbate insulin resistance by reducing the production of SCFAs from gut bacteria. The overall effect of these systemic perturbations is desensitization of normal tissues to glucose. We propose that leukemic cells, whose glucose utilization is not responsive to insulin, consequently have a competitive advantage for acquisition and utilization of systemic glucose.
Going forward it will be important to further elucidate the mechanisms leading to leukemiainduced adaptive homeostasis. Our studies demonstrate that the benefits of anti-IGFBP1 treatment are partially due to serotonin mediated pathways and that several treatments including antibiotics, anti-diabetic drugs and supplementation of SCFAs and serotonin reduce adipose IGFBP1. However, the details of the interplay between these molecules in a leukemic environment is as yet unclear. Additionally, different treatments displayed distinct effects on reducing leukemic burden and alleviating leukemia-induced metabolic syndromes, indicating there is hierarchy of these systemic regulatory mechanisms in facilitating disease progression. Thus, we believe further investigating the molecular network that mediates leukemia-induced adaptive homeostasis may lead to improved strategies for disease management of patients with leukemia, or other forms of cancer in which similar biology is evident.
An intriguing observation of our study is the involvement of microbiota in disease progression. As documented by a number of recent studies, dysbiosis results in metabolic abnormalities and is implicated in a variety of disorders, including colon cancer (Boulange et al., 2016; Nicholson et al., 2012). Interestingly, patients suffering from colonic abnormalities such as inflammatory bowel disease have a higher risk for leukemia (Madjlessi et al., 1986). Our findings suggest that the adaptive homeostasis induced by leukemic tumors at least partially arises due to the composition of the gut microbiota found in leukemic animals. We speculate that loss of gut epithelial integrity and dysbiosis in leukemic mice may result in entry of endotoxin to the host to augment systemic inflammation. Additionally, production of SCFAs and serotonin is regulated by microbiota, and is clearly perturbed in leukemic animals. These findings imply that microbiota may contribute to leukemic disease pathogenesis via multiple mechanisms.
In summary, our findings demonstrate that leukemic tumors induce adaptive homeostasis as a mechanism to subvert normal processes and gain a competitive growth advantage. Our observations show that the intricate network regulating in vivo glucose metabolism is co-opted so as to desensitize normal tissues, and we propose that this phenomenon leads to increased glucose availability for malignant cells. These findings provide insights into systemic tumor biology and create potentially strategies for disease management.
STAR Methods
CONTACT FOR REAGENT AND RESOURCE SHARING
Further information and requests for resources and reagents should be directed to and will be fulfilled by the Lead Contact, Craig T. Jordan (Craig.Jordan@ucdenver.edu).
EXPERIMENTAL MODEL AND SUBJECT DETAILS
Human primary blast crisis chronic myeloid leukemia (bcCML) samples, human serum and bone marrow aspirate samples
The primary bcCML sample, human serum and BM aspirate samples were from patients or healthy age-matched donors who gave informed consent for sample procurement. All specimen acquisition was approved by the University of Colorado Institutional Review Board.
Mouse strains and husbandry
Wild-type C57BL/6J mice, breeders of B6 Cd45.1, Pep Boy mice and NOD scid gamma (NSG) mice were purchased from Jackson Laboratory. All mice were housed at the University of Colorado Anschutz Medical Campus Animal Facility in a Specific Pathogen Free (SPF) facility with individually ventilated cages. The room has controlled temperature (20–22°C), humidity (30%–70%) and light (12-hour light-dark cycle). Mice were provided ad libitum access to a regular rodent chow diet. Littermates of the same sex (female or male) were randomly assigned to experimental groups. All animal experiments were approved by the Office of Laboratory Animal Resources (OLAR) at the University of Colorado Anschutz Medical Campus.
METHOD DETAILS
Generation of leukemia models
Generation of blast crisis chronic myeloid leukemia (bcCML) model (BN model)
The mouse model was created as described previously (Ye et al., 2016). Briefly, BM cells from 8- to 10-week-old naive female C57Bl6J mice were harvested and lineage+ (lin+) cells were depleted. LSK (lin-c-kit+Sca-1+) cells were sorted and cultured in LSK medium (IMDM containing 10% FBS, 10 ng/ml IL-3 and IL-6, 50 ng/ml SCF and Flt3L). The following day, LSK cells were infected with viral supernatant containing virus encoding two leukemic oncogenes BCR/ABL-GFP and NUP98/HOXA9-YFP twice a day for 3 days and subsequently injected through the retro-orbital sinus into 8- to 10-week-old naive female or male (sex-matched) B6 Cd45.1, Pep Boy mice. BM and spleen cells from leukemic mice were harvested and frozen for generation of 2nd leukemic mice. Unless stated in the text, recipient mice were receiving leukemia cells at the dose of 25,000 cells/mouse.
Generation of MLL/AF9 acute myeloid leukemia (AML) model (MLL model)
The mouse model was created as described previously (Ye et al., 2016). Briefly, LSK cells from female C57Bl6J mice were isolated and cultured in LSK medium and the following day LSK cells were infected with viral supernatant containing virus encoding the leukemic oncogene MLL/AF9-GFP twice a day for 3 days and subsequently injected through the retro-orbital sinus into 8- to 10-week-old naive female or male (sex-matched) B6 Cd45.1, Pep Boy mice. BM and spleens cells from leukemic mice were harvested for generation of 2nd leukemic mice. Secondary leukemic mice were used in this study. Unless stated in the text, recipient mice were receiving leukemia cells at the dose of 5,000 cells/mouse.
Xenograft models
Xenograft model was created as described previously (Ye et al., 2016). Briefly, 8-to 10-week-old male NOD scid gamma (NSG) mice were transplanted with primary human bcCML cells via the retro-orbital sinus (2.5 million cells /mouse). Mice were subjected to ITT four weeks after engraftment.
Generation of type 1 diabetic leukemia mouse model
Type 1 diabetic mice were induced by streptozotocin treatment. Briefly, streptozotocin citrate buffer was prepared by dissolving streptozotocin in 0.1 M Na Citrate (adjusted pH to 4.5 with citrate). Streptozotocin buffer was prepared immediately before injection and was used within 30 min. Male naïve C57Bl6J mice were starved for 5 hr before administration of streptozotocin citrate buffer at the dose of 50 mg/kg/day for 5 consecutive days. Leukemic transplantation was performed to generate BN leukemic mice 14 days after streptozotocin treatment when hyperglycemia was observed. Type 1 diabetic leukemic mice were sacrificed at day 10 after leukemic transplantation.
Virus production
Virus used to infect LSK cells for generation of leukemia mouse models was produced as described previously (Neering et al., 2007). Briefly, retroviral Mouse stem cell virus (MSCV) based plasmid vectors expressing BCR/ABL-GFP, NUP98/HOXA9-YFP and MLL/AF9-GFP were transfected into the packaging cell line Platinum-E. Calcium phosphate solution containing Hepes buffered saline (HBS) and Calcium Chloride was used to transfect 30 μg of the plasmid DNA into the packaging cells. High titer virus was harvested 48 hours after transfection, filtered, flash frozen and stored in liquid nitrogen.
Mouse treatment
IGFBP1 treatment
Normal mice were treated with mouse recombinant IGFBP1 (200 μg/kg/day, i.p.) or 1% BSA for 14 days before subjected to ITT. For pre-conditioning, normal mice were treated with IGFBP1 (100 μg/kg/day, i.p.) or 1% BSA for 7 days and leukemic transplantation was performed to generate BN leukemic mice on day 8 after treatment. IGFBP1 or BSA treatment were continued until day 4 after leukemic transplantation. Mice were sacrificed at day 9 after leukemic transplantation.
Anti-IGFBP1 antibody treatment
BN mice were treated with anti-IGFBP1 antibody (200 μg/kg/day, i.p.) or IgG starting at day 2 after leukemic transplantation till day 12 after leukemic transplantation. Mice were sacrificed at day 13 after leukemic transplantation
Serotonin treatment
BN mice were treated with serotonin (20 mg/kg/day, i.p.) or saline starting at day 4 after leukemic transplantation till day 12 after leukemic transplantation. Mice were sacrificed at day 13 after leukemic transplantation.
Insulin treatment
BN mice were treated with Humulin (1 U/kg, twice a day, i.p.) or 1% BSA starting at day 4 after leukemic transplantation till day 12 after leukemic transplantation and were sacrificed at day 13 after leukemic transplantation. MLL mice were treated with Humulin (1 U/kg, twice a day, i.p.) starting at day 4 after leukemic transplantation till day 18 after leukemic transplantation and were sacrificed at day 19 after leukemic transplantation.
Antibiotics (Abx) treatment
BN mice were treated with a cocktail of Abx as described previously (Hill et al., 2010) with slight modifications. Briefly, mice were gavaged with 200μl of Abx mixture daily containing ampicillin (1 mg/ml), gentamicin (1 mg/mL), metronidazole (1 mg/mL), neomycin (1 mg/mL), vancomycin (0.5 mg/mL), and amphotericin b (0.1 mg/ml), starting at three days before leukemic transplantation until day 12 after leukemic transplantation. Mice were sacrificed at day 13 after leukemic transplantation.
Tributyrin treatment
BN mice were gavaged with tributyrin (150 μl/mouse/day) or 50% glycerol starting at day 4 after leukemic transplantation till day 12 after leukemic transplantation. Mice were sacrificed at day 13 after leukemic transplantation.
Propionate treatment
Sodium propionate (300 mM) was supplemented in drinking water starting at day 2 after leukemic transplantation (BN model). Mice were sacrificed at day 13 after leukemic transplantation.
Saxagliptin treatment
BN mice were gavaged with saxagliptin (15 mg/kg, twice per day) or saline starting at day 2 after leukemic transplantation till day 12 after leukemic transplantation. Mice were sacrificed at day 13 after leukemic transplantation.
Exenatide treatment
BN mice were treated with Exenatide (30 nmol/kg, twice per day, i.p.) starting at day 2 after leukemic transplantation till day 12 after leukemic transplantation. Mice were sacrificed at day 13 after leukemic transplantation.
Ser-Tri treatment
For disease burden examination, BN mice were treated with serotonin (20 mg/kg, i.p) and tributyrin (150 μl/mouse, oral gavaging) daily starting at day 4 after leukemic transplantation till day 12 after leukemic transplantation. Mice were sacrificed at day 13 after leukemic transplantation. For survival monitoring, recipient mice were transplanted with leukemia (BN) cells at the dose of 2000 cells/mouse. Ser-Tri treatment (serotonin at 20 mg/kg, i.p.; tributyrin at 150 μl/mouse, oral gavaging) started at day 6 after leukemic transplantation. Treatment was performed every other day.
Chemotherapy and chemotherapy combined with Ser-Tri treatment
Regimen for chemotherapy was as described previously (Ye et al., 2016). Briefly, recipient mice were transplanted with leukemia (BN) cells at the dose of 50,000 cells/mouse. At day 8 after leukemic transplantation, leukemic mice were treated with both Doxorubicin (3 mg/kg, i.p.) and Cytarabine (100 mg/kg, i.p.) for 3 days followed by a 2-day treatment of cytarabine (100 mg/kg, i.p.) alone. Ser-Tri (serotonin (20 mg/kg/day, i.p.) combined with tributyrin (150 μl/mouse, oral gavaging)) treatment was introduced at day 5 after leukemic transplantation until 10 days after chemotherapy. Ser-Tri treatment was performed every other day.
Insulin tolerance test (ITT)
Mice (BN and MLL mice) were starved for 5 hr before injection of Humulin (1.25 U/kg, i.p.). Blood glucose level was monitored using glucometer (Roche). For ITT performed on IGFBP1-treated non-leukemic mice, a different dose of Humulin was used for ITT (1 U/kg).
Glucose tolerance test (GTT)
Mice were overnight starved before injection of glucose bolus (2 g/kg, i.p.). Blood glucose level was monitored using glucometer.
Mouse gut barrier function measurement
Gut barrier function was examined by gavaged with FITC-dextran as described previously (Kelly et al., 2015). Briefly, mice were gavaged with FITC-dextran (200 μg/mouse). Blood was collected by cardiopuncture 4 hr later. Serum FITC-dextran level was determined by a fluorescent plate reader.
Glucose utilization
Glucose utilization in GAT and soleus was measured as described previously (Ferre et al., 1985). Briefly, mice were starved for 5 hr before challenged with BSA or Humulin (1.25 U/kg, i.p.) together with glucose solution (0.25 g/kg) containing 2-Deoxy [1,2-3H] glucose (5 μCi/mouse) for 30 min. GAT and soleus were harvested and weighted and immediately immersed in tubes containing 0.5 ml of 1 M NaOH. Tubes containing tissues were heated at 60 °C for 45 min until total digestion of tissues. The tissue solution was then neutralized by adding 0.5ml 1 M HCl. One sample (200 μl) of the neutralized solution was added to 1 ml of 6% HClO4 and another sample (200 μl) to 1 ml of Ba(OH)2/ZnSO4 (1:1) solution. After centrifugation, the supernatants were collected to determine the radioisotope content by a liquid scintillation counter. Relative glucose utilization was calculated by the difference between the radioactivity in the HClO4 and Ba(OH)2/ZnSO4 supernatants normalized to tissue weight.
Glucose utilization in hematopoietic cells and leukemia cells were measured similarly as in tissues. Briefly, CD45+ cells were sorted from normal mice BM. CD45+GFP+YFP+ (leukemia) cells and CD45+GFP-YFP- (non-leukemic) cells were sorted from leukemic BM. Equal number of cells were suspended in DMEM medium (without glucose) containing 0.5% FBS in 12-well plates. After 2 hr incubation, 2-Deoxy [1,2-3H] glucose (0.1 μCi/well) and 100 μM 2-Deoxy glucose were added with or without insulin (5 nM). Reaction was stopped by adding ice-cold PBS 45 min later and cells were harvested and washed twice with ice-cold PBS. Cells were digested in 1 M NaOH. Glucose utilization was determined as described above.
For measurement of in vivo glucose utilization upon Ser-Tri therapy treatment, glucose solution (0.25 g/kg) containing 2-Deoxy [1,2-3H] glucose (5 μCi/mouse) was injected (i.p.) into BN mice (day 12 after leukemic transplantation) 10 min after treatment with vehicle or Ser-Tri therapy (one-time treatment). GAT and bones were harvested 30 min after labeling. Bone marrow cells were collected and equal number (0.5 million/mouse) of leukemia cells (CD45+GFP+YFP+) were sorted. Glucose utilization in GAT and leukemia cells were determined as described above.
For measurement of in vitro glucose utilization in leukemia cells upon Ser-Tri therapy treatment, bone marrow cells were harvested from BN mice (day 12 after leukemic transplantation) 30 min after treatment with vehicle or Ser-Tri therapy. Equal number (0.5 million/sample) of leukemia cells (CD45+GFP+YFP+) were sorted and labeled with 2-Deoxy [1,2-3H] glucose as described above.
Glucose stimulated insulin secretion
Glucose stimulated insulin secretion was performed as described previously (Lee et al., 2007). Briefly, mice were starved for 5 hr before subjected to glucose bolus (3 g/kg, i.p.). Blood was collected from submandibular veins at 0 and 2 min after glucose challenge. Insulin in serum was detected by an insulin ELISA kit.
Bone micro-CT
Bone micro-CT was performed on femur and tibia bones isolated from BN leukemic mice as described previously (Frisch et al., 2012). Briefly, the right hindlimb of each mouse was fixed in 10 % formalin for 48 hr and then stored in 70% ethanol at 4 °C. The limbs were scanned on a Viva CT 40 (Scanco Medical) using a 55-kVp, 145-μA current and a 300-ms integration time. A resolution of 12.5 μm was used. A 2.0875-mm region that was 50 μm above the growth plate in the femur and 50 μm below the growth plate in the tibia was analyzed.
Flow analysis
Flow analysis for leukemia cells was performed using BD™ LSR II Flow Cytometer System. Leukemia burden was determined by the percentage of GFP+YFP+ cells (for BN model) or GFP+ cells (for MLL model) in a CD45+ population. Flow data was analyzed using flowjo software (https://www.flowjo.com/)
Genomic DNA extraction
Total genomic DNA was extracted using the QIAGEN Fecal DNA kit and FastPrep mechanical lysis (MPBio, Solon, OH). The V4 region (515f-806r; FWD: GTGCCAGCMGCCGCGGTAA; REV: GGACTACHVGGGTWTCTAAT) of the 16S rDNA gene was amplified using 5PRIME HotMaster Taq DNA polymerase (Quantabio). Primer construction and amplification followed the Earth Microbiome Project (www.earthmicrobiome.org) protocol. Amplified DNA was quantified using a PicoGreen assay (Invitrogen) and equal amounts of each DNA from each sample was pooled for sequencing. The complete pool was sequenced using a V3 2×300 kit on the Illumina MiSeq platform (San Diego, CA) in the University of Colorado Cancer Center, Genomics and Microarray Core Facility.
16S-rRNA-sequencing processing
Raw sequences were demultiplexed and assigned to samples using QIIME 1.9 (Caporaso et al., 2010). The resulting libraries were denoised and grouped by sequence variants using dada2 1.2.2 (Callahan et al., 2016). Operational taxonomic units (OTUs) were picked from the sequence variants using SortMeRNA (Kopylova et al., 2012) and referenced against the GreenGenes 99% OTU database (May 2013). Samples produced between 30193 and 38410 sequences, therefore downstream analyses were rarefied to 30193 sequences to include all samples. Taxonomic assignments were made with the RDP Classifier (Wang et al., 2007) trained on the GreenGenes database. Principle Coordinate Analysis (PCoA) on weighted UniFrac values (Lozupone et al., 2007) was conducted using QIIME 1.9.
Microbiota transfer
Mice were pretreated with an antibiotics (Abx) cocktail for 7 days. Fecal materials collected from normal and BN mice were gavaged to Abx-pretreated mice for 3 consecutive days (once/day). Mice were housed for two weeks for stabilizing and then leukemic transplantation was performed to generate BN model. For insulin tolerance tests performed in mice transferred with fecal materials, recipients were housed for 5 weeks after transferring.
GI transition time measurement
Measurement of GI transition time was performed as described previously (Yano et al., 2015). Briefly, Mice were orally gavaged with 200 μl sterile solution of 6% carmine red and 0.5% methylcellulose in water and placed in a new cage with no bedding. Starting at 220 min after gavage, mice were monitored every 5 min for production of a red fecal pellet. GI transit time was recorded as the total number of minutes elapsed (rounded to the nearest 5 min) before production of a red fecal pellet.
PET-CT scanning
Animals received a single dose of 18F-FDG (max. 0.3 mCi) via tail vein injection. 18F-FDG was purchased through PetNet (Denver, CO) and the animals were fasted for 2 hr prior to 18F-FDG injection. Following 45 minutes of a conscious tracer up-take (in a temperature controlled cage), the mouse was anesthetized using 2.5% isoflurane and sequential PET-CT scans were acquired using a Siemens Inveon microPET/CT scanner and Siemens Inveon Acquisition Workstation software (IAW) (Schlaepfer et al., 2015; Shukla et al., 2017). The CT scans were used for attenuation correction and anatomical localizations of PET signal. The normalized uptake values (NOV, accounting for the injected dose and 18F-radioisotope decay) were calculated for the spleen, bone marrow and bilateral femoral muscles using Siemens Research Workstation (IRW) software.
Quantitative polymerase chain reaction (qPCR)
mRNA from tissues were extracted using TRIzol™ reagent per manufacturer’s instructions. cDNA was synthesized using iScript cDNA synthesis kit per manufacturer’s instructions. cDNA was mixed with primers (see Table S2) and PerfeCTa® SYBR® Green FastMix® Reaction Mixes per manufacturer’s instructions. qPCR was performed using LightCycler® 96 System (Roche). Results were analyzed by LightCycler® 96 SW 1.1 software. GAPDH and ACTB were used as reference genes.
ELISA
All ELSIA experiments were performed per manufacturers’ instructions.
Serum free fatty acid (FFA) measurement
Serum FFA was determined using the Free Fatty Acids, Half Micro Test kit (Sigma) per manufacturer’s instructions.
Survival curve generated from TCGA dataset
Survival data generated from the TCGA dataset was achieved by using the algorithm on http://www.oncolnc.org/. The cutoff for low and high expression for both PF4 and TNFSF13B was 25%.
QUANTIFICATION AND STATISTICAL ANALYSIS
Error bars in all the data represent a standard deviation (SD). Number of replicates (n number) is reported in the Figure legends. Biological factors were investigated for their relevance by twotailed Student’s t test with unpaired analysis. For paired BM aspirates comparison (Figure 8), two-tailed Student’s t test with paired analysis was performed. P value less than 0.05 was considered significant. Data with statistical significance (*p < 0.05, **p < 0.05, ***p< 0.05) are shown in Figures.
KEY RESOURCES TABLE
| REAGENT or RESOURCE | SOURCE | IDENTIFIER |
|---|---|---|
| Antibodies | ||
| Mouse IGFBP1 antibody | R & D systems | AF1240 |
| Alexa Flour 700 Rat Anti-Mouse CD45 | BD Biosciences | Cat# 560510 |
| Phospho-Akt (Ser473) Rabbit mAb | Cell Signaling Technology |
Cat# 4060 |
| Akt (pan) Rabbit mAb | Cell Signaling Technology |
Cat# 4685 |
| Insulin Rabbit mAb | Cell Signaling Technology |
Cat# 3014 |
| GAPDH Antibody | Santa Cruz Biotechnology |
Cat# sc-47724 |
| p44/42 MAPK (Erk1/2) Antibody | Cell Signaling Technology |
Cat# 9102 |
| phospho-p44/42 MAPK (Erk1/2) (Thr202/Tyr204) Rabbit mAb | Cell Signaling Technology |
Cat# 9102 |
| Insulin receptor β Rabbit mAb | Cell Signaling Technology | Cat# 3025 |
| Phospho-Insulin receptor β (Tyr1150/1151) Rabbit mAb | Cell Signaling Technology |
Cat# 3024 |
| Phospho-Insulin receptor β (Tyr1146) Rabbit mAb | Cell Signaling Technology | Cat# 3021 |
| Anti-IGF1 antibody | Abcam | Cat# Ab9572 |
| Biological Samples | ||
| Human primary bcCML sample | This lab | N/A |
| Human serum samples | Dr. Daniel Pollyea | N/A |
| Human BM aspirates | This lab | N/A |
| Chemicals, Peptides, and Recombinant Proteins | ||
| Recombinant Mouse IGFBP-1 Protein, CF | R & D systems | Cat# 1588-B1–025 |
| Recombinant mouse IGF-1 protein | R & D systems | Cat# 791 |
| RGDS peptide | Tocris | Cat# 3498 |
| Insulin, human recombinant, zinc solution | ThermoFisher Scientific |
Cat#12585014 |
| Normal Goat IgG control | R & D systems | Cat# AB-108-C |
| Fluorescein isothiocyanate-Dextran | Sigma-Aldrich | Cat# 46944 |
| 2-Deoxy [1,2-3H] glucose | Perkin-Elmer | Cat# NET328A001MC |
| D-(+)-Glucose | Sigma-Aldrich | Cat# G7528 |
| Bovine serum albumin | Sigma-Aldrich | Cat# A7030 |
| HClO4 | Sigma-Aldrich | Cat# 244252 |
| ZnSO4 | Sigma-Aldrich | Cat# Z2876 |
| Ba(OH)2 | Sigma-Aldrich | Cat# B4059 |
| HCl | Sigma-Aldrich | Cat# H1758 |
| NaOH | Sigma-Aldrich | Cat# 72068 |
| Methyl cellulose | Sigma-Aldrich | Cat# M0512 |
| Carmine | Sigma-Aldrich | Cat# C1022 |
| Glycerol | Sigma-Aldrich | Cat# G6279 |
| Saxagliptin | Selleckchem | Cat# 1540 |
| Exenatide | Selleckchem | Cat# P1046 |
| Tributyrin | Sigma-Aldrich | Cat# W222305 |
| Sodium propionate | Sigma-Aldrich | Cat# P5436 |
| Humulin R | Lilly | NDC 0002–8215- 17 |
| Serotonin hydrochloride | Tocris | Cat# 3547 |
| Ampicillin | Sigma-Aldrich | Cat# A0166 |
| Amphotericin B | Sigma-Aldrich | Cat# A9528 |
| Vancomycin HCl | Tocris | Cat# 5506 |
| Neomycin trisulfate salt hydrate | Sigma-Aldrich | Cat# N1876 |
| Metronidazole | Sigma-Aldrich | Cat# M3761 |
| PerfeCTa® SYBR® Green FastMix® Reaction Mixes |
QuantaBio | Cat# 95072–05K |
| TRIzol™ Reagent | Thermo Fisher Scientific |
Cat# 15596026 |
| Gentamicin | Thermo Fisher Scientific |
Cat# 15710064 |
| Critical Commercial Assays | ||
| Free Fatty Acids, Half Micro Test kit | Sigma-Aldrich | Cat# 11383175001 |
| Mouse IGFBP1 DuoSet ELISA | R & D systems | Cat# DY1588–05 |
| Human IGFBP1 DuoSet ELISA | R & D systems | Cat# DY871 |
| Mouse DPP4 DuoSet ELISA | R & D systems | Cat# DY954 |
| Mouse/Rat GLP-1 active (7–36) ELISA kit | Eagle Biosciences | Cat# GP121-K01 |
| Human glycated serum protein kit | Crystal Chem | Cat# 80109 |
| Human insulin ELISA kit | Crystal Chem | Cat# 90095 |
| Proteome Profiler Mouse Adipokine Array Kit | R & D systems | Cat# ARY013 |
| Proteome Profiler Human XL Cytokine Array Kit | R & D systems | Cat# ARY022B |
| iScript cDNA synthesis kit | BIO-RAD | Cat# 1708891 |
| Serotonin ultrasensitive Elisa Assay kit | Eagle Biosciences | SKU: SEU39-K01 |
| Mouse/Rat IGF-1 Quantikine Elisa kit | R & D systems | Cat# MG100 |
| Ultra-sensitive mouse insulin ELISA kit | Crystal Chem | Cat# 90080 |
| Experimental Models: Cell Lines | ||
| Platinum-E retroviral packaging cell line | Cell Biolabs | Cat# RV-101 |
| 3T3-L1 cell line | ATCC | Cat# CL-173™ |
| Experimental Models: Organisms/Strains | ||
| C57BL/6J | The Jackson Laboratory |
Stock No.000664 |
| NOD.Cg-Prkdcscid Il2rgtm1Wjl/SzJ | Breeders from The Jackson Laboratory |
Stock No. 005557 |
| B6.SJL-Ptprca Pepcb/BoyJ | Breeders from The Jackson Laboratory |
Stock No. 002014 |
| Oligonucleotides | ||
| Refer to Table S2 for primers used in this paper | ||
| Recombinant DNA | ||
| MSCV-p210BCR-ABL-IRES-GFP | This lab | N/A |
| MSCV-NUP98-HOXA9-IRES-YFP | This lab | N/A |
| MSCV-MLL-IRES-GFP | This lab | N/A |
| psPAX2 | Addgene | Plasmid#12260 |
| pMD2.G | Addgene | Plasmid#12259 |
| Software and Algorithms | ||
| Flowjo | Flowjo | N/A |
| TCGA survival data |
http://www.oncolnc. org/ |
N/A |
| QIIME 1.9 | http://qiime.org/ | N/A |
| SortMeRNA |
http://bioinfo.lifl.fr/ RNA/sortmerna/ |
N/A |
Supplementary Material
Leukemia subverts systemic glucose metabolism by induction of insulin resistance (IR)
Aberrancies in adipose tissue, pancreas, gut, and microbiota contribute to IR
Leukemic progression is attenuated by modulations of systemic glucose metabolism
Leukemia patients display characteristics of insulin resistance
Significance.
Previous studies have shown that cell intrinsic mechanisms for glucose uptake/utilization are critical for growth of many cancer cell types. However, these studies do not consider cancer from an organismal perspective, where tumor cells comprise a relatively small proportion of host mass, and competition with normal tissues for finite amounts of systemic glucose may be a critical component of tumor growth. Our findings indicate that leukemic tumors gain a competitive advantage by co-opting multiple mechanisms to induce a diabetes-like physiological condition in the host, and thereby subvert systemic glucose metabolism to facilitate disease progression. Further, our studies demonstrate that restoration of normal glucose regulation may be a feasible strategy to suppress systemic growth of malignant cell types.
Acknowledgements:
PET-CT studies were performed at the Animal Imaging Shared Resources (AISR) at the University of Colorado Anschutz Medical Campus, which is supported by NCI and the University of Colorado Cancer Center (P30CA046934). The authors thank Jenna Steiner and Kendra Huber for their help with all image acquisition. The authors thank Drs. Sally P. Stabler and Whitney Phinney for assistance with SCFAs measurement. The authors also thank Drs. Clayton Smith and Eric Pietras for critical review and comments. This work is supported by grants from the NIH (RO1CA166265 and RO1CA220986 to C.T.J.).
Footnotes
Declaration of Interests: The authors declare no competing interests.
Publisher's Disclaimer: This is a PDF file of an unedited manuscript that has been accepted for publication. As a service to our customers we are providing this early version of the manuscript. The manuscript will undergo copyediting, typesetting, and review of the resulting proof before it is published in its final citable form. Please note that during the production process errors may be discovered which could affect the content, and all legal disclaimers that apply to the journal pertain.
References
- Arcidiacono B, Iiritano S, Nocera A, Possidente K, Nevolo MT, Ventura V, Foti D, Chiefari E, and Brunetti A (2012). Insulin resistance and cancer risk: an overview of the pathogenetic mechanisms. Exp Diabetes Res 2012, 789174. [DOI] [PMC free article] [PubMed] [Google Scholar]
- Baothman OA, Zamzami MA, Taher I, Abubaker J, and Abu-Farha M (2016). The role of Gut Microbiota in the development of obesity and Diabetes. Lipids Health Dis 15, 108. [DOI] [PMC free article] [PubMed] [Google Scholar]
- Barnes KM, and Miner JL (2009). Role of resistin in insulin sensitivity in rodents and humans. Curr Protein Pept Sci 10, 96–107. [DOI] [PubMed] [Google Scholar]
- Basen-Engquist K, and Chang M (2011). Obesity and cancer risk: recent review and evidence. Curr Oncol Rep 13, 71–76. [DOI] [PMC free article] [PubMed] [Google Scholar]
- Benito J, Shi Y, Szymanska B, Carol H, Boehm I, Lu H, Konoplev S, Fang W, Zweidler-McKay PA, Campana D, et al. (2011). Pronounced hypoxia in models of murine and human leukemia: high efficacy of hypoxia-activated prodrug PR-104. PLoS One 6, e23108. [DOI] [PMC free article] [PubMed] [Google Scholar]
- Bjorndal B, Burri L, Staalesen V, Skorve J, and Berge RK (2011). Different adipose depots: their role in the development of metabolic syndrome and mitochondrial response to hypolipidemic agents. J Obes 2011, 490650. [DOI] [PMC free article] [PubMed] [Google Scholar]
- Boulange CL, Neves AL, Chilloux J, Nicholson JK, and Dumas ME (2016). Impact of the gut microbiota on inflammation, obesity, and metabolic disease. Genome Med 8, 42. [DOI] [PMC free article] [PubMed] [Google Scholar]
- Callahan BJ, McMurdie PJ, Rosen MJ, Han AW, Johnson AJ, and Holmes SP (2016). DADA2: High-resolution sample inference from Illumina amplicon data. Nat Methods 13, 581–583. [DOI] [PMC free article] [PubMed] [Google Scholar]
- Caporaso JG, Kuczynski J, Stombaugh J, Bittinger K, Bushman FD, Costello EK, Fierer N, Pena AG, Goodrich JK, Gordon JI, et al. (2010). QIIME allows analysis of high-throughput community sequencing data. Nat Methods 7, 335–336. [DOI] [PMC free article] [PubMed] [Google Scholar]
- Davies KJ (2016). Adaptive homeostasis. Mol Aspects Med 49, 1–7. [DOI] [PMC free article] [PubMed] [Google Scholar]
- Deng T, Lyon CJ, Bergin S, Caligiuri MA, and Hsueh WA (2016). Obesity, Inflammation, and Cancer. Annu Rev Pathol 11, 421–449. [DOI] [PubMed] [Google Scholar]
- Dowling RJ, Niraula S, Stambolic V, and Goodwin PJ (2012). Metformin in cancer: translational challenges. J Mol Endocrinol 48, R31–43. [DOI] [PubMed] [Google Scholar]
- Evans CC, LePard KJ, Kwak JW, Stancukas MC, Laskowski S, Dougherty J, Moulton L, Glawe A, Wang Y, Leone V, et al. (2014). Exercise prevents weight gain and alters the gut microbiota in a mouse model of high fat diet-induced obesity. PLoS One 9, e92193. [DOI] [PMC free article] [PubMed] [Google Scholar]
- Ferre P, Leturque A, Burnol AF, Penicaud L, and Girard J (1985). A method to quantify glucose utilization in vivo in skeletal muscle and white adipose tissue of the anaesthetized rat. Biochem J 228, 103–110. [DOI] [PMC free article] [PubMed] [Google Scholar]
- Firth SM, and Baxter RC (2002). Cellular actions of the insulin-like growth factor binding proteins. Endocr Rev 23, 824–854. [DOI] [PubMed] [Google Scholar]
- Frisch BJ, Ashton JM, Xing L, Becker MW, Jordan CT, and Calvi LM (2012). Functional inhibition of osteoblastic cells in an in vivo mouse model of myeloid leukemia. Blood 119, 540–550. [DOI] [PMC free article] [PubMed] [Google Scholar]
- Gallagher EJ, and LeRoith D (2010). The proliferating role of insulin and insulin-like growth factors in cancer. Trends Endocrinol Metab 21, 610–618. [DOI] [PMC free article] [PubMed] [Google Scholar]
- Hay N (2016). Reprogramming glucose metabolism in cancer: can it be exploited for cancer therapy? Nat Rev Cancer 16, 635–649. [DOI] [PMC free article] [PubMed] [Google Scholar]
- Hill DA, Hoffmann C, Abt MC, Du Y, Kobuley D, Kirn TJ, Bushman FD, and Artis D (2010). Metagenomic analyses reveal antibiotic-induced temporal and spatial changes in intestinal microbiota with associated alterations in immune cell homeostasis. Mucosal Immunol 3, 148–158. [DOI] [PMC free article] [PubMed] [Google Scholar]
- Kang L, Mokshagundam S, Reuter B, Lark DS, Sneddon CC, Hennayake C, Williams AS, Bracy DP, James FD, Pozzi A, et al. (2016). Integrin-Linked Kinase in Muscle Is Necessary for the Development of Insulin Resistance in Diet-Induced Obese Mice. Diabetes 65, 1590–1600. [DOI] [PMC free article] [PubMed] [Google Scholar]
- Kelly CJ, Zheng L, Campbell EL, Saeedi B, Scholz CC, Bayless AJ, Wilson KE, Glover LE, Kominsky DJ, Magnuson A, et al. (2015). Crosstalk between Microbiota-Derived Short-Chain Fatty Acids and Intestinal Epithelial HIF Augments Tissue Barrier Function. Cell Host Microbe 17, 662–671. [DOI] [PMC free article] [PubMed] [Google Scholar]
- Kim W, and Egan JM (2008). The role of incretins in glucose homeostasis and diabetes treatment. Pharmacol Rev 60, 470–512. [DOI] [PMC free article] [PubMed] [Google Scholar]
- Kopylova E, Noe L, and Touzet H (2012). SortMeRNA: fast and accurate filtering of ribosomal RNAs in metatranscriptomic data. Bioinformatics 28, 3211–3217. [DOI] [PubMed] [Google Scholar]
- Lee NK, Sowa H, Hinoi E, Ferron M, Ahn JD, Confavreux C, Dacquin R, Mee PJ, McKee MD, Jung DY, et al. (2007). Endocrine regulation of energy metabolism by the skeleton. Cell 130, 456–469. [DOI] [PMC free article] [PubMed] [Google Scholar]
- Lewitt MS, Dent MS, and Hall K (2014). The Insulin-Like Growth Factor System in Obesity, Insulin Resistance and Type 2 Diabetes Mellitus. J Clin Med 3, 1561–1574. [DOI] [PMC free article] [PubMed] [Google Scholar]
- Lichtman MA (2010). Obesity and the risk for a hematological malignancy: leukemia, lymphoma, or myeloma. Oncologist 15, 1083–1101. [DOI] [PMC free article] [PubMed] [Google Scholar]
- Lozupone CA, Hamady M, Kelley ST, and Knight R (2007). Quantitative and qualitative beta diversity measures lead to different insights into factors that structure microbial communities. Appl Environ Microbiol 73, 1576–1585. [DOI] [PMC free article] [PubMed] [Google Scholar]
- Madjlessi SHM, Farmer RG, and Weick JK (1986). Inflammatory Bowel-Disease and Leukemia - a Report of 7 Cases of Leukemia in Ulcerative-Colitis and Crohns-Disease and Review of the Literature. Digest Dis Sci 31, 1025–1031. [DOI] [PubMed] [Google Scholar]
- Motyl K, and McCabe LR (2009). Streptozotocin, type I diabetes severity and bone. Biol Proced Online 11, 296–315. [DOI] [PMC free article] [PubMed] [Google Scholar]
- Neering SJ, Bushnell T, Sozer S, Ashton J, Rossi RM, Wang PY, Bell DR, Heinrich D, Bottaro A, and Jordan CT (2007). Leukemia stem cells in a genetically defined murine model of blast-crisis CML. Blood 110, 2578–2585. [DOI] [PMC free article] [PubMed] [Google Scholar]
- Nicholson JK, Holmes E, Kinross J, Burcelin R, Gibson G, Jia W, and Pettersson S (2012). Hostgut microbiota metabolic interactions. Science 336, 1262–1267. [DOI] [PubMed] [Google Scholar]
- Ormerod KL, Wood DL, Lachner N, Gellatly SL, Daly JN, Parsons JD, Dal’Molin CG, Palfreyman RW, Nielsen LK, Cooper MA, et al. (2016). Genomic characterization of the uncultured Bacteroidales family S24–7 inhabiting the guts of homeothermic animals. Microbiome 4, 36. [DOI] [PMC free article] [PubMed] [Google Scholar]
- Rasouli N (2016). Adipose tissue hypoxia and insulin resistance. J Investig Med 64, 830–832. [DOI] [PubMed] [Google Scholar]
- Samuel VT, and Shulman GI (2012). Mechanisms for insulin resistance: common threads and missing links. Cell 148, 852–871. [DOI] [PMC free article] [PubMed] [Google Scholar]
- Schiaffino S, and Mammucari C (2011). Regulation of skeletal muscle growth by the IGF1-Akt/PKB pathway: insights from genetic models. Skelet Muscle 1, 4. [DOI] [PMC free article] [PubMed] [Google Scholar]
- Schlaepfer IR, Glode LM, Hitz CA, Pac CT, Boyle KE, Maroni P, Deep G, Agarwal R, Lucia SM, Cramer SD, et al. (2015). Inhibition of Lipid Oxidation Increases Glucose Metabolism and Enhances 2-Deoxy-2-[(18)F]Fluoro-D-Glucose Uptake in Prostate Cancer Mouse Xenografts. Mol Imaging Biol 17, 529–538. [DOI] [PMC free article] [PubMed] [Google Scholar]
- Seguin F, Carvalho MA, Bastos DC, Agostini M, Zecchin KG, Alvarez-Flores MP, Chudzinski-Tavassi AM, Coletta RD, and Graner E (2012). The fatty acid synthase inhibitor orlistat reduces experimental metastases and angiogenesis in B16-F10 melanomas. Br J Cancer 107, 977–987. [DOI] [PMC free article] [PubMed] [Google Scholar]
- Shanik MH, Xu Y, Skrha J, Dankner R, Zick Y, and Roth J (2008). Insulin resistance and hyperinsulinemia: is hyperinsulinemia the cart or the horse? Diabetes Care 31 Suppl 2, S262–268. [DOI] [PubMed] [Google Scholar]
- Shukla SK, Purohit V, Mehla K, Gunda V, Chaika NV, Vernucci E, King RJ, Abrego J, Goode GD, Dasgupta A, et al. (2017). MUC1 and HIF-1alpha Signaling Crosstalk Induces Anabolic Glucose Metabolism to Impart Gemcitabine Resistance to Pancreatic Cancer. Cancer Cell 32, 71–87 e77. [DOI] [PMC free article] [PubMed] [Google Scholar]
- Sugimoto Y, Kimura I, Yamada J, Watanabe Y, Takeuchi N, and Horisaka K (1990). Effects of serotonin on blood glucose and insulin levels of glucose- and streptozotocin-treated mice. Jpn J Pharmacol 54, 93–96. [DOI] [PubMed] [Google Scholar]
- Wang Q, Garrity GM, Tiedje JM, and Cole JR (2007). Naive Bayesian classifier for rapid assignment of rRNA sequences into the new bacterial taxonomy. Appl Environ Microbiol 73, 5261–5267. [DOI] [PMC free article] [PubMed] [Google Scholar]
- Wang X, Wei W, Krzeszinski JY, Wang Y, and Wan Y (2015). A Liver-Bone Endocrine Relay by IGFBP1 Promotes Osteoclastogenesis and Mediates FGF21-Induced Bone Resorption. Cell Metab 22, 811–824. [DOI] [PMC free article] [PubMed] [Google Scholar]
- Yadav A, Kataria MA, Saini V, and Yadav A (2013). Role of leptin and adiponectin in insulin resistance. Clin Chim Acta 417, 80–84. [DOI] [PubMed] [Google Scholar]
- Yano JM, Yu K, Donaldson GP, Shastri GG, Ann P, Ma L, Nagler CR, Ismagilov RF, Mazmanian SK, and Hsiao EY (2015). Indigenous bacteria from the gut microbiota regulate host serotonin biosynthesis. Cell 161, 264–276. [DOI] [PMC free article] [PubMed] [Google Scholar]
- Ye H, Adane B, Khan N, Sullivan T, Minhajuddin M, Gasparetto M, Stevens B, Pei S, Balys M, Ashton JM, et al. (2016). Leukemic Stem Cells Evade Chemotherapy by Metabolic Adaptation to an Adipose Tissue Niche. Cell Stem Cell 19, 23–37. [DOI] [PMC free article] [PubMed] [Google Scholar]
Associated Data
This section collects any data citations, data availability statements, or supplementary materials included in this article.