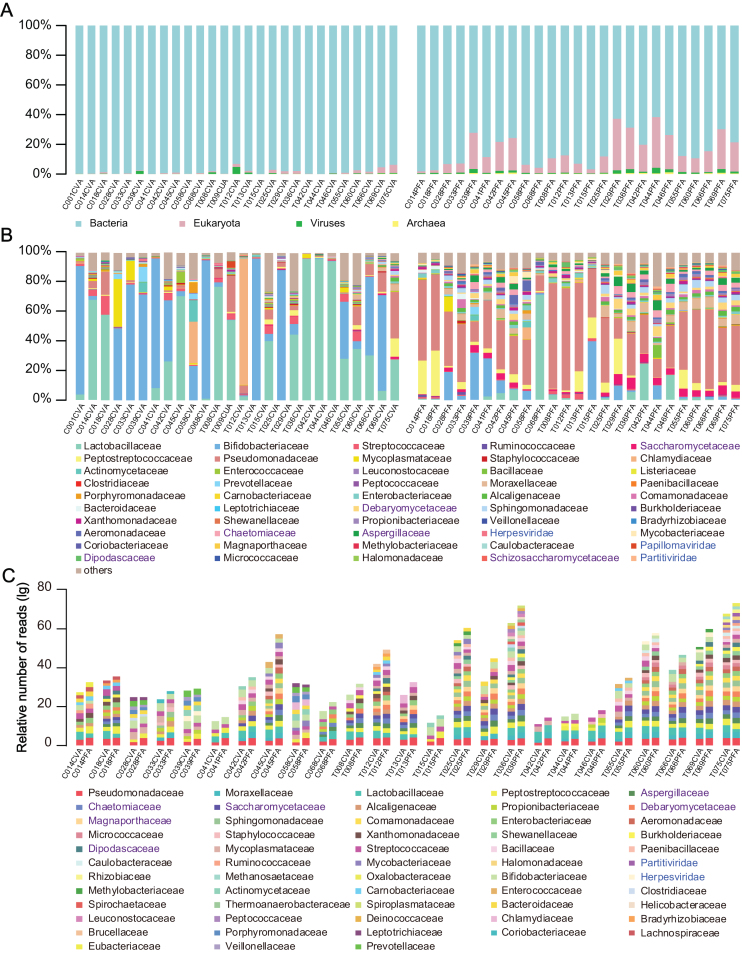
Figure 1:
The overall microbiome composition of the cervical canal and the peritoneal fluid of reproductive-age women. Cumulative bar charts of the main taxa at domain (A) and family (B) levels in CV and PF samples. (C) Compositional overlap at the family level of CV and PF samples from the same individuals. Relative number of reads was calculated as  , where
  is the number of reads within
  taxa in
  sample,
  is the total number of reads within
  sample, and m is the median number of reads within all 50 samples. When
  taxa is shared by CV and PF samples from the same individuals and at the same time, both
  values are higher than 0.1%
 , the
, the  taxa is included in the cumulative bar charts. Taxa names (B, C ) in black, purple, and blue denote bacteria, eukaryotes, and viruses, respectively.

