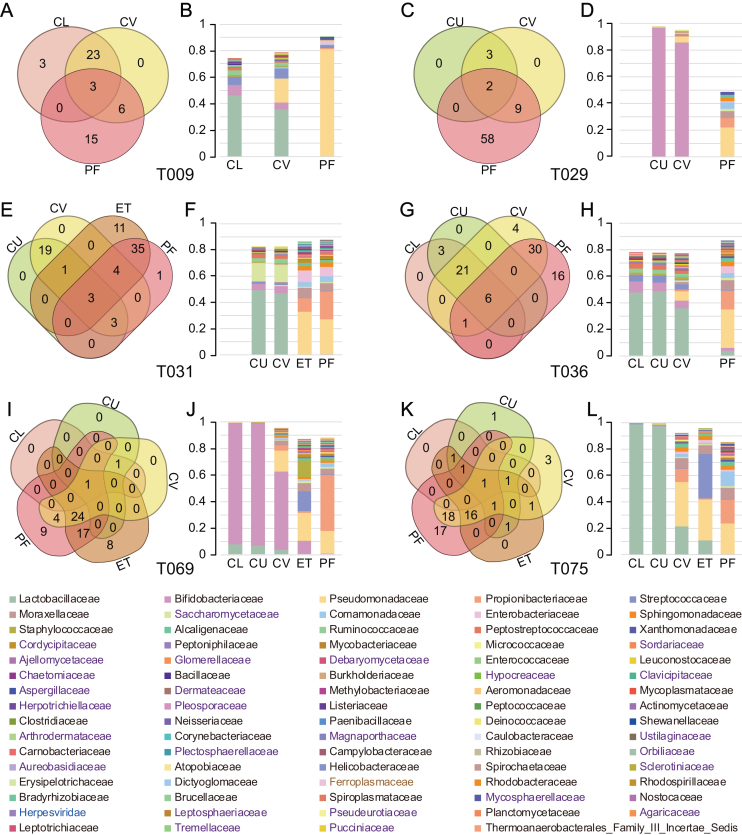
Figure 2:
Composition of the vagino-uterine microbiota. (A, C, E, G, I, K) Venn diagrams depicting shared taxa at the family level in samples collected at different sites in the same individual. (B, D, F, H, K, L) Cumulative bar charts of the taxa with relative abundance higher than 0.1% and present in at least two sites of the same individual. Taxa names (B, C) in black, purple, blue, and gray denote bacteria, eukaryotes, viruses, and archaea, respectively.

