Abstract
We characterize the agreement and disagreement of four publically available burned products (Fire CCI, Copernicus Burnt Area, MODIS MCD45A1, and MODIS MCD64A1) at a finer spatial and temporal scale than previous assessments using a grid of three-dimensional cells defined both in space and in time. Our analysis, conducted using seven years of data (2005–2011), shows that estimates of burned area vary greatly between products in terms of total area burned, the location of burning, and the timing of the burning. We use regional and monthly units for analysis to provide insight into the variation between products that can be lost when considering products yearly and/or globally. Comparison with independent, contemporaneous MODIS active fire observations provides one indication of which products most reasonably capture the burning regime. Our results have implications for the use of global burned area products in fire ecology, management and emissions applications.
Keywords: Global burned area, product intercomparison, burning patterns, voxel
1. Introduction
The availability of well-calibrated, global remote sensing data since the late 1990s has enabled the production of a variety of global, multiannual burned area products that are now freely available. These products, which are generally derived from sensors offering what is, by current standards, coarse spatial resolution (250 m–1 km), daily or near-daily temporal resolution, include the SPOT-Vegetation and PROBA-V Copernicus Burnt Area products (Tansey et al. 2008), the MODIS burned area products MCD45A1 (Roy et al. 2005b) and MCD64A1 (Giglio et al. 2009), the MERIS Fire CCI products (Alonso-Canas and Chuvieco 2015), the L3JRC (Tansey et al. 2008), GLOBCARBON (Plummer et al. 2006) product, and others (e.g. Mouillot et al. 2014).
Since the release of the first global burned area data sets, significant discrepancies in areal estimates and spatial patterns have been observed (Boschetti et al. 2004). Despite the continued development and recent proliferation of such products, significant differences persist between them. While the global burned area totals for each product show comparatively good agreement, significant discrepancies with respect to the location and timing of fire activity are apparent at smaller spatial and/or temporal scales. For example, Alonso-Canas and Chuvieco (2015) found that the GFED4, MCD45A1, and Fire CCI products identified total global burned area within 10% of one another for the years 2006 through 2008, though the analysis did not take finer spatial or temporal scales into consideration. Giglio et al. (2010) showed that although five contemporaneous burned area data sets (GFED2, GFED3, MCD45A1, L3JRC, and GLOBCARBON) reported similar global annual burned area totals, the monthly area burned within 14 sub-continental regions exhibited substantial differences in magnitude and temporal patterns (Giglio et al. 2010). These findings suggest that burned area products still have significantly different performance in space and time, and support the case for a systematic investigation of such differences.
The standard procedure for the validation of burned area products consists of the comparison with independent, co-located reference data generated from two or more consecutive Landsat class (10–30 m spatial resolution) images. The independent reference data should have minimal error, and should be generated either by visual interpretation (Roy et al. 2005a; Giglio et al. 2009; Roy and Boschetti 2009) or by application of a semiautomatic algorithm followed by visual checking and manual refinement (Boschetti et al. 2006; Padilla, Stehman, and Chuvieco 2014; Padilla et al. 2015). Such efforts are expensive, time consuming, and constrained by the availability of cloud-free images; for this reason, validation studies have relied on a very limited quantity of reference data, typically up to 100 Landsat image pairs for the global validation of a yearly product. A study of 6 burned area products for the year 2008, using 30-m reference data generated from 102 Landsat image pairs, found that commission errors of all products were greater than or equal to 42% and omission errors were greater than or equal to 68% (Padilla, Stehman, and Chuvieco 2014). Similar results were found for the MCD45A1, L3JRC, and GLOBCARBON products in southern Africa using 11 Landsat image pairs (Roy and Boschetti 2009).
Such validation exercises can provide insight on the performance of burned area mapping algorithms over a range of different conditions, but these exercises rely on probability sampling methods to select a spatially and temporally random set of images in order to preserve the statistical validity of the accuracy estimators (Stehman and Czaplewski 1998; Boschetti, Stehman, and Roy 2016). The limited set of reference data, which is typically very small relative to the population being estimated, is unlikely to capture all differences between products. In the absence of an extensive global, multitemporal validation data set involving a much larger number of reference data scenes, intercomparison of products is a necessary step in order to characterize the relative performance of each product. Satellite product intercomparison is less costly than validation in terms of time and resources (Garrigues et al. 2008; D’Odorico et al. 2014) and provides systematic information about spatial and temporal patterns of agreement and disagreement. Such information can also provide insights as to the reasons for the differences between products (Boschetti et al. 2004; Chang and Song 2009) and has been applied to burned area product intercomparisons in the past, e.g. Sánchez, Heil, and Chuvieco (2014). As with map validation exercises, product intercomparison should be repeated as new sensors and algorithms become available in order to provide an up-to-date record of relative performance of the data sets to end users.
In this work, we propose a rigorous framework for the spatial and temporal comparison of global fire products, and we apply this framework to four available operational products: Copernicus Burnt Area, Fire CCI, MODIS MCD45A1, and MODIS MCD64A1. The intercomparison explicitly considers both the temporal and the spatial dimension of the products, by using a spatial and temporal analysis grid. The non-overlapping grid of Thiessen Scene Areas (TSAs) (Gallego 2005; Kennedy, Yang, and Cohen 2010), generated from the Landsat World Reference System (WRS-2) scene centroids, is partitioned into monthly time intervals, to provide tri-dimensional analysis elements called voxels (a portmanteau word of ‘volume’ and ‘pixels’). The amount of burning within each voxel provides an indicator of the total area burned while comparison with MODIS active fire observations provides an independent indicator of the correctness of the timing of burned patches. The entire 2005–2011 time period during which all the products are available is considered.
Through this analysis, we aim to provide users of global burned area data useful information about the relative performance of the available products by identifying regions where the timing and magnitude of burning detected by the products vary. Additionally, the results of this intercomparison may be useful to algorithm developers for refining and improving the existing products by examining areas where a given product indicates different burning patterns. Finally, the types of discrepancies highlighted by this research can inform stratification strategies used in future validation efforts to ensure that the appropriate surface phenomena are captured by the reference data sets.
2. Data
The majority of satellite-derived global fire data sets fall into two broad categories: burned area products and active fire products (Justice et al. 2002a). Among other applications, these products are used for fire management activities (e.g. Eidenshink et al. 2007; Davies et al. 2009), national monitoring systems (e.g. Boschetti et al. 2008; Leblon, Bourgeau-Chavez, and San-Miguel-Ayanz 2012), calculating fire emissions inventories (e.g. Barbosa et al. 1999; Zhang et al. 2003; van der Werf et al. 2010; Giglio, Randerson, and van der Werf 2013; Rossi et al. 2016), fire ecology and fire regime assessment (e.g. Archibald et al. 2010, 2013) and ecosystem modeling exercises (e.g. Yue et al. 2014, 2015). Further discussion of the applications of burned area products can be found in Mouillot et al. (2014).
Burned area products identify areas that have been affected by fire, detecting the change from a vegetated surface to a surface of char, ash, and bare soil (Roy et al. 1999). Burned area mapping is essentially a non-permanent land cover change detection problem, and a variety of algorithms have been applied, leading to different results spatially and temporally. Burned area detection changes dramatically with scale due to the presence of mixed pixels (Boschetti, Flasse, and Brivio 2004). As a result, methods applied at coarse spatial resolution will not necessarily perform effectively at finer spatial resolutions (Hall et al. 2016). Due to the variety of approaches implemented in burned area algorithms, there is a large amount of spatial variability amongst burned area products (Figures 1 and 2; Table 1).
Figure 1.
GFED fire regions with TSA polygons superimposed.
Figure 2.
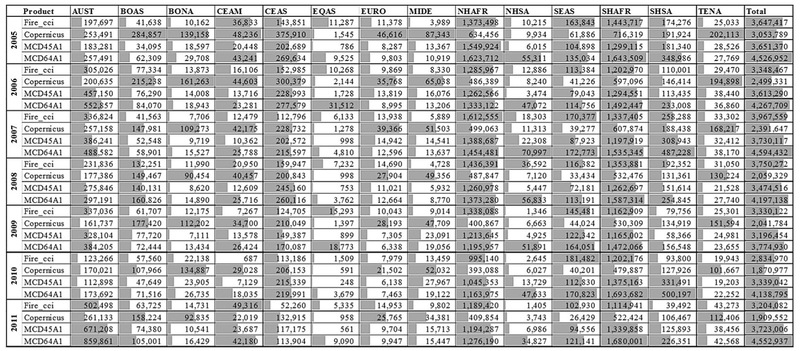
Yearly burned area totals (km2) per fire region and globally. Bar plot size is normalized to the maximum of the fire region across all products and all years.
Table 1.
Overview of burned area products selected for intercomparison.
| Producer | Product | Sensor | Grid size | Projection | Layer |
|---|---|---|---|---|---|
| European Commission | Copernicus Burnt Area | SPOT-VGT | 1000 ma | Geographic | ‘FDOB_DEKAD’ |
| European Space Agency | Fire CCI | MERIS | 300 ma | Geographic | 1 (‘Date of first Detection’) |
| NASA MODIS Land Science Team | MCD45A1 | MODIS | 463.3 m | Sinusoidal | ‘Burndate’ |
| NASA MODIS Land Science Team | MCD64A1 | MODIS | 463.3 m | Sinusoidal | ‘Burn Date’ |
Grid size at Equator.
Active fire products provide the location of all fires actively burning at the satellite overpass time. The short persistence of the signal of active fires means that active fire products are very sensitive to the daily dynamics of biomass burning, and that in situations where the fire front moves quickly, there will be an under-sampling of fire dynamics. Based on the physical characteristics of the sensor, the characteristics of the fire and the algorithm used for the detection, active fires orders of magnitude smaller than the pixel size can be detected: as an example, for the MODIS active fire product, fires in temperate deciduous forest covering around 100 m2 within the 1 km2 pixel have a 90% probability of detection (Giglio et al. 2003). Active fire data sets offer a direct indication of fire activity which are generated with low levels of commission error (Schroeder et al. 2008); for this reason, data sets such as the MODIS active fire product have been used to assess the temporal accuracy of burned area products (Boschetti et al. 2010; Giglio et al. 2010). In this study, the MODIS Global Monthly Fire Location Product, MCD14ML, 1 is used to provide an independent indication of the presence or absence of fire at given times of year and spatial locations.
2.1. Global burned area products
Brief descriptions of the products selected for analysis are provided in the subsequent sections, with a tabular summary in Table 1.
2.1.1. Copernicus Burnt Area product
The Copernicus Burnt Area products are generated under the European Commission’s Copernicus Global Land Service. The Burnt Area products are generated from two sensors and are available as three distinct products. Burned Area products generated from the SPOT-Vegetation and Proba-V sensors are available from the Copernicus Global Land Service at 1 km resolution beginning with April 1999A recently released 300 m product derived from Proba-V imagery, is available for the April 2014 to present. The Copernicus Burnt Area products identify burns by detecting sudden changes in a vegetation index. Individual 1 km pixels are grouped into 1° cells and flagged as burned if the value of the vegetation index is more than two standard deviations below the mean value throughout the historical time series for the grid cell (Tansey et al. 2008). The product is distributed in 10° by 10° tiles through the Copernicus Global Land Service data access portal.2
2.1.2. Fire CCI burned area product
Based on acquisitions from the Medium Resolution Imaging Spectrometer (MERIS), on-board the ESA Envisat platform, the Fire CCI product is produced as a 300 m pixel product and a 0.5° gridded product. Both are distributed in the geographic projection, with the pixel product available in six geographic windows.3 At the time of writing, only the years 2005–2011 are publicly available. However, the goals of the Fire CCI project are to extend the archive from 2000 to 2017, with a spatial resolution of 250–500 m for the pixel product and 0.25° for the gridded product. A two-phase algorithm, described in full in Alonso-Canas and Chuvieco (2015), is used to identify burned areas. First, MODIS active fire locations are used to identify seed pixels corresponding to high confidence burned areas. A region growing algorithm is then applied using the seed pixels selected in the first phase. These phases are applied to MERIS VEGETATION input data, which are distributed in 10° by 10° tiles.
2.1.3. MODIS MCD45A1 burned area product
The MODIS Collection 5.1 Monthly Burned Area product, MCD45A1, is part of the suite of land monitoring products systematically generated from MODIS data (Justice et al. 2002a, 2002b). The product uses 500 m input data from the MODIS sensors on-board both the Aqua and Terra satellite platforms and is available starting from April 2000, with the exception of June 2001 which was not processed due to a sensor outage (Roy et al. 2005b). The algorithm uses a bidirectional reflectance distribution function (BRDF) model to identify burned areas. Following an inversion period of up to 16 days, the observed reflectance of MODIS band 2 (841–876 nm) and band 5 (1230–1250 nm) are compared to a predicted reflectance value based on the BRDF model inversion. A Z-score for both bands is computed as a function of the predicted and observed reflectance values, which is used to identify potential burned areas (Roy et al. 2005a, 2005b). The product is distributed by the USGS Land Process Distributed Active Archive Center (LP DAAC).4
2.1.4. MODIS MCD64A1 burned area product
The MCD64A1 burned area mapping algorithm combines daily MODIS surface reflectance imagery with 1 km MODIS active fire data to map burning on a daily basis at 500 m spatial resolution. The algorithm applies dynamic thresholds to composite MODIS Terra and Aqua imagery generated from a burn-sensitive spectral band index derived from MODIS 1240 and 2130 nm Terra and Aqua bands, and a measure of temporal variability. Cumulative MODIS 1 km active fire detections are used to guide the selection of burned and unburned training samples and to guide the specification of prior burned and unburned probabilities (Giglio et al. 2009). The MCD64A1 product is also distributed by the USGS LP DAAC.5
For this study, we used the Collection 5.1 MCD45A1 and Collection 6 MCD64A1 burned area products. The Collection 6 MCD64A1 product detects significantly more burned area than the previous Collection 5.1 MCD45A1 and Collection 5.1 MCD64A1 products, with global burned area increasing by approximately 18.5–24.5% for the former, and by approximately 25–28.5% for the latter. While the Collection 6 product has superseded the Collection 5.1 product, both are included to examine the spatial and temporal manifestations of the difference in algorithm performance which may have significant impacts on existing user applications.
2.2. MODIS MCD14ML active fire product
We used the MODIS Collection 5 MCD14ML global monthly fire location product, which provides the geographic location, date, and additional information for each 1 km fire pixel detected by the Terra and Aqua MODIS sensors on a monthly basis. Fires that are actively burning at the time of the satellite overpass (and under relatively cloud-free conditions) are detected using the contextual algorithm described by Giglio et al. (2003). The MODIS Active Fire has been validated against coincident high-resolution Advanced Spaceborne Thermal Emission and Reflection Radiometer data (Morisette et al. 2005; Csiszar, Morisette, and Giglio 2006; Giglio et al. 2008; Schroeder et al. 2008; Giglio, Schroeder, and Justice 2016) as well as several other studies (e.g. De Klerk 2008; Hawbaker et al. 2008).
3. Methods
3.1. Comparison grid
Previous works which consider burned area products at yearly and sub-continental to global scales suffer from two limitations with regard to scale of analysis: generally the spatial unit for analysis is too large to identify differences in the location of burn identifications (e.g. Boschetti et al. 2004), and the temporal unit for analysis is too long to capture inconsistencies in the timing of burn identifications (e.g. Giglio et al. 2010). To address these issues, we implement a comparison grid of finer resolution both temporally and spatially through use of the voxels described in the proceeding sections.
3.1.1. Spatial analysis grid
Burning is reported by TSA polygon. The TSA is a tessellation of the Landsat WRS-2 acquisition scheme which assigns each location on the Earth’s surface to one WRS path/row combination (Gallego 2005; Kennedy, Yang, and Cohen 2010). Overlapping path and row areas are therefore eliminated. TSAs have been used previously as the spatial sampling unit for burned area product validation (Padilla, Stehman, and Chuvieco 2014; Boschetti, Stehman, and Roy 2016).
Results are also aggregated to 14 large regions, herein referred to as fire regions, defined in the Global Fire Emissions Database (GFED) (Giglio et al. 2006; van der Werf et al. 2006). These regions are characterized by similarities in their climate and fire regime attributes, and are suitable for emissions studies (van der Werf et al. 2010) and fire activity reporting (Boschetti and Roy 2008; Giglio et al. 2010; Giglio, Randerson, and van der Werf 2013). The larger scale of the fire regions relative to the TSA polygons enables analysis of trends that manifest at the larger regional scale (Figure 1).
3.1.2. Temporal comparison grid
Several previous burned area product intercomparisons report burning as a yearly total, which has the undesirable effect of obscuring the temporal inconsistencies in the products. However, the compositing periods of the selected burned area products are dekadal (Copernicus Burnt Area) or monthly (Fire CCI, MODIS MCD45A1, MODIS MCD64A1), allowing for a higher temporal resolution in this study. By dividing the world into a set of TSA tiles geographically and temporally in fixed intervals, a voxel concept is used to assign each burned pixel to a TSA polygon in space and time (Boschetti, Stehman, and Roy 2016). Two temporal grids are used in this study: a finer monthly grid, and a quarterly grid used to highlight seasonal patterns.
3.2. Data preprocessing
For each burned area product, all burned grid cells are assigned to a corresponding TSA voxel based on their spatial location and product date. For the Fire CCI and Copernicus Burnt Area products, which are distributed in the geographic projection, determining the burned area for each TSA polygon in a geographic projection requires special consideration for the effect of latitude. To compensate for the variation in cell size, the contribution of each cell was adjusted using a cosine weighting factor and assuming an Earth radius of 6371 km.
The MCD45A1 and MCD64A1 products are generated in the equal-area sinusoidal projection, thus the total burned area is simply the number of burned grid cells multiplied by the cell area (21.46 ha). These values were recorded for each TSA tile in the overlapping product coverage for each month throughout the 2005–2011 study period.
We elected to process the amount of area burned per TSA polygon in the native pixel size, adjusting for the effects of latitude as necessary, i.e. for the products distributed in the geographic projection. We acknowledge that small errors may be introduced along the edges of the polygons, however, this decision reduces the error propagated by resampling and projecting the data from its original format.
For analysis purposes, each TSA polygon is also associated with a fire region if its centroid is contained by the region. Each data set is therefore summarized on a per-voxel basis and associated with a fire region as appropriate for the seven-year study period.
3.3. Data analysis
3.3.1. Burned area totals
The simplest indicator of burned area algorithm performance is the burned area total per month and per year. Although summaries of burning are generally not sufficient for assessing performance, such summaries are useful for identifying trends from year-to-year. The annual burned area totals were calculated globally and for each fire region over the seven-year study period on a monthly and yearly basis.
3.3.2. Scatterplots
The relative amount of burning for each product is summarized at a finer temporal resolution (monthly and quarterly) by scatterplots of the TSA tiles overlapping the fire region. Scatterplots are generated to compare two products at a time in four different cases: global yearly burning totals, global monthly burning totals, region-specific yearly burning totals, and region-specific monthly burning totals.
A total least squares (TLS) regression is calculated for each scatterplot as well as the root mean square error (RMSE). TLS regression models are appropriate for product intercomparison because the model assumes no dependency of the variables, thus the result of the regression does not depend on the arbitrary choice of axis assignment. The slope of the regression line is an indication of the relative burned area identification bias of two products. The RMSE of the distribution is used as an indicator of the dispersion of the burned area proportions, or the tendency of the classifiers to identify the same amount of burned area across voxels.
Both the TLS regression slope (and offset) and RMSE are necessary to determine if there is a bias between products and the degree to which burn detections are co-located. Based on the interrogation of the scatter plots, individual Landsat scenes can be selected for further investigation, particularly for scenes where one product identifies a large amount of burning and the other identifies very little.
3.3.3. Temporal heat maps
Active fire detections are known to have very low commission errors (Schroeder et al. 2008; Giglio, Schroeder, and Justice 2016), hence they are an independent indicator of the presence of fire activity in a given region at a given time, and can be used as a qualitative evaluation of the time of burning, independent of the intercomparison between burned area products (e.g. Boschetti et al. 2010). MODIS active fire counts were aggregated according to the same voxel scheme described above; for each month and fire region, a heat map is calculated indicating the burned area identified by each product compared to the number of active fire detections. Heat maps can be used to identify whether burn detections are temporally coincident with active fire detections throughout the entire time series.
4. Results
The results of our intercomparison are presented in the following sub-sections. Due to the scale of this study in terms of number of products analyzed and the length of the time series, it is not possible to reproduce all of the results here. Rather, in addition to summary results for the entire study period, we consider 2006 as an example year for a more detailed comparison of the products, which provides examples of significant fire activity in Eastern Europe and Southeast Asia as well as typical fire activity in high-burning regions such as Africa and Australia. The systematic processing of the products should yield consistent results from year to year. Comparisons between products are made with respect to the MCD64A1 product because it is the most recently updated product generated operationally. The results for all years are made available in the supplementary materials.
4.1. Overview
The total annual burned area detected globally and for each fire region by the four global burned area products is reported in Figure 4. In every year, the Copernicus Burnt Area product detected the least total amount of burned area while the Collection 6 MCD64A1 product detected the most. Summary statistics for each product are reported in Figure 2.
Figure 4.
Percent of burned area detected per fire region, normalized to the maximum amount of burned area identified by any product in the respective fire region (2005–2011).
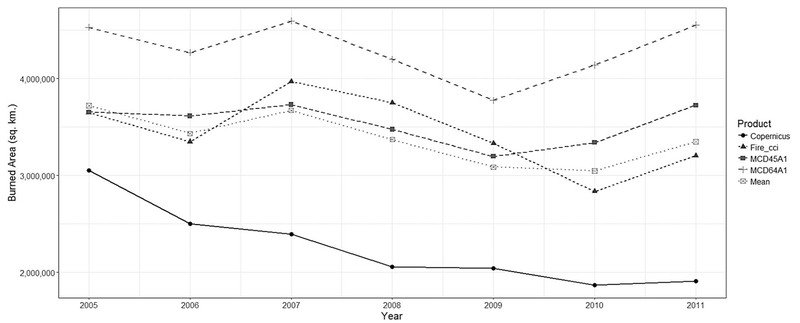
Overall, MCD64A1 detects the most total burned area throughout the study period, exceeding the totals detected by Copernicus, Fire CCI, and MCD45A1 by approximately 90%, 25%, and 21%, respectively. Conversely, the Copernicus Burnt Area Product detects the least amount of burned area throughout the study period, trailing the estimated burned area from Fire CCI, MCD45A1, and MCD64A1 by approximately 52%, 56%, and 90%, respectively. The total burned area detected by Fire CCI and MCD45A1 is similar (within 2% global burned area), however, this does not capture the significant differences in the spatial location of the burn identifications. Yearly global burned area totals shown in Figure 3 indicate that the Fire CCI, MCD45A1, and MCD64A1 products do not demonstrate a robust trend in burned area throughout the seven-year study period. On the other hand, the Copernicus Burnt Area product detects noticeably less burned area through time.
Figure 3.
Total burned area identified per year by each product.
Concerning individual fire regions, the Copernicus Burnt Area product shows evident and significant discrepancies from the other products. Specifically, it identified significantly less burned area in the regions which contribute most to the global burned area total, i.e. Southern- and Northern- Hemisphere Africa (SHAF, NHAF), while detecting significantly more burned area than the other products in zones such as Boreal Asia (BOAS), Boreal North America (BONA), Temperate North America (TENA), Europe (EURO), and the Middle East (MIDE) which, according to the other three burned area products as well as previous studies, do not contribute significantly to global burned area totals.
The magnitude of these differences is illustrated in Figure 4, which illustrates, per fire region, the proportion of total burning detected by each product normalized to the region’s maximum. Noteworthy outliers for the Fire CCI product include Equatorial Asia (EQAS) and Northern Hemisphere South America (NHSA). The Copernicus product identifies more burning than the other three products combined in four regions: TENA, BONA, EURO, and MIDE.
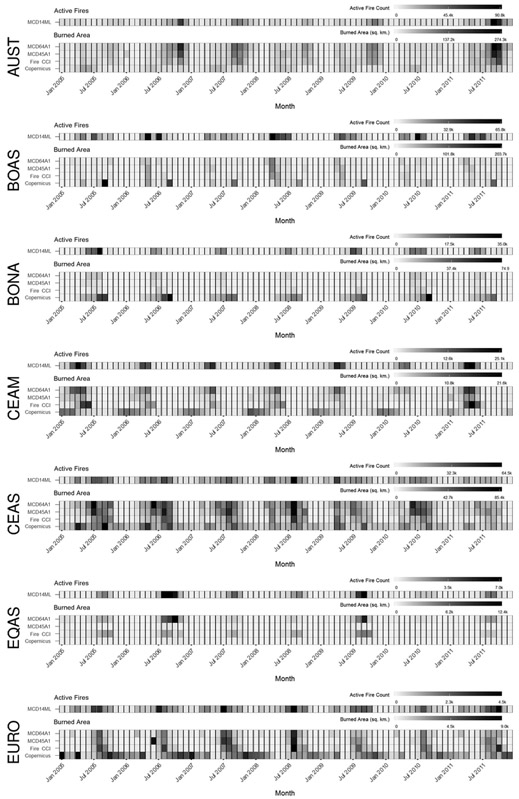
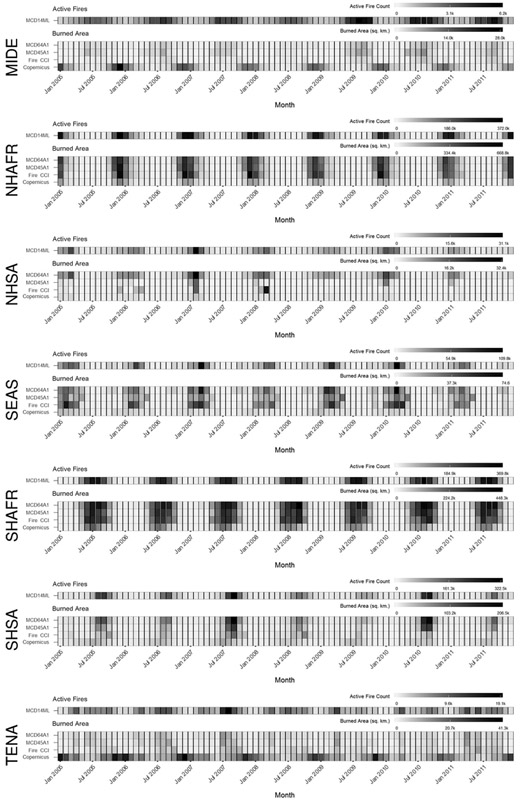
While the magnitude of the burning detected is an important indicator of a product’s performance, it is equally important to consider the temporal aspect of burning. The time of burning is captured in Figure 5 and Figure 6, which compare the burned area detected in a calendar month by the four products to the MCD14ML Active Fire product, which is known to be a good indicator of the timing of the burning season. For most fire regions, the Fire CCI, MCD45A1, and MCD64A1 products show strong agreement with the temporal pattern of the MCD14ML detections. However, the Copernicus Burnt Area product shows temporal patterns unlike the other three products. In particular, regions which show high seasonal variability such as TENA, Central America (CEAM), and EURO appear to be out of phase, which is to say the burning identified by the Copernicus Burnt Area algorithm corresponds to times when there are few or no coinciding active fire detections. In regions characterized by strong fire signals, such as the SHAF and NHAF, there is strong agreement amongst all products with regard to timing, however, there are variations in the magnitude of burning. It is also noteworthy that for EQAS, a region characterized by extensive cloud cover for much of the year, only those algorithms that use active fire detections as an input, Fire CCI and MCD64A1, identify any appreciable amount of burning.
Figure 5.
Comparison of the timing of active fire detections with burned area detections (AUST – EURO).
Figure 6.
Comparison of the timing of active fire detections with burned area detections (MIDE – TENA).
These results demonstrate that the burned area products have large variations spatially and temporally, even though similar burned area totals may be reported by the different products, as is particularly the case for Fire CCI and MCD45A1.
The following sub-sections will focus on some specific discrepancies between products, highlighting some of the differences in spatial and temporal burning patterns. These analyses are focused on 2006, which was chosen due to the presence of notable fire activity in Eastern Europe and Southeast Asia, in addition to typical fire activity in high-burning regions such as Africa and Australia.
4.2. Fire CCI and MCD64A1 comparison
As shown in Figure 2, in 2006 the MCD64A1 product detects more burned area than the Fire CCI in every fire region except EURO. Globally, MCD64A1 identified 919,241 km2 burned area more than Fire CCI, though most of this difference – about 77% – can be attributed to the four regions which burned the most: AUST, CEAS, NHAF, and SHAF. Across all fire regions, the temporal patterns of Fire CCI and MCD64A1 are generally in agreement with the MCD14ML Active Fire detections (Figures 5 and 6). Interestingly, in some cases, the Fire CCI detections appear to identify longer burning periods than the MCD64A1 detections by a month for regions which do not experience large amounts of burning such as EURO, EQAS, and CEAM, though this is generally not the case in 2006 (Figures 5 and 6).
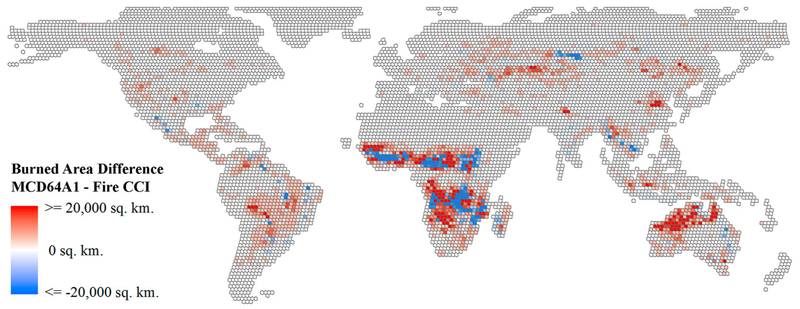
Regarding the difference in burned area detected per TSA polygon, there are some spatial manifestations of the classifier tendencies. The results from 2006 are illustrated in Figure 7. TSAs where MCD64A1 identifies greater burned area than Fire CCI are more prevalent, as is to be expected given the tendency of the former to identify more area as burned throughout the study period. However, there is spatial clustering of occurrences where the Fire CCI product identifies more burned area that tends to be consistent from year-to-year.
Figure 7.
Maximum differenced burned area totals per TSA for 2006 between MCD64A1 and Fire CCI. Each cell indicates the greatest difference between concurrent months in the year.
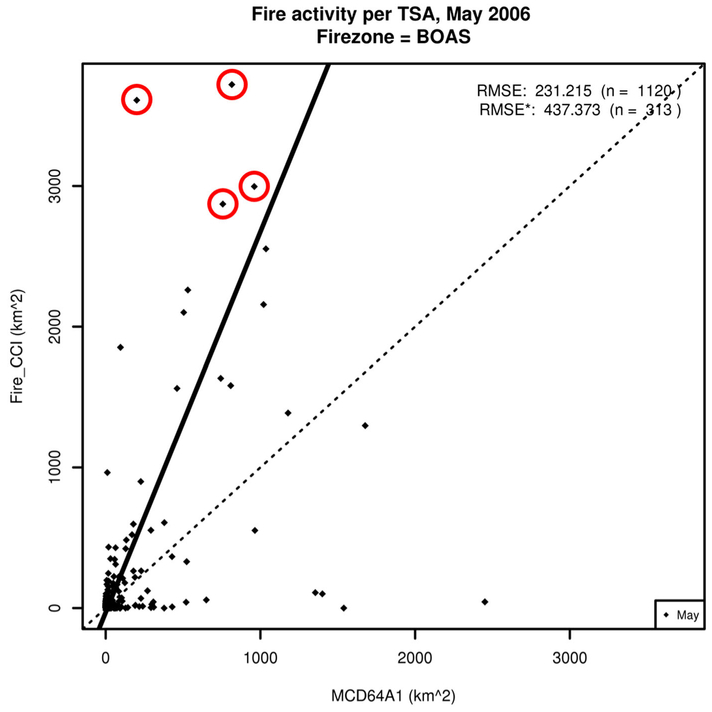
The four TSA points highlighted in Figure 8 represent the four instances where the Fire CCI product detects more than 2000 km2 burned area than the corresponding MCD64A1 result. Each belongs to the Eastern Europe burning event within Novosibirsk Oblast, Russia described in Chuvieco et al. (2016), who claim that the Fire CCI product correctly detected this burning event while GFED4 (i.e. MCD64A1 Collection 5.1) missed the burns in their entirety. Using the spatial and temporal comparison grid described previously, we investigate this event to determine whether the Collection 6 MCD64A1 product is able to capture this event as well as verify the Fire CCI ability to correctly identify the burning episode.
Figure 8.
Scatterplot for BOAS in May, 2006 illustrating burned area detected per TSA polygon for Fire CCI and MCD64A1. The four circled points represent the largest difference in burned area detected between Fire CCI and MCD64A1 and coincide with the burning events described in Chuvieco et al. (2016).
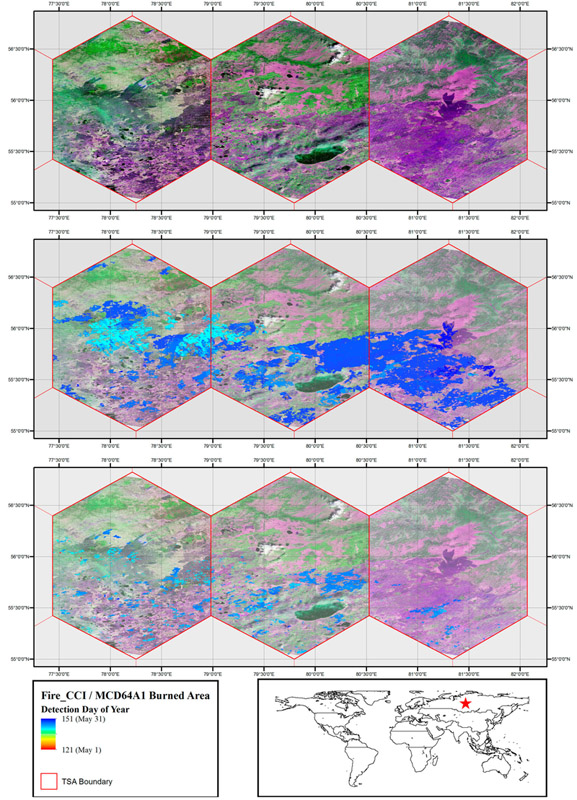
The corresponding Landsat scenes and coarse resolution burned area detections are shown in Figure 9. This evidence corroborates the claim that the Fire CCI product identifies the burning episode while MCD64A1 continues to mostly omit it in the Collection 6 version of the product.
Figure 9.
Comparison of Eastern Europe burning episode, May 2006. Top: Best available Landsat imagery, from left to right – Path 152 Row 21 (Landsat 5, 12 May 2006); Path 151 Row 21 (Landsat 7, 6 June 2006); Path 150 Row 21 (Landsat 7, 30 May 2006) with SWIR1-NIR-SWIR2 composite. Middle: Fire CCI burned area for May 2006. Bottom: MCD64A1 burned area for May 2006.
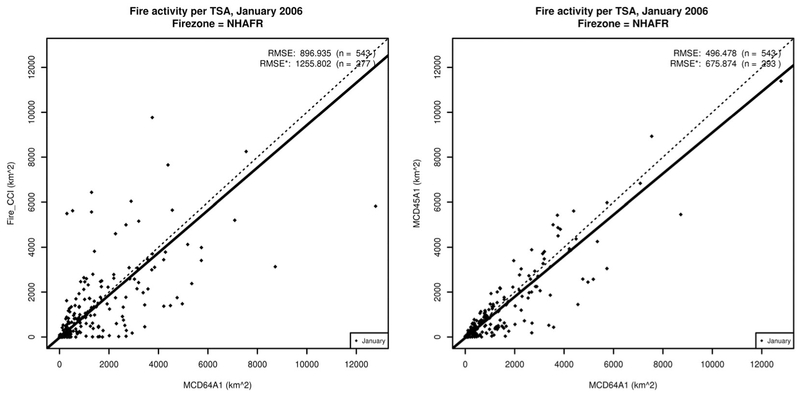
In addition to this, we investigate a particularly heterogeneous area in the NHAF which is characterized by large differences in reported burned area. By comparing the values from the TSA scatterplot in Figure 10, it is clear that while there is relatively little bias (indicated by the slope of the TLS regression) between the estimates from the two products in January 2006 for NHAF, there are noteworthy cases where one product detects much more burned area than the other. At the fire region scale, these commissions and omissions balance one another, causing the TLS regression to show a near one-to-one correspondence, indicating low bias in the estimate for the fire region. However, the lack of bias in the regression model is not necessarily indicative of agreement between the two products. As shown in the same figure, the regression value is similar to that of the MCD45A1 and MCD64A1 comparison for the same voxel, however, the lower RMSE indicates that there is generally better spatial agreement between the products and the likelihood of overlap within voxels is greater.
Figure 10.
Scatterplots for NHAF in January, 2006 illustrating burned area detected per TSA polygon for Fire CCI (left)/MCD45A1 (right) and MCD64A1. Note that while the slope is similar, the RMSE is much greater for the CCI plot.
From inspection at the native resolution, it is clear that the Fire CCI product suffers from the presence of large artifacts that coincide with the edges of processing tiles. The artifacts lead to large swaths of burning occurring during a single day of the year and dominate the majority of the overlapping TSA, as illustrated in Figure 11.
Figure 11.
Example of artifacts introduced by the region growing procedure in the Fire CCI product. Western portion of NHAFR, January 2006.
4.3. Copernicus Burnt Area and MCD64A1 comparison
The Copernicus Burnt Area shows little relationship to the other burned area products both spatially and temporally. On a global and annual basis, the product detects the least amount of burned area by a significant amount (Figure 2) and as previously mentioned, generally detected less burned area in successive years throughout the study period. In 2006, the Copernicus areal estimates were similar to the other three products for CEAS, NHSA, and SHSA while in the remaining 10 fire regions the Copernicus product detects either more than twice as much burning as the other products or less than half of the other products (Figure 2).
The timing of these burns also tends not to coincide with MCD14ML detections throughout the year, with some extreme cases, such as CEAM, EURO, MIDE, and TENA indicating that burning is out of phase with the active fire detections, i.e. the burned area product indicates burning when there is no burning and vice versa (Figures 5 and 6).
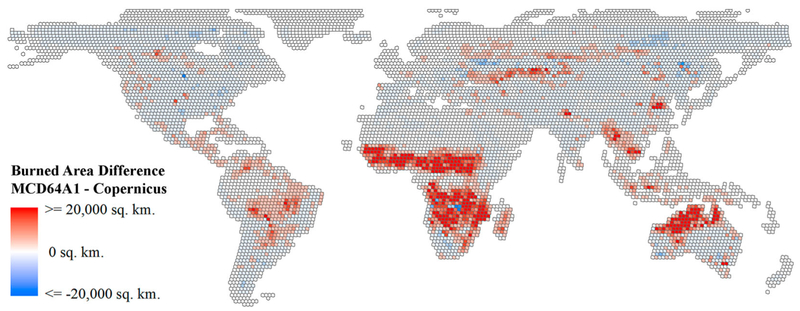
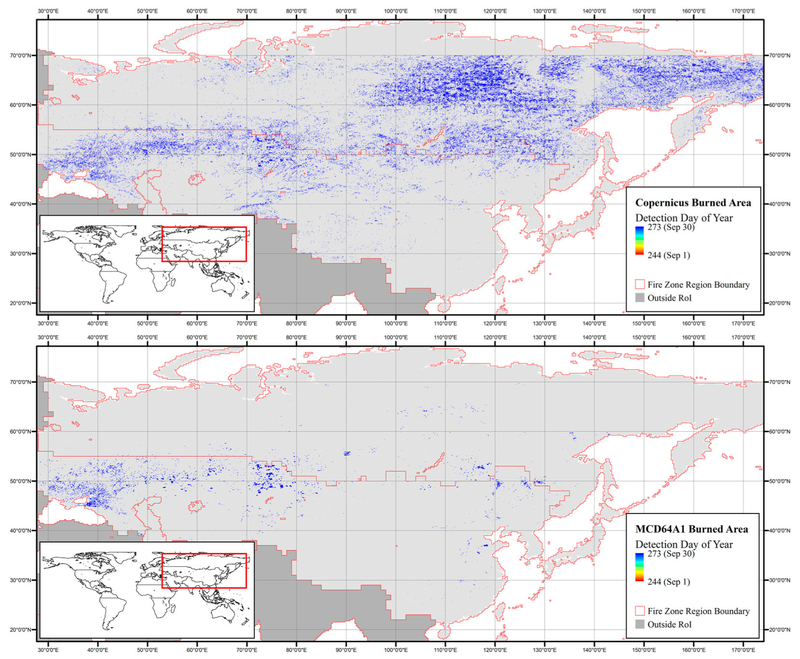
As shown in Figure 12, the Copernicus product identifies small amounts of burning in most TSAs globally. Relative to MCD64A1, this results in lower levels of burning identified in greater burning regions but higher levels of burning identified in lesser burning regions. In the high northern latitude regions, BONA and BOAS, the Copernicus product detects large amounts of burning in August and September for the former region, and September for the latter. While both regions still exhibit a small degree of burning in August (Giglio, Randerson, and van der Werf 2013), September is well beyond the peak of fire activity in these areas. Given the design of the algorithm and the timing of the detections, it is possible that the identifications are false positives resulting from slight variations in the rapid decrease in the vegetation index due to leaf senescence and abscission. The spatial extent of the burn classifications in eastern Russia can be seen in Figure 13 (the areas identified in western CEAS by both products is a wheat producing region where agricultural residue burning is a common practice during this time of the year).
Figure 12.
Maximum differenced burned area totals per TSA for 2006, MCD64A1 and Copernicus Burnt Area. Each cell indicates the greatest difference between concurrent months in the year.
Figure 13.
Burned area identifications for Copernicus (top) and MCD64A1 (bottom) in September 2006 for BOAS and CEAS, aggregated to 6 km grid cell (maximum value aggregation).
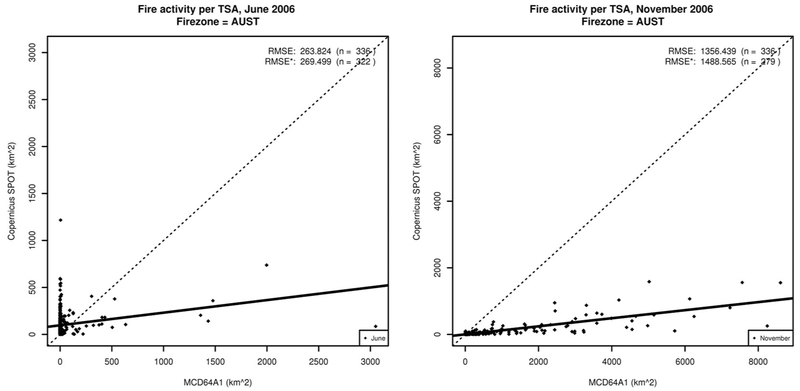
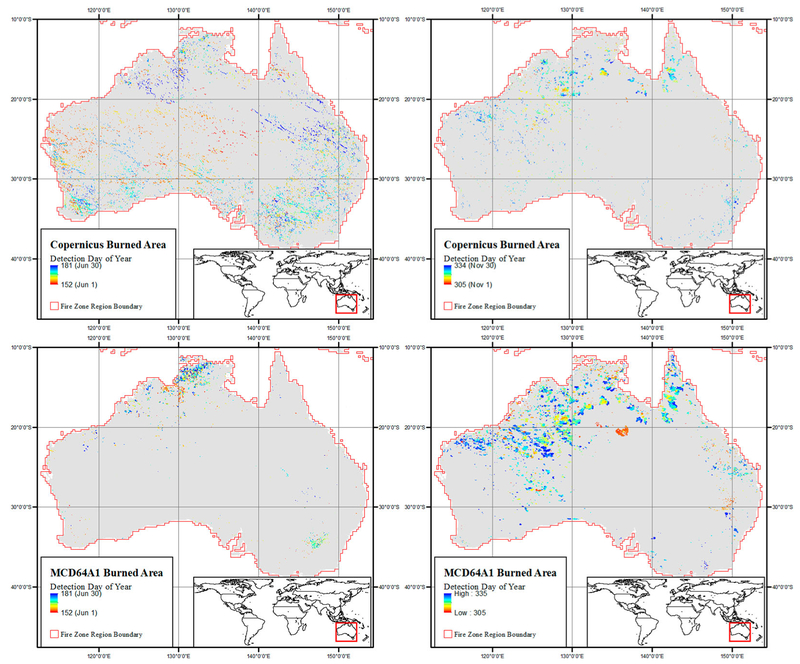
In Australia, which contributes significantly to global burned area totals, the out-of-phase burn identifications shown in Figure 5 are corroborated by Figures 14 and 15. Noting that the majority of fire activity in AUST occurs between August and December, while very little fire activity occurs between January and July (Giglio, Randerson, and van der Werf 2013), the small amounts of fire detected in June can generally be attributed to commission errors while the extent of burning observed in November is much lower for the Copernicus Burnt Area product than the MCD64A1 product. With respect to the expected duration of the 2006 fire season, MCD64A1 identified approximately 68,448 km2 area burned between January and July and 508,781 km2 area burned between August and December while Copernicus identified approximately 124,238 and 81,040 km2, respectively.
Figure 14.
Scatterplot of burned area per TSA in AUST, June (left) and November (right) 2006. Copernicus (y-axis) detects less burning per TSA but, in June, more TSA’s with burning.
Figure 15.
Burned area identifications for Copernicus (top) and MCD64A1 (bottom) in June (left) and November (right) 2006for AUST, aggregation to 6 km grid cell (maximum value).
4.4. MCD45A1 and MCD64A1 comparison
Consistent with other years, for 2006 MCD45A1 detected more burning than Copernicus Burnt Area, a similar amount of burning compared to Fire CCI, and less burning than MCD64A1. Also like Fire CCI, the timing of the burn detections agrees with MCD14ML, though the pattern is slightly more consistent with the active fire detections.
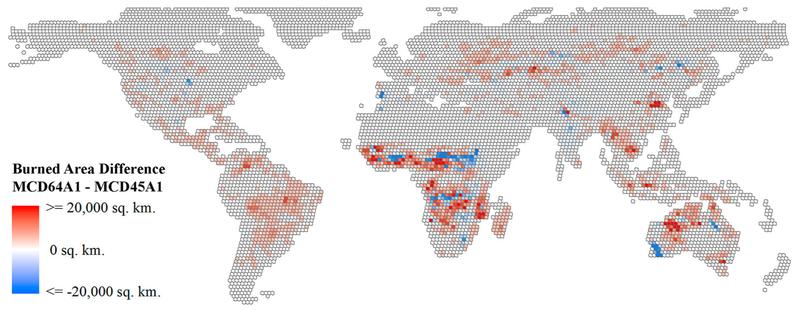
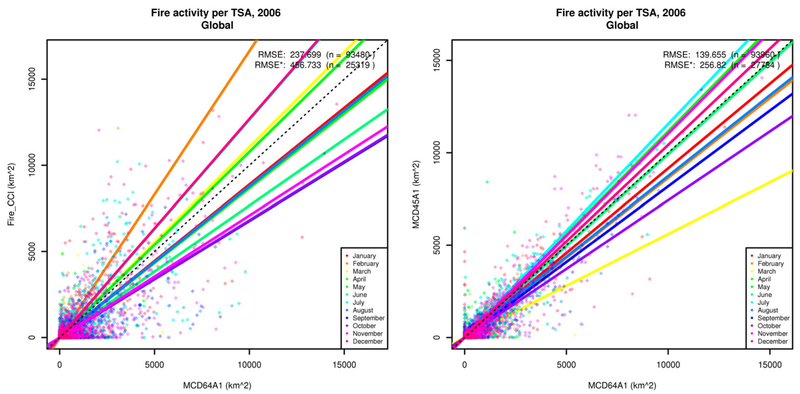
In 11 of the 14 fire regions, MCD45A1 identifies less area as burned than MCD64A1, the exceptions being EURO, MIDE, and TENA. The spatial distribution of differences between MCD45A1 and MCD64A1 is similar to that of Fire CCI and MCD64A1. In 2006, the differences in SHAF are similar in location, albeit smaller in magnitude, to the Fire CCI differences (Figure 16). This is evident in the scatterplots (Figure 17), which show that while there are differences in the burned area detected per TSA, the RMSE of these errors during the burning season tends to be smaller for MCD45A1 and MCD64A1 than for Fire CCI and MCD64A1.
Figure 16.
Maximum differenced burned area totals per TSA for 2006, MCD64A1 and MCD45A1. Each cell indicates the greatest difference between concurrent months in the year.
Figure 17.
Example scatterplots of global TSA Burned Area totals for MCD64A1 vs. MCD45A1 (left) and Fire CCI (right). While the TLS regression slopes are similar, the RMSE of the global distribution is greater for Fire CCI.
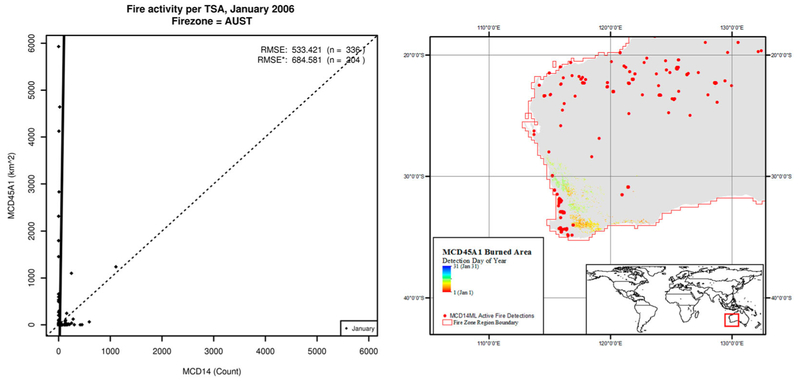
There are instances where MCD45A1 differs greatly from MCD64A1. For the 2006 focus period, there is a notable presence of burned area detected in the southern portion of Western Australia which is detected by MCD45A1 and not MCD64A1. This detection in January coincides with the location of wheat in the province and is likely due to harvest, not burning. This is supported by Figure 18, which shows no coinciding active fire detections in the area labeled as burned. This is also evident in the scatterplot which shows large amounts of burning detected by MCD45A1 corresponding no active fire detections. This type of commission error was observed again in December 2007 in the same region.
Figure 18.
AUST January 2006. (Left) Scatterplot of MCD45A1 Burned Area per TSA vs. MCD14ML Active Fire count per TSA; note the burned area totals associated with no active fire detections. (Right) Map of MCD45A1 burn identifications and MCD14ML active fire detections.
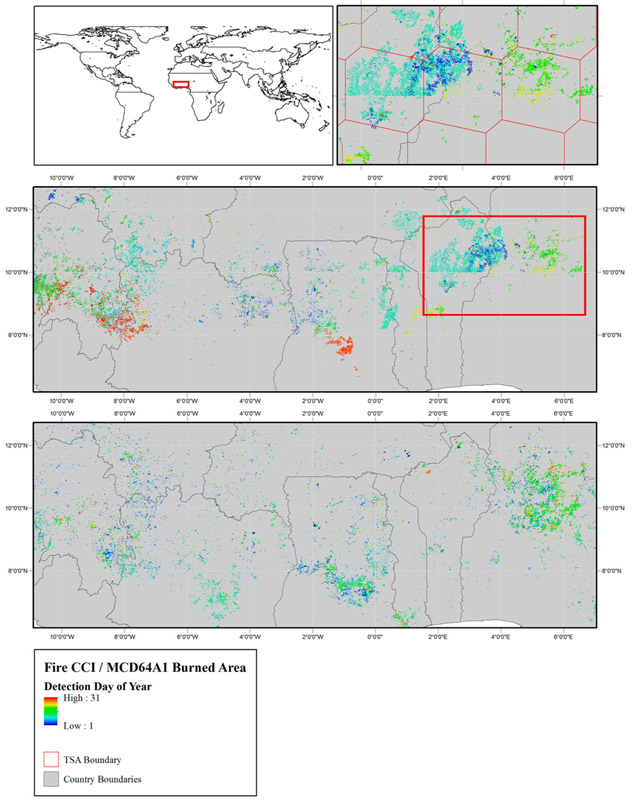
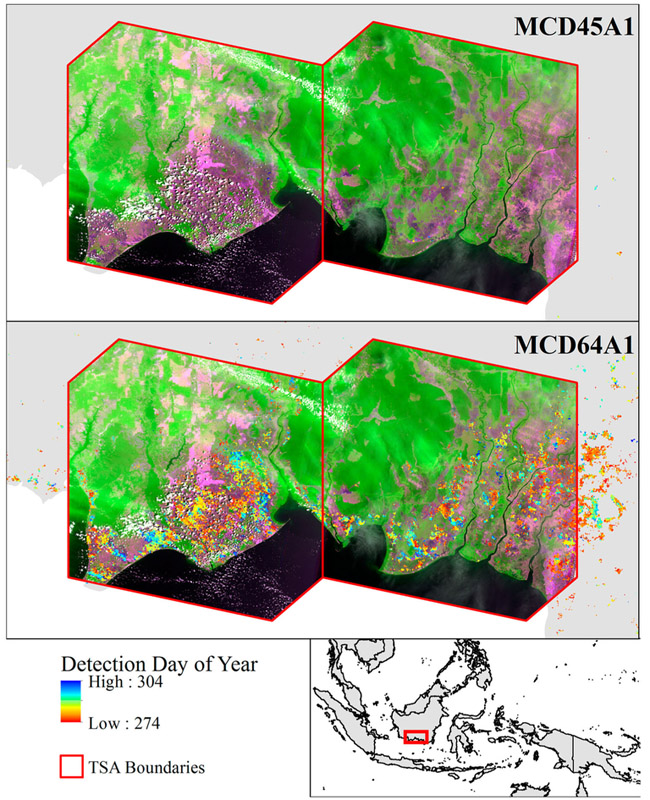
Fires observed in Kalimantan, Indonesia (EQAS) in October 2006 went undetected or grossly underestimated by MCD45A1, Fire CCI, and Copernicus Burnt Area, likely due to persistent cloud cover in the region resulting from the start of the rainy season. Using the voxel scheme, we observe that the majority of the burning occurred in only two TSAs during the burning episode. While MCD64A1 was able to some of the burned area, MCD45A1 identified only a few isolated pixels as burned (Figure 19). This result is in keeping with the results throughout the entire study period for the four burned area products tested in this intercomparison, MCD45A1 classifies the least amount of burning in EQAS every year while MCD64A1 classifies the most amount of burning in EQAS for the majority of years. This pattern is also observed in CEAM, which shares similar climate and cloud cover traits with EQAS, indicating that the MCD64A1 algorithm is more robust with respect to cloud cover than the MCD45A1 algorithm which requires more clear observations during the inversion period in order to identify an area as burned.
Figure 19.
October 2006 EQAS fires in southern Kalimantan, Indonesia. MCD45A1 (top) and MCD64A1 (bottom) detections overlaid on Landsat 5 scenes path/row 118/062 (29 October 2006; right) and 119/062 (5 November 2006; left) with SWIR1-NIR-SWIR2 composite.
5. Discussion and conclusions
In this paper, through systematic intercomparison of four global burned area products, we have identified spatial and temporal similarities and differences in burned area detections between 2005 and 2011. The products – Copernicus Burnt Area, Fire CCI, MODIS Collection 5.1 MCD45A1, and MODIS Collection 6 MCD64A1 – are based on coarse spatial resolution (~300 m grid cell or larger) and high temporal resolution (3 days or less revisit time) satellite data and are generated globally and systematically. The intercomparison procedure exploits a voxel concept to create an intercomparison grid, defined spatially by the Landsat TSAs (Gallego 2005; Kennedy, Yang, and Cohen 2010), and temporally by calendar months. At a broader scale, fire regions are also used in order to better compare and contrast burning patterns under similar conditions (Giglio et al. 2006; van der Werf et al. 2006). While we focus on specific cases in 2006 for the analysis, all results are included in the supplemental material and the conclusions drawn can generally be applied to all years throughout the study period.
Global burning totals show that for each calendar year, MCD64A1 detected the most total burned area while Copernicus Burnt Area detected the least total burned area. The Fire CCI and MCD45A1 algorithms detected similar amounts of burned area each year throughout the study period, consistent with the results described by Alonso-Canas and Chuvieco (2015). The MODIS Collection 6 MCD64A1 data set identifies over 25% more burning per year than its predecessor during the study period.
While Fire CCI, MCD45A1, and MCD64A1 showed similar patterns in yearly global total burned area detected per year, Copernicus Burnt Area detected progressively less burned area from 2005 to 2010, with only a slight increase in 2011 and smaller than the 2010–2011 increase identified by the other classifiers. At the time of writing, we are not aware of any systematic drift in the calibration of SPOT-Vegetation, pointing to a reduced sensitivity of the algorithm over time, possibly due to the algorithms use of a running vegetation index-based time series, which introduces eccentricity into the time series as the data set expands, requiring the algorithm to exceed a greater threshold in order to identify a pixel as burned.
The classifier tendencies diverge at the fire region level. In spite of identifying the least burned area globally, Copernicus Burnt Area identifies the most burned area in seven of the 14 fire regions. However, these regions are typically responsible for relatively small contributions to global burned area. For six of the remaining seven fire regions, MCD64A1 identified the most burned area over the seven-year study period. In persistently cloudy regions such as EQAS and NHSA, the long (16-day) inversion period required by MCD45A1 often results in burn omissions due to insufficient data resulting from cloud cover or aerosol content. In line with expectations, Fire CCI and MCD64A1 identify the most burned area in cloudy regions due to their reliance on active fire detections as training data samples.
Comparison with the MCD14ML Active Fire data set indicates that while the burn timing of Fire CCI, MCD45A1, and MCD64A1 is similar to the pattern of active fire activity, the Copernicus Burnt Area is apt to detect burned areas outside of the normal burning cycle, with extreme examples in temperate climates such as EURO and TENA where the Copernicus detections are out of phase with the cycle of active fire detections. The consistency of these cycles at the fire region level combined with the algorithm’s reliance on vegetation indices suggests that the Copernicus Burnt Area detections are related to the natural yearly growth and senescence cycles of the vegetation in the respective region. The timing of burning is important when considering fire cycles in modeling exercises because the spread of fire is known to be constrained by, amongst other factors, fuel (i.e. biomass) availability while the emissions from burning are a factor of the biomass consumed. Errors in the timing of fire detection can have large effects on the biomass emissions estimates due to seasonal variations in precipitation and temperature which act as controls on fuel availability, combustion type (i.e. smoldering vs. flaming) and combustion completeness (Korontzi, Justice, and Scholes 2003; van Leeuwen and van der Werf 2011).
Given that the use of the data sets often occurs at the local, national, and regional scales (e.g. van der Werf et al. 2009; Leblon, Bourgeau-Chavez, and San-Miguel-Ayanz 2012; Loboda et al. 2012; Rucker and Tiemann 2012; Rossi et al. 2016), it is important to generate products that exhibit reliable location, timing, and extent of burning. Intercomparison is, therefore, an important and practical tool for characterizing the relative performance of global burned area products in this regard as it allows for wall-to-wall coverage of the entire time series which is impractical, if not impossible to achieve, with current validation practices and protocols. As a result, it is able to capture burning events which are acute and anomalous which would otherwise be unlikely to appear in a random sample, such as the 2006 examples presented for Kalimantan, Indonesia (EQAS, October 2006) and Novosibirsk Oblast, Russia (BONA, May 2006).
Nonetheless, product intercomparison implicitly assumes that, as a whole, the products being compared provide a reasonable approximation of the conditions on the ground. For example, if all products omit burning in a region then there is no basis for investigating that region on a data-driven a posteriori basis. Intercomparison should, therefore, be recognized as an important tool in product evaluation that is complementary to, rather than a replacement for, product validation. In this context, the recent study by Boschetti, Stehman, and Roy (2016) provides some guidelines on procedures for validation of global burned area products.
Given the results of this intercomparison, which demonstrate that the four burned area products do not achieve a consensus on burn locations or timing, there is a clear need for standardization of satellite-derived burned area products and the reporting of their accuracies. Developing a comprehensive burned area validation data set to assess consistently the accuracy of multiple global products would be an important next step towards helping users assess which product is most appropriate for their application. In the meantime, users of any burned area product should take care to understand the nature of commission and omission errors of the product with regard to geographic location, timing of the burning season, and total amount of burning.
Future efforts based on this work and upcoming systematic validation exercises such as those described in Boschetti, Stehman, and Roy (2016) and Padilla et al. (2017) focus on identifying sources of errors in publically available burned area products. While it is outside of the scope of the present work, understanding the source of these errors can be an important factor in users’ selection of burned area products for input to other research efforts.
Supplementary Material
Acknowledgments
Funding
This work was supported in part by NASA Grant # NNX14AI68G.
Footnotes
Notes
Disclosure statement
No potential conflict of interest was reported by the authors.
Supplemental data for this article can be accessed athttps://doi.org/10.1080/17538947.2018.1433727. The supplemental material provided contains the combination of all scatterplots described in this manuscript. The self-describing zip files contain charts for burned area aggregated globally and at the fire region level, where the unit for analysis is the TSA for the respective time period. Time periods consist of yearly, quarterly (January-March, April-June, July-September, October-December), and monthly windows.
References
- Alonso-Canas I, and Chuvieco E. 2015. “Global Burned Area Mapping from ENVISATMERIS and MODIS Active Fire Data.” Remote Sensing of Environment 163: 140–152. [Google Scholar]
- Archibald S, Lehmann CE, Gómez-Dans JL, and Bradstock RA. 2013. “Defining Pyromes and Global Syndromes of Fire Regimes.” Proceedings of the National Academy of Sciences 110 (16): 6442–6447. [DOI] [PMC free article] [PubMed] [Google Scholar]
- Archibald S, Scholes RJ, Roy DP, Roberts G, and Boschetti L. 2010. “Southern African Fire Regimes as Revealed by Remote Sensing.” International Journal of Wildland Fire 19 (7): 861–878. [Google Scholar]
- Barbosa PM, Stroppiana D, Grégoire JM, and Cardoso Pereira JM. 1999. “An Assessment of Vegetation Fire in Africa (1981–1991): Burned Areas, Burned Biomass, and Atmospheric Emissions.” Global Biogeochemical Cycles 13 (4): 933–950. [Google Scholar]
- Boschetti L, Brivio PA, Eva HD, Gallego J, Baraldi A, and Gregoire J-M. 2006. “A Sampling Method for the Retrospective Validation of Global Burned Area Products.” IEEE Transactions on Geoscience and Remote Sensing 44 (7): 1765–1773. [Google Scholar]
- Boschetti L, Eva HD, Brivio PA, and Gregoire J-M. 2004. “Lessons to be Learned from the Comparison of Three Satellite-Derived Biomass Burning Products.” Geophysical Research Letters 31 (21). http://onlinelibrary.wiley.com/doi/10.1029/2004GL021229/abstract [Google Scholar]
- Boschetti L, Flasse SP, and Brivio PA. 2004. “Analysis of the Conflict Between Omission and Commission in Low Spatial Resolution Dichotomic Thematic Products: The Pareto Boundary.” Remote Sensing of Environment 91 (3): 280–292. [Google Scholar]
- Boschetti L, and Roy DP. 2008. “Defining a Fire Year for Reporting and Analysis of Global Interannual Fire Variability.” Journal of Geophysical Research: Biogeosciences 113 (G3). http://onlinelibrary.wiley.com/doi/10.1029/2008JG000686/abstract [Google Scholar]
- Boschetti L, Roy D, Barbosa P, Boca R, and Justice C. 2008. “A MODIS Assessment of the Summer 2007 Extent Burned in Greece.” International Journal of Remote Sensing 29 (8): 2433–2436. [Google Scholar]
- Boschetti L, Roy DP, Justice CO, and Giglio L. 2010. “Global Assessment of the Temporal Reporting Accuracy and Precision of the MODIS Burned Area Product.” International Journal of Wildland Fire 19 (6): 705–709. [Google Scholar]
- Boschetti L, Stehman SV, and Roy DP. 2016. “A Stratified Random Sampling Design in Space and Time for Regional to Global Scale Burned Area Product Validation.” Remote Sensing of Environment 186: 465–478. [DOI] [PMC free article] [PubMed] [Google Scholar]
- Chang D, and Song Y. 2009. “Comparison of L3JRC and MODIS Global Burned Area Products from 2000 to 2007.” Journal of Geophysical Research: Atmospheres 114 (D16). http://onlinelibrary.wiley.com/doi/10.1029/2008JD011361/abstract [Google Scholar]
- Chuvieco E, Yue C, Heil A, Mouillot F, Alonso-Canas I, Padilla M, Pereira JM, Oom D, and Tansey K. 2016. “A New Global Burned Area Product for Climate Assessment of Fire Impacts.” Global Ecology and Biogeography 25 (5): 619–629. [Google Scholar]
- Csiszar IA, Morisette JT, and Giglio L. 2006. “Validation of Active Fire Detection from Moderate-Resolution Satellite Sensors: The MODIS Example in Northern Eurasia.” IEEE Transactions on Geoscience and Remote Sensing 44 (7): 1757–1764. [Google Scholar]
- Davies DK, Ilavajhala S, Wong MM, and Justice CO. 2009. “Fire Information for Resource Management System: Archiving and Distributing MODIS Active Fire Data.” IEEE Transactions on Geoscience and Remote Sensing 47 (1): 72–79. [Google Scholar]
- De Klerk H 2008. “A Pragmatic Assessment of the Usefulness of the MODIS (Terra and Aqua) 1-km Active Fire (MOD14A2 and MYD14A2) Products for Mapping Fires in the Fynbos Biome.” International Journal of Wildland Fire 17 (2): 166–178. [Google Scholar]
- D’Odorico P, Gonsamo A, Pinty B, Gobron N, Coops N, Mendez E, and Schaepman ME. 2014. “Intercomparison of Fraction of Absorbed Photosynthetically Active Radiation Products Derived from Satellite Data over Europe.” Remote Sensing of Environment 142: 141–154. [Google Scholar]
- Eidenshink J, Schwind B, Brewer K, Zhu Z, Quayle B, and Howard S. 2007. “A Project for Monitoring Trends in Burn Severity.” Fire Ecology 3 (1): 3–21. [Google Scholar]
- Gallego FJ 2005. “Stratified Sampling of Satellite Images with a Systematic Grid of Points.” ISPRS Journal of Photogrammetry and Remote Sensing 59 (6): 369–376. [Google Scholar]
- Garrigues S, Lacaze R, Baret FJTM, Morisette JT, Weiss M, Nickeson JE, Fernandes R, et al. 2008. “Validation and Intercomparison of Global Leaf Area Index Products Derived from Remote Sensing Data.” Journal of Geophysical Research: Biogeosciences 113 (G2). http://onlinelibrary.wiley.com/doi/10.1029/2007JG000635/abstract [Google Scholar]
- Giglio L, Csiszar I, Restás Á, Morisette JT, Schroeder W, Morton D, and Justice CO. 2008. “Active Fire Detection and Characterization with the Advanced Spaceborne Thermal Emission and Reflection Radiometer (ASTER).” Remote Sensing of Environment 112 (6): 3055–3063. [Google Scholar]
- Giglio L, Descloitres J, Justice CO, and Kaufman YJ. 2003. “An Enhanced Contextual Fire Detection Algorithm for MODIS.” Remote Sensing of Environment 87 (2): 273–282. [Google Scholar]
- Giglio L, Loboda T, Roy DP, Quayle B, and Justice CO. 2009. “An Active-Fire Based Burned Area Mapping Algorithm for the MODIS Sensor.” Remote Sensing of Environment 113 (2): 408–420. [Google Scholar]
- Giglio L, Randerson JT, and van der Werf GR. 2013. “Analysis of Daily, Monthly, and Annual Burned Area Using the Fourth-Generation Global Fire Emissions Database (GFED4).” Journal of Geophysical Research: Biogeosciences 118 (1): 317–328. [Google Scholar]
- Giglio L, Randerson JT, van der Werf GR, Kasibhatla PS, Collatz GJ, Morton DC, and DeFries RS. 2010. “Assessing Variability and Long-Term Trends in Burned Area by Merging Multiple Satellite Fire Products.” Biogeosciences 7 (3): 1171–1186. [Google Scholar]
- Giglio L, Schroeder W, and Justice CO. 2016. “The Collection 6 MODIS Active Fire Detection Algorithm and Fire Products.” Remote Sensing of Environment 178: 31–41. [DOI] [PMC free article] [PubMed] [Google Scholar]
- Giglio L, van der Werf GR, Randerson JT, Collatz GJ, and Kasibhatla P. 2006. “Global Estimation of Burned Area Using MODIS Active Fire Observations.” Atmospheric Chemistry and Physics 6 (4): 957–974. [Google Scholar]
- Hall JV, Loboda TV, Giglio L, and McCarty GW. 2016. “A MODIS-Based Burned Area Assessment for Russian Croplands: Mapping Requirements and Challenges.” Remote Sensing of Environment 184: 506–521. [Google Scholar]
- Hawbaker TJ, Radeloff VC, Syphard AD, Zhu Z, and Stewart SI. 2008. “Detection Rates of the MODIS Active Fire Product in the United States.” Remote Sensing of Environment 112 (5): 2656–2664. [Google Scholar]
- Justice CO, Giglio L, Korontzi S, Owens J, Morisette JT, Roy D, Descloitres J, Alleaume S, Petitcolin F, and Kaufman Y. 2002a. “The MODIS Fire Products.” Remote Sensing of Environment 83 (1): 244–262. [Google Scholar]
- Justice CO, Townshend JRG, Vermote EF, Masuoka E, Wolfe RE, Saleous N, Roy DP, and Morisette JT. 2002b. “An Overview of MODIS Land Data Processing and Product Status.” Remote Sensing of Environment 83 (1): 3–15. [Google Scholar]
- Kennedy RE, Yang Z, and Cohen WB. 2010. “Detecting Trends in Forest Disturbance and Recovery Using Yearly Landsat Time Series: 1. LandTrendr—Temporal Segmentation Algorithms.” Remote Sensing of Environment 114 (12): 2897–2910. [Google Scholar]
- Korontzi S, Justice CO, and Scholes RJ. 2003. “Influence of Timing and Spatial Extent of Savanna Fires in Southern Africa on Atmospheric Emissions.” Journal of Arid Environments 54 (2): 395–404. [Google Scholar]
- Leblon B, Bourgeau-Chavez L, and San-Miguel-Ayanz J. 2012. “Use of Remote Sensing in Wildfire Management” In Sustainable Development-Authoritative and Leading Edge Content for Environmental Management, edited by Curkovic S, 55–81. InTech. https://www.intechopen.com/books/sustainable-development-authoritative-and-leading-edge-content-for-environmental-management/use-of-remote-sensing-in-wildfire-management [Google Scholar]
- Loboda TV, Giglio L, Boschetti L, and Justice CO. 2012. “Regional Fire Monitoring and Characterization Using Global NASA MODIS Fire Products in Dry Lands of Central Asia.” Frontiers of Earth Science 6 (2): 196–205. [Google Scholar]
- Morisette JT, Giglio L, Csiszar I, and Justice CO. 2005. “Validation of the MODIS Active Fire Product over Southern Africa with ASTER Data.” International Journal of Remote Sensing 26 (19): 4239–4264. [Google Scholar]
- Mouillot F, Schultz MG, Yue C, Cadule P, Tansey K, Ciais P, and Chuvieco E. 2014. “Ten Years of Global Burned Area Products from Spaceborne Remote Sensing—A Review: Analysis of User Needs and Recommendations for Future Developments.” International Journal of Applied Earth Observation and Geoinformation 26: 64–79. [Google Scholar]
- Padilla M, Olofsson P, Stehman SV, Tansey K, and Chuvieco E. 2017. “Stratification and Sample Allocation for Reference Burned Area Data.” Remote Sensing of Environment 203: 240–255. [Google Scholar]
- Padilla M, Stehman SV, and Chuvieco E. 2014. “Validation of the 2008 MODIS-MCD45 Global Burned Area Product Using Stratified Random Sampling.” Remote Sensing of Environment 144: 187–196. [Google Scholar]
- Padilla M, Stehman SV, Ramo R, Corti D, Hantson S, Oliva P, Alonso-Canas I, et al. 2015. “Comparing the Accuracies of Remote Sensing Global Burned Area Products Using Stratified Random Sampling and Estimation.” Remote Sensing of Environment 160: 114–121. [Google Scholar]
- Plummer S, Arino O, Simon M, and Steffen W. 2006. “Establishing a Earth Observation Product Service for the Terrestrial Carbon Community: The GLOBCARBON Initiative.” Mitigation and Adaptation Strategies for Global Change 11 (1): 97–111. [Google Scholar]
- Rossi S, Tubiello FN, Prosperi P, Salvatore M, Jacobs H, Biancalani R, House JI, and Boschetti L. 2016. “FAOSTAT Estimates of Greenhouse gas Emissions from Biomass and Peat Fires.” Climatic Change 135 (3–4): 699–711. [Google Scholar]
- Roy DP, and Boschetti L. 2009. “Southern Africa Validation of the MODIS, L3JRC, and GlobCarbon Burned-Area Products.” IEEE Transactions on Geoscience and Remote Sensing 47 (4): 1032–1044. [Google Scholar]
- Roy DP, Frost PGH, Justice CO, Landmann T, Le Roux JL, Gumbo K, Makungwa S, et al. 2005a. “The Southern Africa Fire Network (SAFNet) Regional Burned-Area Product-Validation Protocol.” International Journal of Remote Sensing 26 (19): 4265–4292. [Google Scholar]
- Roy DP, Giglio L, Kendall JD, and Justice CO. 1999. “Multi-Temporal Active-Fire Based Burn Scar Detection Algorithm.” International Journal of Remote Sensing 20 (5): 1031–1038. [Google Scholar]
- Roy DP, Jin Y, Lewis PE, and Justice CO. 2005b. “Prototyping a Global Algorithm for Systematic Fire-Affected Area Mapping Using MODIS Time Series Data.” Remote Sensing of Environment 97 (2): 137–162. [Google Scholar]
- Rucker G, and Tiemann J. 2012. “Eleven Years of MODIS Burned Areas: A GIS Analysis for the Territory of the United Republic of Tanzania.” Project report for Tanzania Forest Services (TFS), Ministry of Natural Resources and Tourism, Dar es Salaam, 54. [Google Scholar]
- Sánchez RR, Heil A, and Chuvieco E. 2014. “Product Intercomparison Report (PIR).” Version 1.4. http://esa-fire-cci.org/webfm_send/762. [Google Scholar]
- Schroeder W, Prins E, Giglio L, Csiszar I, Schmidt C, Morisette J, and Morton D. 2008. “Validation of GOES and MODIS Active Fire Detection Products Using ASTER and ETM+ Data.” Remote Sensing of Environment 112 (5): 2711–2726. [Google Scholar]
- Stehman SV, and Czaplewski RL. 1998. “Design and Analysis for Thematic map Accuracy Assessment: Fundamental Principles.” Remote Sensing of Environment 64 (3): 331–344. [Google Scholar]
- Tansey K, Grégoire J, Defourny P, Leigh R, Pekel J, van Bogaert E, and Bartholomé E. 2008. “A new, Global, Multi-Annual (20002007) Burnt Area Product at 1 km Resolution.” Geophysical Research Letters 35 (1): L01401. doi: 10.1029/2007GL031567. [DOI] [Google Scholar]
- van der Werf GR, Morton DC, DeFries RS, Giglio L, Randerson JT, Collatz GJ, and Kasibhatla PS. 2009. “Estimates of Fire Emissions from an Active Deforestation Region in the Southern Amazon Based on Satellite Data and Biogeochemical Modelling.” Biogeosciences 6 (2): 235–249. [Google Scholar]
- van der Werf GR, Randerson JT, Giglio L, Collatz GJ, Kasibhatla PS, and Arellano AF Jr. 2006. “Interannual Variability in Global Biomass Burning Emissions from 1997 to 2004.” Atmospheric Chemistry and Physics 6 (11): 3423–3441. [Google Scholar]
- van der Werf GR, Randerson JT, Giglio L, Collatz GJ, Mu M, Kasibhatla PS, Morton DC, DeFries RS, Jin Y, and van Leeuwen TT. 2010. “Global Fire Emissions and the Contribution of Deforestation, Savanna, Forest, Agricultural, and Peat Fires (1997–2009).” Atmospheric Chemistry and Physics 10 (23): 11707–11735. [Google Scholar]
- van Leeuwen TT, and van der Werf GR. 2011. “Spatial and Temporal Variability in the Ratio of Trace Gases Emitted from Biomass Burning.” Atmospheric Chemistry and Physics 11 (8): 3611–3629. [Google Scholar]
- Yue C, Ciais P, Cadule P, Thonicke K, Archibald S, Poulter B, Hao WM, et al. 2014. “Modelling the Role of Fires in the Terrestrial Carbon Balance by Incorporating SPITFIRE into the Global Vegetation Model ORCHIDEE – Part 1: Simulating Historical Global Burned Area and Fire Regimes.” Geoscientific Model Development 7: 2747–2767. [Google Scholar]
- Yue C, Ciais P, Cadule P, Thonicke K, and Van Leeuwen TT. 2015. “Modelling the Role of Fires in the Terrestrial Carbon Balance by Incorporating SPITFIRE into the Global Vegetation Model ORCHIDEE – Part 2: Carbon Emissions and the Role of Fires in the Global Carbon Balance.” Geoscientific Model Development 8 (5): 1285–1297. [Google Scholar]
- Zhang YH, Wooster MJ, Tutubalina O, and Perry GLW. 2003. “Monthly Burned Area and Forest Fire Carbon Emission Estimates for the Russian Federation from SPOT VGT.” Remote Sensing of Environment 87 (1): 1–15. [Google Scholar]
Associated Data
This section collects any data citations, data availability statements, or supplementary materials included in this article.


