

Abstract
Extreme droughts have been recurrent in the Amazon over the past decades, causing socio-economic and environmental impacts. Here, we investigate the vulnerability of Amazonian forests, both undisturbed and human-modified, to repeated droughts. We defined vulnerability as a measure of (i) exposure, which is the degree to which these ecosystems were exposed to droughts, and (ii) its sensitivity, measured as the degree to which the drought has affected remote sensing-derived forest greenness. The exposure was calculated by assessing the meteorological drought, using the standardized precipitation index (SPI) and the maximum cumulative water deficit (MCWD), which is related to vegetation water stress, from 1981 to 2016. The sensitivity was assessed based on the enhanced vegetation index anomalies (AEVI), derived from the newly available Moderate Resolution Imaging Spectroradiometer (MODIS)/Multi-Angle Implementation of Atmospheric Correction algorithm (MAIAC) product, from 2003 to 2016, which is indicative of forest's photosynthetic capacity. We estimated that 46% of the Brazilian Amazon biome was under severe to extreme drought in 2015/2016 as measured by the SPI, compared with 16% and 8% for the 2009/2010 and 2004/2005 droughts, respectively. The most recent drought (2015/2016) affected the largest area since the drought of 1981. Droughts tend to increase the variance of the photosynthetic capacity of Amazonian forests as based on the minimum and maximum AEVI analysis. However, the area showing a reduction in photosynthetic capacity prevails in the signal, reaching more than 400 000 km2 of forests, four orders of magnitude larger than areas with AEVI enhancement. Moreover, the intensity of the negative AEVI steadily increased from 2005 to 2016. These results indicate that during the analysed period drought impacts were being exacerbated through time. Forests in the twenty-first century are becoming more vulnerable to droughts, with larger areas intensively and negatively responding to water shortage in the region.
This article is part of a discussion meeting issue ‘The impact of the 2015/2016 El Niño on the terrestrial tropical carbon cycle: patterns, mechanisms and implications’.
Keywords: vegetation index, MODIS/MAIAC, rainfall, Amazon region, impacts
1. Introduction
The stability of the carbon cycle in Amazonia depends on the resistance and resilience of these forests to the impacts of climatic extremes. The carbon sink of Amazonian forests has been dampened during and after each drought, through the decrease in photosynthesis and net primary productivity, the increase in tree mortality from the direct drought effect and by the impact of understory fires [1–4]. Meanwhile, the Amazon is becoming an increasingly human-modified forest system due to the continuous formation of forests fragments and forest edges, as a cumulative consequence of deforestation [5], the widespread occurrence of illegal logging, wildfires and the increase in the area of degraded and secondary forests. Worryingly, it is expected that these human-related processes will continue to affect the Amazon biome functioning in the future due to the on-going land cover and climatic changes, especially in Brazil.
The gross impact of land cover dynamics on carbon emissions can be partially compensated by the regrowth of secondary forests in pasturelands and agricultural fields following abandonment [6]. Secondary forests grow at fast rates and can accumulate in their biomass from 2.5 t C ha yr–1 to 4.5 t C ha yr–1 [7,8]. Ten-year-old forests are estimated to hold between approximately 30 t C ha–1 and 40 t C ha–1 in their biomass, reaching up to about 130 t C ha−1 after 20 years of regeneration [7,9,10]. Moreover, their net carbon sequestration rates can be as high as 20 times the rate of undisturbed forests [11]. Despite the potential for carbon sequestration by both degraded and secondary forests, their ability to cope with extreme droughts is still unknown.
Droughts have been impacting Amazonian forests at a recurrence rate of approximately 5 years [12]. The first documented widespread tree mortality event resulting from a drought was for the 2005 drought [13,14]. The 2005 drought caused persistent impacts on forest canopy, lasting for at least 4–5 years after the event [15]. Similarly, the 2010 drought has negatively affected tree growth rates in Amazonia [16]. However, there is a lack of extensive on-the-ground evidence about the cumulative effect of this drought in comparison to 2005. Biome-scale drought impacts on vegetation became evident because of recent advances in techniques for correction of atmospheric and sun-sensor geometry effects, inherent of satellite data, specifically the Multi-Angle Implementation of Atmospheric Correction algorithm (MAIAC) [17] applied to the Moderate Resolution Imaging Spectroradiometer (MODIS) data. The use of MAIAC-corrected reflectance data has provided a consistent evaluation of the widespread decrease in photosynthesis during the 2005 and 2010 droughts [18–20]. These results have been independently corroborated by using sun-induced chlorophyll fluorescence data derived from the Greenhouse gases Observing SATellite (GOSAT) and the Global Ozone Monitoring Experiment-2 (GOME-2) satellite measurements for the 2010 and 2015/16 droughts, respectively [21,22].
Field-based evidence has quantified a range of impacts of droughts on Amazonia forest structure and functioning. However, there is still a lack of understanding of how these forests respond to droughts spatially and temporally at a large spatial scale. Using a suite of readily available satellite data able to detect large-scale indicators of drought impacts on forests, in this study, we investigate the vulnerability of Amazonian tropical dense, degraded and secondary forests to droughts. Here vulnerability is defined as a measure of (i) exposure, which is the degree to which these ecosystems were exposed to droughts, and (ii) sensitivity, measured as the degree to which the drought has affected these forests [23]. The adaptive capacity, the third element that contributes to the full evaluation of the vulnerability, is discussed in this study based on the results from (i) and (ii) and the existing literature.
Specifically, we first assessed the exposure of these forests to extreme droughts by using two rainfall-derived indices, the standardized precipitation index (SPI) and the maximum cumulative water deficit (MCWD). Second, we assessed the sensitivity of the photosynthetic capacity of Amazonian forests to droughts by quantifying MODIS/MAIAC enhanced vegetation index anomalies (AEVI), which represents the deviation of EVI from the long-term mean value of the time-series. As droughts are likely to affect forests differently depending on the timing of the beginning of the dry season and its duration in specific regions, in this study both rainfall and vegetation indices were spatially stratified considering the beginning and duration of the dry season [19]. Most of the Amazonian drought impacts studies focus only on old-growth forests. Here, we take the opportunity to further explore the impacts on degraded and secondary forests.
2. Material and methods
Our study area encompasses the entire Brazilian Amazon biome, within the limits of the Brazilian Legal Amazon (figure 1a). This is a heterogeneous region, with different land uses and vegetation formations. The total forest cover in this biome was estimated to be 3 494 643 km2 in 2016 considering dense, degraded and secondary forests (MapBiomas, 2017; see http://mapbiomas.org/pages/downloads).
Figure 1.

Study area exhibiting the (a) stratification of regions according to the beginning and end (month in parenthesis) of the dry season: Feb, February; Mar, March; Aug, August; Sep, September; Nov, November; Dec, December, (b) forest cover in the Brazilian Amazon biome for the year 2015, (c) Brazilian Amazon states. The dry season length was defined based on the threshold of 100 mm rainfall per month.
(a). Rainfall data
We used the monthly precipitation data from the Climate Hazards Group InfraRed Precipitation with Station data (CHIRPS; [24]). CHIRPS is a relatively new rainfall product and is made available at daily to seasonal time scales with a spatial resolution of 0.05°, starting from 1981 onwards. This dataset integrates satellite imagery with in situ rain gauge station data to create gridded rainfall time series. This dataset has a good performance in several regions of the world [25–30]. For this study, we performed a validation of CHIRPS data using 24 ground stations over Amazonia. We show that the CHIRPS data explain 73% of the station data with a root mean square error below 15 mm per month (electronic supplementary material, figure S1). The time series used for this research covers the period spanning from January 1981 to December 2016.
To perform our analysis of exposure, we calculated two metrics computed from the CHIRPS dataset: (i) the SPI representing the meteorological drought, and (ii) the MCWD, as a proxy for the forest water stress.
The SPI is a drought index proposed by Mckee et al. [31] used to quantify the probability of occurrence of a precipitation deficit at a specific time scale. In this study, the time scale of 12 months was considered. To calculate the SPI we fitted the precipitation data to a gamma probability distribution function, and then used the inverse normal distribution function to rescale the probability values, resulting in SPI values with mean of zero and standard deviation of one. Thus, dry events were represented by SPI values falling below −1 for at least two consecutive months [32,33]. The drought event ends when the SPI values return to positive values. Therefore, the SPI defines the beginning, end, severity and intensity of the meteorological drought event. To define the drought's severity, the monthly SPI values were accumulated from the first to the last month of the drought event by summing the SPI values. The SPI scale for drought events is defined as: moderately dry from −1.0 to −1.49; severely dry from −1.5 to −1.99 and extremely dry when values are lower than −2 [34].
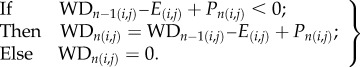
The CWD was calculated at the pixel level for the entire time-series, following the methodology proposed by Aragão et al. [35]. According to this study, the onset and duration of the dry season months were determined by using the approximation that moist tropical forests have a mean evapotranspiration (E) of 100 mm per month [36–38] (equation (2.1)). Therefore, when the monthly rainfall (P) for each month (n) is lower than this value, the forest enters into water deficit (WD). The MCWD was calculated by selecting the minimum value of the CWD reached for each pixel within the year (i,j). The drought periods analysed were 2004/2005, 2009/2010 and 2015/2016. The standardized anomalies (z-score) of the MCWD (AMCWD) were calculated by subtracting the mean MCWD climatology, covering from 1981 to 2016, and dividing by the standard deviation. The anomalies were then assessed based on their level of significance (p < 0.05).
 |
2.1 |
Therefore, droughts in this study correspond to a period of abnormally low rainfall, considering SPI and MCWD anomalies. The onset of the dry season was obtained from Moura et al. [19]. In their study, seven regions were identified. These regions present different onsets of the dry season, varying from January to September or no dry season (figure 1a). This dataset was used to assess the temporal patterns of the rainfall deficit in each region. Moreover, these regions were also used to assess the impact of droughts on the vegetation by using the AEVI.
(b). MODIS data: enhanced vegetation index and land surface temperature
The enhanced vegetation index (EVI) is a combination of the reflectance (ρ) in red, blue and near-infrared (NIR) bands [39], as in equation (2.2):
| 2.2 |
The EVI has been consistently correlated with Amazonian forests' photosynthetic capacity and canopy structure [20,40–43]. For this study, the MODIS multi-angle implementation of atmospheric correction (MAIAC) EVI was used due to its improved performance for monitoring drought impacts on Amazonian forests [19,20,44].
In order to correct for sun-sensor-target geometry effects inherent of the image acquisition process, the MODIS/MAIAC daily surface reflectance with 1 km spatial resolution [45,46] was normalized to an apparent view zenith angle of 0° (nadir-view) and a 45° solar zenith angle using a bidirectional reflectance distribution function (BRDF) and Ross-Thick Li-Sparse (RTLS) model [47]. The daily product was then aggregated to 16-day composites using the median values in order to create nearly cloud-free mosaics of the entire study area as well as to reduce short-term noise [45,46]. The month of December was excluded from all years of the analysis as more than 50% of the study area presented no cloud-free data during this month (electronic supplementary material, figure S2). We analysed data spanning from January 2003 to November 2016, and monthly mosaics were generated by using the median of the images within the month [19], filtering for noisy or no data values.
The standardized EVI anomaly (AEVI) was calculated for each month and for each year from 2003 to 2016, excluding the years of 2005, 2010, 2015 and 2016. The monthly anomaly was calculated by subtracting the month from its monthly average climatology, and dividing it by the month standard deviation climatology. In the literature, it has been shown that during anomalous droughts, the EVI presents both greening and browning signals [19,22,48], although the area and location of the forest affected varies depending on the data and methodology used. Here, we attempted to go one step further and assessed how these severe droughts affected the extremes of the EVI: minimum and maximum. To obtain the annual AEVI, we first calculated the minimum annual EVI, and the anomaly of the minimum EVI. Then, we calculated the maximum annual EVI, and the anomaly of the maximum annual EVI. Only significant anomalies (p < 0.05) were considered.
We first combined the AEVI with the land cover data (description below) in order to calculate the forested area affected by drought, according to the proportion of forest cover for each 1 km grid cell. Only pixels with 50% or more forest cover were assessed. Then, we explored the annual patterns of the minimum and maximum AEVI (p < 0.05). To explore the interaction between the AEVI and the MCWD, we estimated the median and standard deviation of the minimum AEVI in the areas affected by significant anomalous MCWD (p < 0.05). In order to investigate whether the recurrence of anomalous MCWD in a given region is associated with a greater impact on the forest, we calculated the median and standard deviation of the minimum AEVI, stratified by the number of recurrences of AMCWD. Finally, we explored the area of significant monthly AEVI stratified by forest type.
To support the interpretation of the results and discussion, we processed the land surface temperature (LST) derived from the MODIS MOD11A2 v006 product. We specifically used the 8-days daytime 1 km spatial resolution LST. Monthly composites were generated based on the mean LST value of all 8-days images within the month, filtering for noisy or no data values [49]. Then, the monthly anomalies were generated based on the maximum positive temperature anomalies. Finally, the maximum annual anomalies were generated. In this way, only abnormally high annual temperatures were captured.
All the analyses were carried out for the entire area and also per region, according to the onset and end of the dry season (figure 1).
(c). Vegetation types
Dense, degraded and secondary annual vegetation cover maps were based on the MapBiomas product, v. 2.0 (MapBiomas, 2017). The MapBiomas is a dataset that depicts annual land cover and land use dynamics in the Brazilian biomes. We focused our study uniquely on the Amazon biome. The dataset is based on the classification of Landsat images, with 30 m spatial resolution. Detailed information on the processing and validation of this dataset is provided in the Algorithm Theoretical Base Document and Result (MapBiomas, 2017). The overall accuracy of the maps provided by the MapBiomas for the Amazon biome is 82.7%. Among all land cover classes available in the product, we only consider three classes: (i) dense, (ii) degraded and (iii) secondary forests (figure 1b). In addition, a layer containing the sum of the forest types was created, named total forest.
The annual MapBiomas dataset was resampled to 1 km spatial resolution, by calculating the proportional coverage of each forest type in each grid cell. Only cells with 50% or more forest cover were analysed. The time series used covered the period from 2003 to 2015. The forest cover for the year 2016 was assumed to be the same as the one available for the year 2015, as the dataset was not available. In 2015 the dense, secondary and degraded forests covered 84%, 0.36% and 0.33% of the study area, respectively.
3. Results
(a). Exposure of Amazonian forests to droughts
The SPI indicates that during the 2015/16 drought, approximately 46% of the Brazilian Amazon biome was subjected to severe to extreme drought intensity levels, compared with 16% and 8% for the 2009/10 and 2004/05 droughts, respectively (figure 2a–c). While the 2004/05 and 2009/10 droughts had widely scattered spatial patterns of extremely dry regions, the 2015/16 drought had its epicentre in central Amazonia. The significant (p < 0.05) AMCWD, on the other hand, occurred over 14% and 10% of the study area during the 2015 and 2016 drought, respectively, while in 2005 and 2010 droughts the affected areas were 6.12% and 9.16%, respectively (electronic supplementary material, table S1). From 1981 to 2016, some regions in the Amazon biome have experienced up to five exposures to significant AMCWD, mainly in central north and western parts (electronic supplementary material, figure S4), with more than 1 million km2 affected once, 973000 km2 affected twice, over 300000 km2 affected three times and 35 400 km2 and 1400 km2 affected four and five times, respectively.
Figure 2.

Minimum standardized precipitation index (SPI), calculated based on the 12 months' time scale (a–c), and maximum cumulative water deficit anomaly (AMCWD) spatial patterns (d–f) of the years 2004/2005, 2009/2010 and 2015/2016, respectively. The anomalies (z-score) are expressed in standard deviation from the long term mean (1981–2016). n.s. is non-significant.
Spatially, the AMCWD showed clustered spatial patterns for the 2004/05, 2009/10 and 2015/16 droughts (see electronic supplementary material, figure S3 for the entire time-series AMCWD). The AMCWD epicentres of the 2004/05, 2009/10 and 2015/16 droughts were concentrated in the western, south and central-north portions of the Amazon biome, respectively (figure 2d–f). It is interesting to note that the north-western region, which has no dry season, showed changes in rainfall as depicted by both SPI and AMCWD metrics during 2009/10 and 2015/16. During both periods (2009/10 ad 2015/16), negative SPI and AMCWD metrics were also detected in the northern part of the biome, in the state of Roraima.
The SPI stratified by region showed that in terms of duration, the 2015/16 drought was the longest of the twenty-first century (figure 3), and thus the most severe. Since the year 2000, SPI-derived drought duration varied from 10 months in southern Amazonia (R02) up to 32 months in central-north Amazonia (region R07) (electronic supplementary material, table S2). The average SPI-derived drought duration among all regions reached 15 months, nine months and 6.5 months for the events spanning the years of 2015/16, 2009/10 and 2004/05, respectively.
Figure 3.

Temporal pattern of the standardized precipitation index (SPI), calculated based on the 12 months’ time scale, per region based on its dry season onset, from 1982 to 2016.
By considering the entire time series studied, the three longest SPI-derived drought events were located in northern Amazonia (region R02), which lasted 50 month, starting in March 1998; 32 months in northeast Amazonia (region R07) starting in July 2014 and 29 months in Northeast Amazonia (region R06), starting in January 1992. By dividing the number of months under the SPI-derived drought by the total number of months during the years analysed, we estimated that during the pre-2000 period, at least one region in Amazonia experienced SPI values below −1 every 1.5 months, compared to 0.6 months post-2000. In terms of drought severity, as measured by the cumulative SPI values, and by averaging all regions, SPI value during the pre-2000 period was −21.44 and for the droughts that started post-2000, the SPI value was −13.04. This is likely to be driven by the 1992 and 1998 droughts (figure 3).
It is interesting to note two contrasting patterns: while during pre-2000, 12.7% of the months presented SPI values higher than 1 (moderately to extremely wet months), post-2000 this number increased to 16.8%. Contrarily, for moderately to extremely dry months (SPI values lower than −1), the first period presented 21.5% of the months under dry events and in the latter period this number decreased to 9.1% of the months. The regions with the highest increase in months ranging from moderate to extreme wet were located in the northeast (R07) and northeast/north regions (R05, R02). On the other hand, the regions with the highest decrease in number of months moderately to extreme dry (months with SPI lower than –1) were located in central and north regions (R06, R04, R01) (electronic supplementary material, table S3).
At the biome-scale, during August 2015 the rainfall decreased below the 100 mm threshold, which persisted until January 2016, indicating a six-month prolonged water deficit when comparing to 2005 with four months (August to November water deficit) and 2010 with three months (August to October water deficit) (electronic supplementary material, figure S5). When stratifying the CWD for each region, we observed three distinctive patterns of drought recurrence and/or intensification over the years (electronic supplementary material, figure S6). During 2015/16 drought, the region with no dry season (R01) experienced for the first time since 1981 a water deficit lower than −50 mm, starting in September up to February. Second, in the north region (R02), the CWD reached its lowest values for four consecutive months during the 2015/16 drought. This was the longest drought in this region. In the southern region (R03), values of CWD below −100 mm, which usually occurs in June, were advanced to May in both the 2010 and 2015 droughts. Additionally, in this region, we observed an increased number of months with CWD lower than −200 mm after year 2000, and an even higher increase for extremely low values (less than −300 mm) when compared with the pre-2000 period (electronic supplementary material, table S4). Interestingly, we also observed in this region an intensification of high rainfall events after 2010, during the wet season (electronic supplementary material, figure S7). These results indicate an intensification of the variance in rainfall patterns.
(b). Sensitivity of Amazonian forests to droughts
(i). Intensity of EVI anomalies
By analysing the anomalies of minimum and maximum EVI (figure 4; electronic supplementary material, figure S8, respectively), we identified peaks in 2005, 2007, 2010, 2015 and 2016. First, while areas with significant minimum AEVI reached more than 600 000 km2, areas with positive AEVI corresponded to less than 140 km2. Despite this disproportionate area affected, this result indicated that during drought years the variance of EVI values increases, with extremely high or low EVI superseding other years. Second, there was also a progressive increase in the intensity of the affected areas from 2005 to 2016, given by the increase in the area with EVI anomalies lower than −3σ and −4σ. From 2015 to 2016, there was an increase in the intensity of the negative anomalies, and we observed a 2-year long drought effect in the forest. The exception is the year 2007, when minimum values did not go beyond −2.75 σ.
Figure 4.

Anomalies of minimum EVI values for the entire forest area, and per region. Only significant values (p < 0.05) were assessed. The line colours and values indicate the anomalies (z-score) expressed in standard deviation from the long-term mean (2003–2016).
This same pattern is observed for all seven regions (figure 4). However, northwest and south regions of the Amazon presented larger affected areas. It is interesting to note that the region R01, which has no dry season, was exposed to significant AMCWD during 2015/16.
The year 2007 did not present any major indicator of droughts, according to the SPI (figure 3) and AMCWD (electronic supplementary material, figure S3). Thus, one could expect that the other mechanism leading to the increase in the minimum AEVI during this year would be the anomalous high temperatures, which would lead to high atmospheric demand. However, this also did not show any strong anomalies (electronic supplementary material, figure S8).
(ii). Interaction between droughts and EVI anomalies
By assessing the median and standard deviation of minimum AEVI over the areas with significant AMCWD, we observed peaks in both metrics during the drought years, especially during 2010, 2015 and 2016 (figure 5a). This indicates that areas significantly affected by droughts, given by AMCWD, have not only lower AEVI, but also a higher variability of the minimum AEVI. We also found that some regions have been hit up to five times by recurrent significant AMCWD from 1981 to 2016 (electronic supplementary material, figure S4). The evaluation of the AEVI revealed that areas affected only once by AMCWD have higher AEVI values than areas affected twice or more, although this was non-significant (p < 0.05) (figure 5b).
Figure 5.

(a) Median and standard deviation of minimum anomalies in the EVI (AEVI) in areas with significant anomaly in the maximum cumulative water deficit (AMCWD). (b) Median and standard deviation of minimum anomalies in the EVI (AEVI) in areas with recurrences of significant anomaly in the maximum cumulative water deficit (AMCWD). Only significant anomalies were assessed (p < 0.05).
(iii). Spatial and temporal patterns of affected forests
Significant negative anomalies of minimum EVI appeared along the entire time-series (electronic supplementary material, figure S10). However, forest areas affected more intensively (lower negative anomalies) emerged in 2005, 2010, 2015 and 2016 (figure 6). Although most of the entire area exhibited negative AEVI, we observed spatially clustered areas in southwest Amazonia in 2005 and in central Amazonia in 2010 from north to south. During 2015 and 2016, there was an intensification of the affected areas, with a widespread negative AEVI. Some areas are of particular interest due to a dense cluster of affected forests: (i) in central Acre state, (ii) southern Mato Grosso, in the Xingú Indigenous reserve, (iii) an extensive area along the Solimões river, spreading from the border with Colombia up to the central part of the Amazonas state, near Manaus, (iv) southern forests of Roraima state, (v) the area surrounding the Tapajós National Forest and the remaining forests of eastern Amazonia, in the Maranhão state. Among the other years, 2007 presented negative AEVI regions from the southeast to the northwest (electronic supplementary material, figure S10).
Figure 6.

Enhanced vegetation index minimum anomalies maps for the four droughts assessed: 2005, 2010, 2015 and 2016.
Monthly AEVI revealed that in the dense forest, larger areas were impacted at the end of the dry season and beginning of the wet season, from July to October, particularly in 2010 and 2016 (figure 7a). The peaks in drought-affected area for secondary and degraded forests also occurred from July to November mostly during the drought years (figure 7a). However, small portions of degraded forests also exhibited anomalies during other months and years. This result indicates that other processes such as anthropic actions are permanently impacting these forests. The persistence of AEVI throughout the year and in non-drought years indicates that these forests are experiencing constant and multiple pressures. By assessing the total monthly affected areas for the three forest classes, we observed that 2010 was the year with the highest area (more than 30% of the total area) of affected dense forests. Similar proportions of affected areas were observed for secondary and degraded forests. During both 2015 and 2016, over 20% of these forests exhibited a decrease in the photosynthetic capacity (figure 7b).
Figure 7.

(a) Significant negative EVI anomalies (AEVI) (p < 0.05) indicating the months of peak of the affected area within each forest type. The colour scale ranges from area not affected (dark colours) to the maximum area affected (bright colours). (b) Proportion of the total area affected, measured by the significant negative EVI anomalies (AEVI) (p < 0.05) per year.
4. Discussion
(a). Long-term drought exposure
Each severe drought that affected the region presented a different spatial arrangement across the Brazilian Amazon. We observed that for 2005 the western part was the epicentre of the drought. The most affected areas in 2010 occurred in the southern and northern flanks of the region, whereas in 2015/16 the drought was concentrated in central Amazon. The western Brazilian Amazon as well as the north part of Acre state were affected during the three most recent events. Our results indicate that the largest area affected by drought recorded in our dataset occurred during the most recent drought (2015/2016). However, when analysing the results by regions, we showed that droughts are constantly hitting Amazonia in different places and approximately 20% of the biome has been hit more than once. For instance, MCWD anomalies per region were significant in 1992 in northern Amazonia (R02) and in central Amazonia in 1997/98 (regions R04, R05, R06). Moreover, the MCWD anomaly in region R06, corresponding to Eastern Amazonia, was significant in 2015, and in the other areas, marginally significant in 2015/16 (electronic supplementary material, figure S11). In the north and northeast flanks of the Amazon, the CWD annual mean was lower than the long-term average for two to three years, covering 2014 to 2016. Interestingly, during the 2015/16 drought in eastern Amazonia (region R06), we observed for the first time ever in the time series analysed a region with more than six months of CWD below −100 mm per month. This same pattern was observed in region 4, central Amazonia, during the 1997/98 El Niño (electronic supplementary material, figure S11).
Based on the time-series analysed in this study, the results indicate that the north and northeast regions of the Amazon are becoming wetter (regions R02, R05 and R07). Gloor et al. [50] have observed an intensification of the hydrological cycle concentrated in the wet season; however, the epicentre for the region is located further west, outside the Brazilian Amazon, a region not contemplated in this study. Nonetheless, it is possible that the central to northeast regions are experiencing the same phenomena.
In the southern part of the Amazon (Mato Grosso state, region R03) the number of months with cumulative water deficit (CWD) lower than −300 mm increased after the year 2000 (29 events pre 2000 to 41 events post 2000), thus becoming increasingly exposed to droughts. However, unexpectedly, the wet season (February to March) in this region seems to be receiving more rain. This clearly shows that the dry season in southern Amazonia is strengthening and potentially advancing into the end of the wet season, while the rainy season is becoming wetter.
Some studies suggest that the Amazon may be experiencing higher frequency and more intense droughts [51] and modelling scenarios indicate an increase in the negative trend in the mean annual precipitation in north and eastern parts of the Amazon [52]. These results are not supported by the observed long-term patterns and tendencies of the mentioned regions as reported in this study. However, in southern Amazonia, the increase of dry and very dry events is in accordance with Marengo et al. [53] and Spinoni et al. [32]. At least in southern Amazonia, the increase of extremes seems to be already occurring.
By dividing the severity of the events by their duration, we observed that the pre-2000 droughts were shorter and more severe than post-2000. After the year 2000, droughts were either shorter or longer than pre-2000, but certainly less severe. For example, the most severe and shorter events in central-east Amazonia occurred in the early 1980s. Conversely, in both northwest (region 01) and southern Amazonia (region 03), the 2015/16 drought was the most severe and shortest since 1981. It is interesting the north-eastern Amazonia (Amapá state, region R07), closer to the Atlantic Ocean, the 2015/16 drought was the most intense and longest in the time-series analysed. Also, in this region, climate seems to be becoming wetter given the number of months with positive SPI from 2002 onwards (figure 3). This result contrasts with the projection of dryer years for this area, suggested by Duffy et al. [52]. The difference reported here could be due to our approach, which has stratified the Amazon in regions based on the beginning of the dry season, rather than analysing the entire area as a single region, and possibly to the different rainfall dataset used.
(b). Sensitivity of Amazonian forests to droughts
Based on the negative anomalies of the minimum enhanced vegetation index (AEVI), which indicates forests under stress, we confirmed that Amazonian forests are sensitive to droughts. Moreover, the intensity (lower values) and the area affected by negative anomalies increased from 2005 to 2016. Despite some remote sensing-based studies reported greening of some regions in Amazonia during extreme drought years [22,48,54], areas with negative impacts were much larger than positive impacts in 2005 [48] and even greater areas were affected during the 2010 drought [19,55]. Moreover, in this study, we quantified that the positive anomalies calculated based on the maximum EVI occurred in areas with no more than 140 km2. MODIS-derived vegetation indices in the Amazon have been associated with the reduction of photosynthetic capacity during drought years [55], tree mortality [56], change in forest structure [57] or even the opposite effect, by relating to the increase in vegetation index with observed leaf flushing [58]. It is interesting to note that Yang et al. [22] observed larger areas with positive EVI anomaly than with negative EVI anomaly for 2015/16. Despite using the MODIS EVI MAIAC, also used in this study, the results are contrasting. There are three possibilities for this discrepancy. First, it refers to the time-series adopted by Yang et al. [22], which spans from 2007 to 2016, while we used data from 2003 to 2016, thus covering the 2005 and 2010 droughts. Second, we assessed the extreme anomalies by first calculating the minimum and maximum annual EVI, while Yang et al. [22] used monthly data from August 2015 to July 2016 and compared with the 9-year average from August 2007 to July 2016. Finally, while Yang et al. [22] considered positive or negative anomalies values higher or lower than 1 or −1 standard deviation, in our study only significant values (p < 0.05) were accounted for, thus more conservative. It is remarkable to note that despite the differences in methodologies, contrasting results were captured by the same dataset and variable, the MAIAC-EVI. Nonetheless, the solar-induced chlorophyll fluorescence (SIF) assessed by Yang et al. [22] showed a significant decrease during the 2015/16 drought. Moreover, it has been demonstrated that SIF and EVI are highly correlated [59], which supports our findings.
A visual inspection of the 2015/16 AEVI in the region of the Tapajós National Forest (Pará state) demonstrated anomalous significant negative values (figure 6). This feature is associated with major wildfires in this area, as observed in high-resolution satellite observations and also reported in local news (http://www.oeco.org.br/reportagens/incendios-na-regiao-de-santarem-em-2015-degradaram-74-mil-km2/). We also detected an area with strong significant negative AEVI in western Amazonia, Acre state during the 2015/16 drought. This feature is linked to widespread mortality of bamboo forests, associated with its natural life cycle [60] (figure 6). Therefore, although drought-affected forest areas detected by the AEVI are not validated with field measurements, we are confident that our AEVI results can describe extensive impacts on photosynthesis and on canopy structure, including tree mortality [40,42,56]. Part of this response can also be associated with drought-related disturbances, such as wildfires.
Atmospheric inversion modelling showed a decrease in CO2 uptake during the 2010 drought compared to 2011 in Amazonia [2], and field observations demonstrated that at both leaf-level and plot-level, the drought suppresses photosynthesis [61] and forest productivity [13,16]. Plots located in the humid dense forests increased leaf fall during the 2010 drought, and in the following year there was a preferential carbon allocation towards the canopy [61]. Moreover, during the 2010 drought, trees under the areas of intense rainfall anomalies had lower growth rate [16].
In all regions and among dense, degraded and secondary forests we observed a peak in negative AEVI and with larger areas during the 2005, 2010 and 2015/2016 droughts. Doughty et al. [61] reported that in 2011, 1 year after the 2010 drought, the photosynthesis of old-growth forests returned to normal. However, contrary to the 2005 and 2010 droughts, we observed prolonged negative AEVI, lasting for 2015 and 2016, which could be associated with long-term structural changes in the canopy. Uriarte et al. [62] observed that in secondary forests, high water stress reduced large tree growth but favoured growth of small trees. Moreover, plants with high specific leaf area magnified the negative effect. They also observed that droughts reduced tree survival for both large and small trees. In our study, secondary forests do exhibit a larger affected area (AEVI p < 0.05) during drought years. The remote sensing signal observed in our study is in agreement with their field observations, and is associated with the canopy of the trees, thus the large trees. The enhanced growth of small trees under drier conditions would not be revealed by our data.
(c). Adaptive capacity of Amazonian forests to droughts
Drought impacts on Amazonian forests have prolonged effects. After the 2005 drought, changes in canopy structure and water content were detected based on the reduction of backscattering signal retrieved by the QuickSCAT satellite [15]. These changes, associated mainly with forest upper canopy, were observed for at least 4–5 years after the drought, when the satellite was decommissioned [15]. It has been suggested that the 2010 drought was more severe, with its impacts on forests persisting from October to December 2010, when compared with the 2005 drought [55]. In our study, we observed a progressive increase in the minimum AEVI, from 2005 to 2016, thus reflecting an increased intensity of the affected forest, and also in the affected area (figure 4). Perhaps the situation is even more critical. Hilker et al. [44] have observed that since 2000 there was a satellite-observed widespread decline in the normalized difference vegetation index (NDVI) in the Amazon, which could be linked to the previous droughts. Field studies that have reported increased tree mortality after the 2005 and 2010 droughts [13,16] and long-term decline of forest productivity [14] could also have captured forest responses and dynamics related to the pre-2000 droughts. A reduced rate of recovery (slowing down) of forests with a decrease in rainfall [63] has also been observed, at the tropical scale and specifically in the Amazon, potentially indicating the loss of resilience of these forests.
Tree mortally is probably the main consequence of drought that can cause a pervasive and persistent change in forest structure, composition and dynamics. Doughty et al. [64] observed an increase in individual tree mortality rate of 6.7% per year after the 2010 drought in a south-western Amazonia site (MCWD anomaly < −241 mm) and 3.6% per year in a western Amazon site (MCWD anomaly less than −51 mm). In our study, with the exception of region R01 in northwest Amazonia, where there is no dry season, all regions presented since 1981 from 3 to 13 years with MCWD anomaly lower than −241 mm, although not in consecutive years; and after the year 2000, from 2 to 5 years (electronic supplementary material, figure S12). It is remarkable that during 2015/16, two regions—North (Region R02) and Northeast (Region R07) Amazon—presented persistent MCWD anomaly lower than −241 mm in consecutive years. During the 2010 drought, eastern parts of the Amazon were not affected, and Doughty et al. [64] did not find a significant increase in tree mortality at the Caxiuanã site (n = 6 plots) in eastern Amazonia. However, in this study, we observed that in 2015, the MCWD anomaly was lower than −577 mm, which may be expected to drive tree mortality in this area. In six regions of this study, the MCWD anomaly in 2015 or 2016 (and in one region for both years) was lower than in 2005, when a widespread event of tree mortality was recorded for the Amazon [13]. Feldpausch et al. [16] associated a basin-wide impact of the 2010 drought on tree growth rates across Amazonia related to a moisture deficit (δW, z-score <−1.6). By calculating the water deficit using the same method as Feldpausch et al. [16], we observed that with the exception of region R07, all regions experienced from one to three times significant negative anomalies. Southern Amazonia (region R03 in 2010) and central-east Amazonia (regions R05 and R06, both in 2015) are the identified regions that have experienced δW <−1.6 after the year 2000. Therefore, it is expected that the 2015/16 drought had a widespread impact on tree mortality, including regions not affected by the 2005 and 2010 droughts, such as the eastern Amazonia.
So far, most studies have associated drought impacts on degraded forests with increasing forest vulnerability to wildfires [10,65–68]. However, little is known about drought impacts on both degraded and secondary forests in terms of tree mortality, net carbon exchange and photosynthetic capacity [69]. In this study, we estimated a significant negative AEVI for both these forest types for this century's drought́s and for 2007 (figure 7), but the impacts on the above-ground live biomass and productivity are open questions. We acknowledge that the signal of secondary forests is less clear due to small sizes of forest patches: even by using only pixels with more than 50% of secondary forest cover, and for smaller patches, the drought effects are not quantified in this study.
An integrated analysis of the AEVI with the areas affected by AMCWD suggests that drought areas have a negative effect on the forest, depicted by the decrease in the median of minimum AEVI. Moreover, although non-significant, there is a decrease in the median of minimum AEVI in areas with higher numbers of drought recurrences, given by significant AMCWD. Field data also do not report evidence for the hypothesis that repeated droughts could lead to an enhanced impact on tree mortality [16]. However, with the improved drought analysis performed in this study, we suggest that future field-based assessments to quantify forest drought impacts should be designed to cover areas affected by two or more significant years with negative AMCWD.
5. Conclusion
The exposure of Amazonian forests to droughts was remarkable during 1983, 1997, 2015 and 2016, where 10% or more of the area presented significant negative anomalies of the MCWD: 20.5%, 16.8%, 14% and 10%, respectively. More than 1 million km2 (40%) of the area was affected at least once by anomalous negative MCWD and more than 300 000 km2 were affected three times, an area about the size of Germany. According to the SPI, a meteorological drought index, after the year 2000 there was an increase in the number of extremely wet months and decrease in the number of dry events. Values below the CWD threshold of −200 mm have increased in southern Amazonia in the past 18 years, but also there was an intensification of rainfall during the rainy season in this region. North and southern parts of the Amazon have been experiencing an increase in rainfall extremes, and in eastern Amazonia, higher rainfall has been observed since 1981. Also, the dry season in southern Amazonia is getting drier. In central areas, droughts detected during this century did not appear to be either more intense or longer than twentieth-century droughts. The exception from this pattern is the 2015/16 drought in the northeast of the basin, which according to our results was one of the strongest droughts on record.
Analysed droughts affected Amazonian forest by increasing its photosynthetic capacity variability, measured by the minimum and maximum EVI anomalies. However, the area affected negatively, which indicates a decrease in the photosynthetic capacity and change in the canopy structure, prevails in the signal. Moreover, each subsequent drought has a more intense effect on the canopy over larger forest areas. Dense forests exhibit a dominance of drought-affected canopies occurring towards the end of the dry season/beginning of the wet season in the four droughts studied, but peaked in 2010 and 2015. On the other hand, secondary and degraded forests exhibited a dominance of drought-affected canopies during longer periods. Moreover, degraded forests also exhibited affected areas in non-drought years, possibly indicating other disturbances, such as fires and logging.
The year 2007 presents an intriguing pattern of significant minimum EVI anomalies, but we found no evidence that this could be associated with AMCWD or with abnormally high temperatures. We suggest that this should be further explored in the future.
Most of the studies that have linked rainfall anomalies, water deficit and cumulative water deficit with tree mortality or productivity have relied on the TRMM dataset, which starts collecting data in 1998. In this study, we observed that during the pre-2000 period, the Amazon was exposed to droughts, in different regions. Therefore, by analyzing this longer rainfall time-series, our study highlights possible regions for setting new field plots in order to assess the impacts of recurrent droughts on Amazonia's carbon cycle.
Supplementary Material
Acknowledgements
All authors thank Magog Araujo de Carvalho for his support in preparing the dataset.
Data accessibility
Rainfall: Climate Hazards Group InfraRed Precipitation with Station data (CHIRPS): doi:10.1038/sdata.2015.66. MODIS Multi-Angle Implementation of Atmospheric Correction (MAIAC). Enhanced Vegetation Index (EVI): doi.wiley.com/10.1029/2010JD014986 and doi.wiley.com/10.1029/2010JD014985. MODIS Land Surface Temperature (LST) MODIS MOD11A2 v006: 10.5067/MODIS/MOD11A2.006. Land cover maps—MapBiomas product: http://mapbiomas.org/pages/downloads. TRMM dataset: Tropical Rainfall Measuring Mission (TRMM) (2011), TRMM (TMPA/3B43) Rainfall Estimate L3 1 month 0.25 degree × 0.25 degree V7, Greenbelt, MD, Goddard Earth Sciences Data and Information Services Center (GES DISC). (doi:10.5067/TRMM/TMPA/MONTH/7) Accessed: 17/09/2018.
Authors' contributions
L.O.A., G.R.N., A.P.C. and L.E.O.C.A. designed the study. L.O.A., G.R.N. and A.P.C. performed the data analysis. L.O.A., G.R.N., A.P.C., L.E.O.C.A., Y.M.M, M.G.F., R.D. and F.H.W. interpreted the results. L.O.A. and L.E.O.C.A. wrote the manuscript, with input from all authors.
Competing interests
We have no competing interests.
Funding
L.O.A. and L.E.O.C.A. thank the Brazilian National Council for Scientific and Technological Development (CNPQ) for the productivity scholarship, grant nos. 309247/2016-0 and 305054/2016-3, respectively and the São Paulo Research Foundation (FAPESP) grant no. 16/02018-2. F.H.W. has been funded by FAPESP (process number 15/50484-0 and 16/17652-9). M.G.F. was supported by the Coordination of Training of Higher Education Personnel (CAPES) through a postdoctoral fellowship. Y.M.M. was supported by the Royal Society (NF170036) through a Newton International Fellowship. R.D. has been funded by FAPESP (grant nos. 2015/22987-7 and 2017/15257-8).
References
- 1.Brando PM, et al. 2014. Abrupt increases in Amazonian tree mortality due to drought–fire interactions. Proc. Natl Acad. Sci. USA 111, 6347–6352. ( 10.1073/pnas.1305499111) [DOI] [PMC free article] [PubMed] [Google Scholar]
- 2.Gatti LV, et al. 2014. Drought sensitivity of Amazonian carbon balance revealed by atmospheric measurements. Nature 506, 76–80. ( 10.1038/nature12957) [DOI] [PubMed] [Google Scholar]
- 3.Bonal D, Burban B, Stahl C, Wagner F, Hérault B. 2016. The response of tropical rainforests to drought—lessons from recent research and future prospects. Ann. For. Sci. 73, 27–44. ( 10.1007/s13595-015-0522-5) [DOI] [PMC free article] [PubMed] [Google Scholar]
- 4.Aragão LEOC, et al. 2018. 21st century drought-related fires counteract the decline of Amazon deforestation carbon emissions. Nat. Commun. 9, 536 ( 10.1038/s41467-017-02771-y) [DOI] [PMC free article] [PubMed] [Google Scholar]
- 5.Vedovato LB, Fonseca MG, Arai E, Anderson LO, Aragão LEOC. 2016. The extent of 2014 forest fragmentation in the Brazilian Amazon. Reg. Environ. Chang. 16, 2485–2490. ( 10.1007/s10113-016-1067-3) [DOI] [Google Scholar]
- 6.Hansen MC, et al. 2013. High-resolution global maps of 21st-century forest cover change. Science 342, 850–853. ( 10.1126/science.1244693) [DOI] [PubMed] [Google Scholar]
- 7.Fearnside PM. 1996. Amazonian deforestation and global warming: carbon stocks in vegetation replacing Brazil's Amazon forest. For. Ecol. Manage. 80, 21–34. ( 10.1016/0378-1127(95)03647-4) [DOI] [Google Scholar]
- 8.Nelson RF, Kimes DS, Salas WA, Routhier M. 2000. Secondary forest age and tropical forest biomass estimation using thematic mapper imagery single-year tropical forest age classes, a surrogate for standing biomass, cannot be reliably identified using single-date tm imagery. Bioscience 50, 419–431. ( 10.1641/0006-3568(2000)050%5B0419:SFAATF%5D2.0.CO;2) [DOI] [Google Scholar]
- 9.Asner GP, et al. 2010. High-resolution forest carbon stocks and emissions in the Amazon. Proc. Natl Acad. Sci. USA 107, 16 738–16 742. ( 10.1073/pnas.1004875107) [DOI] [PMC free article] [PubMed] [Google Scholar]
- 10.Berenguer E, et al. 2014. A large-scale field assessment of carbon stocks in human-modified tropical forests. Glob. Chang. Biol. 20, 3713–3726. ( 10.1111/gcb.12627) [DOI] [PubMed] [Google Scholar]
- 11.Pan Y, et al. 2011. A large and persistent carbon sink in the world's forests. Science 333, 988–993. ( 10.1126/science.1201609) [DOI] [PubMed] [Google Scholar]
- 12.Panisset JS, Libonati R, Gouveia CMP, Machado-Silva F, França DA, França JRA, Peres LF. 2018. Contrasting patterns of the extreme drought episodes of 2005, 2010 and 2015 in the Amazon Basin. Int. J. Climatol. 38, 1096–1104. ( 10.1002/joc.5224) [DOI] [Google Scholar]
- 13.Phillips OL, et al. 2009. Drought sensitivity of the Amazon rainforest. Science 323, 1344–1347. ( 10.1126/science.1164033) [DOI] [PubMed] [Google Scholar]
- 14.Brienen RJW, et al. 2015. Long-term decline of the Amazon carbon sink. Nature 519, 344–348. ( 10.1038/nature14283) [DOI] [PubMed] [Google Scholar]
- 15.Saatchi S, et al. 2013. Persistent effects of a severe drought on Amazonian forest canopy. Proc. Natl Acad. Sci. USA 110, 565–570. ( 10.1073/pnas.1204651110) [DOI] [PMC free article] [PubMed] [Google Scholar]
- 16.Feldpausch TR, et al. 2016. Amazon forest response to repeated droughts. Global Biogeochem. Cycles 30, 964–982. ( 10.1002/2015GB005133) [DOI] [Google Scholar]
- 17.Lyapustin, et al. 2012. Multi-angle implementation of atmospheric correction for MODIS (MAIAC): 3. Atmospheric correction. Remote Sens Environ. 127, 385–393. ( 10.1016/j.rse.2012.09.002) [DOI] [Google Scholar]
- 18.Hilker T, Lyapustin AI, Tucker CJ, Sellers PJ, Hall FG, Wang Y. 2012. Remote sensing of tropical ecosystems: atmospheric correction and cloud masking matter. Remote Sens. Environ. 127, 370–384. ( 10.1016/j.rse.2012.08.035) [DOI] [Google Scholar]
- 19.Moura YM, et al. 2015. Seasonality and drought effects of Amazonian forests observed from multi-angle satellite data. Remote Sens. Environ. 171, 278–290. ( 10.1016/j.rse.2015.10.015) [DOI] [Google Scholar]
- 20.Bi J, Myneni R, Lyapustin A, Wang Y, Park T, Chi C, Yan K, Knyazikhin Y. 2016. Amazon forests' response to droughts: a perspective from the MAIAC product. Remote Sens. 8, 356 ( 10.3390/rs8040356) [DOI] [Google Scholar]
- 21.Lee J-E, et al. 2013. Forest productivity and water stress in Amazonia: observations from GOSAT chlorophyll fluorescence. Proc. R. Soc. B 280, 20130171 ( 10.1098/rspb.2013.0171) [DOI] [PMC free article] [PubMed] [Google Scholar]
- 22.Yang J, Tian H, Pan S, Chen G, Zhang B, Dangal S. 2018. Amazon drought and forest response: largely reduced forest photosynthesis but slightly increased canopy greenness during the extreme drought of 2015/2016. Glob. Chang. Biol. 24, 1919–1934. ( 10.1111/gcb.14056) [DOI] [PubMed] [Google Scholar]
- 23.Mumby PJ, Chollett I, Bozec Y-M, Wolff NH. 2014. Ecological resilience, robustness and vulnerability: how do these concepts benefit ecosystem management? Curr. Opin. Environ. Sustain. 7, 22–27. ( 10.1016/j.cosust.2013.11.021) [DOI] [Google Scholar]
- 24.Funk C, et al. 2015. The climate hazards infrared precipitation with stations—a new environmental record for monitoring extremes. Sci Data 2, 150066 ( 10.1038/sdata.2015.66) [DOI] [PMC free article] [PubMed] [Google Scholar]
- 25.Lopez-Carr D, et al. 2015. A spatial analysis of climate-related child malnutrition in the Lake Victoria Basin. In IEEE International Geoscience and Remote Sensing Symposium (IGARSS), Milan, Italy, 26–31 July 2015, pp. 2564–2567. ( 10.1109/IGARSS.2015.7326335) [DOI] [Google Scholar]
- 26.Duan Z, Liu J, Tuo Y, Chiogna G, Disse M. 2016. Evaluation of eight high spatial resolution gridded precipitation products in Adige Basin (Italy) at multiple temporal and spatial scales. Sci. Total Environ. 573, 1536–1553. ( 10.1016/j.scitotenv.2016.08.213) [DOI] [PubMed] [Google Scholar]
- 27.Katsanos D, Retalis A, Michaelides S. 2016. Validation of a high-resolution precipitation database (CHIRPS) over Cyprus for a 30-year period. Atmos. Res. 169, 459–464. ( 10.1016/j.atmosres.2015.05.015) [DOI] [Google Scholar]
- 28.Verdin A, Funk C, Rajagopalan B, Kleiber W. 2016. Kriging and local polynomial methods for blending satellite-derived and gauge precipitation estimates to support hydrologic early warning systems. IEEE Trans. Geosci. Remote Sens. 54, 2552–2562. ( 10.1109/TGRS.2015.2502956) [DOI] [Google Scholar]
- 29.Perdigón-Morales J, Romero-Centeno R, Pérez PO, Barrett BS. 2018. The midsummer drought in Mexico: perspectives on duration and intensity from the CHIRPS precipitation database. Int. J. Climatol. 38, 2174–2186. ( 10.1002/joc.5322) [DOI] [Google Scholar]
- 30.Correa WS, Paiva RCD, Espinoza JC, Collischonn W. 2017. Multi-decadal hydrological retrospective: case study of Amazon floods and droughts. J. Hydrol. 549, 667–684. ( 10.1016/j.jhydrol.2017.04.019) [DOI] [Google Scholar]
- 31.Mckee T, Doesken N, Kleist J. 1993. The relationship of drought frequency and duration to time scales. Proceedings of the Eighth Conference on Applied Climatology, pp. 179–184. Anaheim, CA: American Meteorological Society.
- 32.Spinoni J, Naumann G, Carrao H, Barbosa P, Vogt J. 2014. World drought frequency, duration, and severity for 1951–2010. Int. J. Climatol. 34, 2792–2804. ( 10.1002/joc.3875) [DOI] [Google Scholar]
- 33.Spinoni J, Naumann G, Vogt J, Barbosa P. 2015. European drought climatologies and trends based on a multi-indicator approach. Glob. Planet Change 127, 50–57. ( 10.1016/J.GLOPLACHA.2015.01.012) [DOI] [Google Scholar]
- 34.WMO. 2012. Standardized Precipitation Index User Guide. See http://www.wamis.org/agm/pubs/SPI/WMO_1090_EN.pdf.
- 35.Aragão LEOC, Malhi Y, Roman-Cuesta RM, Saatchi S, Anderson LO, Shimabukuro YE. 2007. Spatial patterns and fire response of recent Amazonian droughts. Geophys. Res. Lett. 34, L07701 ( 10.1029/2006GL028946) [DOI] [Google Scholar]
- 36.Shuttleworth WJ, Leuning R, Black TA, Grace J, Jarvis PG, Roberts J, Jones HG. 1989. Micrometeorology of temperate and tropical forest [and discussion]. Phil. Trans. R. Soc. B. 324, 299–334. ( 10.1098/rstb.1989.0050) [DOI] [Google Scholar]
- 37.Da Rocha HR, et al. 2004. Seasonality of water and heat fluxes over a tropical forest in eastern Amazonia. Ecol. Appl. 14, 22–32. ( 10.1890/02-6001) [DOI] [Google Scholar]
- 38.von Randow C, et al. 2004. Comparative measurements and seasonal variations in energy and carbon exchange over forest and pasture in South West Amazonia. Theor. Appl. Climatol. 78, 5–26. ( 10.1007/s00704-004-0041-z) [DOI] [Google Scholar]
- 39.Huete A, Didan K, Miura T, Rodriguez E, Gao X, Ferreira L. 2002. Overview of the radiometric and biophysical performance of the MODIS vegetation indices. Remote Sens. Environ. 83, 195–213. ( 10.1016/S0034-4257(02)00096-2) [DOI] [Google Scholar]
- 40.Lopes AP, et al. 2016. Leaf flush drives dry season green-up of the Central Amazon. Remote Sens. Environ. 182, 90–98. ( 10.1016/j.rse.2016.05.009) [DOI] [Google Scholar]
- 41.Saleska SR, Wu J, Guan K, Araujo AC, Huete A, Nobre AD, Restrepo-Coupe N. 2016. Dry-season greening of Amazon forests. Nature 531, E4–E5. ( 10.1038/nature16457) [DOI] [PubMed] [Google Scholar]
- 42.Wagner FH, et al. 2016. Climate seasonality limits leaf carbon assimilation and wood productivity in tropical forests. Biogeosciences 13, 2537–2562. ( 10.5194/bg-13-2537-2016) [DOI] [Google Scholar]
- 43.Wu J, et al. 2018. Biological processes dominate seasonality of remotely sensed canopy greenness in an Amazon evergreen forest. New Phytol. 217, 1507–1520. ( 10.1111/nph.14939) [DOI] [PubMed] [Google Scholar]
- 44.Hilker T, Lyapustin AI, Tucker CJ, Hall FG, Myneni RB, Wang Y, Bi J, Mendes de Moura Y, Sellers PJ. 2014. Vegetation dynamics and rainfall sensitivity of the Amazon. Proc. Natl Acad. Sci. USA 111, 16 041–16 046. ( 10.1073/pnas.1404870111) [DOI] [PMC free article] [PubMed] [Google Scholar]
- 45.Lyapustin A, et al. 2011. Multiangle implementation of atmospheric correction (MAIAC): 2. Aerosol algorithm. J. Geophys. Res. 116(D3), D03211 ( 10.1029/2010JD014986) [DOI] [PMC free article] [PubMed] [Google Scholar]
- 46.Lyapustin A, Martonchik J, Wang Y, Laszlo I, Korkin S. 2011. Multiangle implementation of atmospheric correction (MAIAC): 1. Radiative transfer basis and look-up tables. J. Geophys. Res. 116(D3), D03210 ( 10.1029/2010JD014985) [DOI] [Google Scholar]
- 47.Lucht W, Lewis P. 2000. Theoretical noise sensitivity of BRDF and albedo retrieval from the EOS-MODIS and MISR sensors with respect to angular sampling. Int. J. Remote Sens. 21, 81–98. ( 10.1080/014311600211000) [DOI] [Google Scholar]
- 48.Samanta A, Ganguly S, Hashimoto H, Devadiga S, Vermote E, Knyazikhin Y, Nemani RR, Myneni RB. 2010. Amazon forests did not green-up during the 2005 drought. Geophys. Res. Lett. 37 ( 10.1029/2009GL042154) [DOI] [Google Scholar]
- 49.Wan Z.1999. MODIS Land-Surface Temperature Algorithm Theoretical Basis Document (LST ATBD). Available from: https://modis.gsfc.nasa.gov/data/atbd/atbd_mod11.pdf .
- 50.Gloor M, Brienen RJW, Galbraith D, Feldpausch TR, Schöngart J, Guyot J-L, Espinoza JC, Lloyd J, Phillips OL. 2013. Intensification of the Amazon hydrological cycle over the last two decades. Geophys. Res. Lett. 40, 1729–1733. ( 10.1002/grl.50377) [DOI] [Google Scholar]
- 51.Lewis SL, Brando PM, Phillips OL, Van Der Heijden GMF, Nepstad D. 2011. The 2010 Amazon drought. Science 331, 554 ( 10.1126/science.1200807) [DOI] [PubMed] [Google Scholar]
- 52.Duffy PB, Brando P, Asner GP, Field CB. 2015. Projections of future meteorological drought and wet periods in the Amazon. Proc. Natl Acad. Sci. USA 112, 13 172–13 177. ( 10.1073/pnas.1421010112) [DOI] [PMC free article] [PubMed] [Google Scholar]
- 53.Marengo JA, Tomasella J, Alves LM, Soares WR, Rodriguez DA. 2011. The drought of 2010 in the context of historical droughts in the Amazon region. Geophys. Res. Lett. 38, L12703 ( 10.1029/2011GL047436) [DOI] [Google Scholar]
- 54.Saleska SR, Didan K, Huete AR, da Rocha HR. 2007. Amazon forests green-up during 2005 drought. Science 318, 612 ( 10.1126/science.1146663) [DOI] [PubMed] [Google Scholar]
- 55.Xu L, Samanta A, Costa MH, Ganguly S, Nemani RR, Myneni RB. 2011. Widespread decline in greenness of Amazonian vegetation due to the 2010 drought. Geophys. Res. Lett. 38, L07402. ( 10.1029/2011GL046824) [DOI] [Google Scholar]
- 56.Anderson LO, Malhi Y, Aragão LEOC, Ladle R, Arai E, Barbier N, Phillips O. 2010. Remote sensing detection of droughts in Amazonian forest canopies. New Phytol. 187, 733–750. ( 10.1111/j.1469-8137.2010.03355.x) [DOI] [PubMed] [Google Scholar]
- 57.Anderson LO, Aragão LEOC, Shimabukuro YE, Almeida S, Huete A. 2011. Fraction images for monitoring intra-annual phenology of different vegetation physiognomies in Amazonia. Int. J. Remote Sens. 32, 387–408. ( 10.1080/01431160903474921) [DOI] [Google Scholar]
- 58.Brando PM, Goetz SJ, Baccini A, Nepstad DC, Beck PSA, Christman MC. 2010. Seasonal and interannual variability of climate and vegetation indices across the Amazon. Proc. Natl Acad. Sci. USA 107, 14 685–14 690. ( 10.1073/pnas.0908741107) [DOI] [PMC free article] [PubMed] [Google Scholar]
- 59.Guan K, et al. 2015. Photosynthetic seasonality of global tropical forests constrained by hydroclimate. Nat. Geosci. 8, 284–289. ( 10.1038/ngeo2382) [DOI] [Google Scholar]
- 60.Dalagnol R, Wagner FH, Galvão LS, Nelson BW, Aragão LEO. 2018. Life cycle of bamboo in southwestern Amazon and its relation to fire events. Biogeosci. Discuss. ( 10.5194/bg-2018-207) [DOI] [Google Scholar]
- 61.Doughty CE, et al. 2015. Drought impact on forest carbon dynamics and fluxes in Amazonia. Nature 519, 78–82. ( 10.1038/nature14213) [DOI] [PubMed] [Google Scholar]
- 62.Uriarte M, Lasky J, Boukili V, Chazdon R. 2016. A trait-mediated, neighbourhood approach to quantify climate impacts on successional dynamics of tropical rainforests. Funct. Ecology. 30, 157–167. ( 10.1111/1365-2435.12576) [DOI] [Google Scholar]
- 63.Verbesselt J, Umlauf N, Hirota M, Holmgren M, Van Nes E. 2016. Remotely sensed resilience of tropical forests. Nat. Clim. Change 6, 1028–1031. ( 10.1038/nclimate3108) [DOI] [Google Scholar]
- 64.Doughty CE, et al. 2014. The production, allocation and cycling of carbon in a forest on fertile terra preta soil in eastern Amazonia compared with a forest on adjacent infertile soil. Plant Ecol. Divers 7, 41–53. ( 10.1080/17550874.2013.798367) [DOI] [Google Scholar]
- 65.Alencar A, Nepstad D, Diaz MCV, Alencar A, Nepstad D, Diaz MCV. 2006. Forest understory fire in the Brazilian Amazon in ENSO and non-ENSO years: area burned and committed carbon emissions. Earth Interact. 10, 1–17. ( 10.1175/EI150.1) [DOI] [Google Scholar]
- 66.Barlow J, Peres CA. 2008. Fire-mediated dieback and compositional cascade in an Amazonian forest. Phil. Trans R. Soc. B 363, 1787–1794. ( 10.1098/rstb.2007.0013) [DOI] [PMC free article] [PubMed] [Google Scholar]
- 67.Nepstad DC, Stickler CM, Filho BS, Merry F. 2008. Interactions among Amazon land use, forests and climate: prospects for a near-term forest tipping point. Phil. Trans. R Soc. B 363, 1737–1746. ( 10.1098/rstb.2007.0036) [DOI] [PMC free article] [PubMed] [Google Scholar]
- 68.Aragão LEOC et al. 2014. Environmental change and the carbon balance of Amazonian forests. Biol. Rev. 89, 913–931. ( 10.1111/brv.12088) [DOI] [PubMed] [Google Scholar]
- 69.Uriarte M, Schwartz N, Powers J, Marín-Spiotta E, Liao W. 2016. Biotropica 48, 780–797. ( 10.1111/btp.12380) [DOI] [Google Scholar]
Associated Data
This section collects any data citations, data availability statements, or supplementary materials included in this article.
Supplementary Materials
Data Availability Statement
Rainfall: Climate Hazards Group InfraRed Precipitation with Station data (CHIRPS): doi:10.1038/sdata.2015.66. MODIS Multi-Angle Implementation of Atmospheric Correction (MAIAC). Enhanced Vegetation Index (EVI): doi.wiley.com/10.1029/2010JD014986 and doi.wiley.com/10.1029/2010JD014985. MODIS Land Surface Temperature (LST) MODIS MOD11A2 v006: 10.5067/MODIS/MOD11A2.006. Land cover maps—MapBiomas product: http://mapbiomas.org/pages/downloads. TRMM dataset: Tropical Rainfall Measuring Mission (TRMM) (2011), TRMM (TMPA/3B43) Rainfall Estimate L3 1 month 0.25 degree × 0.25 degree V7, Greenbelt, MD, Goddard Earth Sciences Data and Information Services Center (GES DISC). (doi:10.5067/TRMM/TMPA/MONTH/7) Accessed: 17/09/2018.