

Abstract
Background
Venous thromboembolism (VTE) is associated with significant morbidity and mortality.
Objectives
We investigated the impact of direct and AT‐dependent FXa or thrombin inhibitors on thrombus formation.
Methods
Whole blood thromboelastometry and thrombin generation were assessed after triggering the TF pathway. Clinically relevant concentrations of rivaroxaban, fondaparinux, dabigatran or tinzaparin and an association of rivaroxaban and dabigatran were examined.
Results
All agents delayed thrombus formation in a concentration‐dependent manner, as documented by the prolongation of the clotting time (CT) and clot formation time (CFT). Rivaroxaban did not significantly alter the α‐angle or maximum clot firmness (MCF). In contrast, dabigatran and fondaparinux altered the process of clot structure by decreasing the α‐angle, but did not modify clot firmness. The later property was significantly affected only by tinzaparin that also reduced the MCF. The association of rivaroxaban and dabigatran did not affect the MCF, although it amplified the effect on CFT and α‐angle.
Conclusions
All agents delayed thrombus formation. However, the compounds differed substantially with respect to fibrin polymerization rate and clot firmness. Comparison of the data obtained by thrombin generation assessment with those obtained by the thromboelastometric study shows that the delay in clot formation is principally associated with prolongation of the initiation phase of thrombin formation as well as a reduction of the propagation phase. Tinzaparin was much more potent than the other agents both with regard to suppression of thrombin generation and by delay in clot formation.
Keywords: dabigatran, fondaparinux, rivaroxaban, thrombin, thromboelastography, tinzaparin
Essentials.
Direct or indirect FXa or thrombin inhibitors delay clot formation.
We explored in vitro the impact of direct and AT‐dependent inhibitors on clot characteristics.
The inhibition of FXa by rivaroxaban or thrombin by dabigatran does not alter clot firmness.
The AT‐dependent antithrombotics suppress fibrin polymerization and decrease clot firmness.
1. INTRODUCTION
The kinetics of clot formation, clot structure, and clot firmness are of major importance for thrombus formation since they are associated with the recanalization of the obstructed vessels and thus, the risk of venous thromboembolism (VTE) recurrence.1, 2, 3, 4, 5 Reduced plasma clot permeability has been associated with residual vein thrombosis which is an independent risk factor for recurrent VTE and postthrombotic syndrome (PTS).6 Anticoagulant treatments aim to downregulate thrombin generation and potentially alter the kinetics of thrombus formation and clot quality.
The direct orally active anticoagulants (DOACs) differ by their target enzymes and the mechanism by which they inhibit thrombin generation. The antithrombin‐dependent anticoagulants may selectively inhibit activated factor Xa (FXa), like fondaparinux or both FXa and thrombin, like low‐molecular‐weight heparins (LMWH) or unfractionated heparin (UFH). Rivaroxaban selectively and competitively inhibits free FXa and prothrombinase/clot‐associated FXa through reversible interactions, thereby inhibiting thrombin generation and decreasing fibrin clot formation.7, 8, 9 Fondaparinux, a methoxy form of the natural pentasaccharide sequence, is also a selective antithrombin (AT)‐dependent FXa inhibitor. However, in contrast to rivaroxaban, fondaparinux does not inhibit prothrombin‐bound or clot‐associated FXa.10, 11, 12 Dabigatran acts as a reversible direct thrombin inhibitor that specifically binds to both free and fibrin‐bound thrombin.13, 14 The LMWHs are multi‐targeted, AT‐dependent, antithrombotic agents which differ substantially in their chemical structure, the anti‐Xa/anti‐IIa ratio, and the inhibition rate of thrombin generation as compared to DOACs.15, 16, 17 Their principal characteristics are summarized in Table 1.
Table 1.
Principal characteristics of the antithrombotics rivaroxaban, fondaparinux, dabigatran, and tinzaparin
| Rivaroxaban | Fondaparinux | Dabigatran | Tinzaparin | |
|---|---|---|---|---|
| Mode of action | Direct | AT‐dependent | Direct | AT‐dependent |
| Target | FXa | FXa | FIIa | FXa and FIIa |
| Target status | Free and prothrombinase/clot‐associated FXa | Free FXa | Free and fibrin‐bound FIIa | Free FXa and Free FIIa |
| Molecular weight (g/mol) | 435.88 | 1728 | 471.52 | 5500‐7500 |
| Anti‐Xa/anti‐IIa ratio | n/a | n/a | n/a | 2 ± 0.5 |
| Protein bound (%) | 95 | 0 | 35 | 30 |
AT, antithrombin; FXa, activated factor X; FIIa, activated factor II; n/a, not applicable.
Despite the widespread clinical use of these agents and the detailed knowledge about their mechanism of action, their impact on clot formation kinetics and clot quality is poorly understood. Modelization of the effects of DOACs and AT‐dependent antithrombotic agents on clot formation and structure could develop additional criteria for the classification of the anticoagulant agents.
We aim here to investigate different aspects of the mechanisms by which the direct inhibitors of FXa and thrombin and the AT‐dependent anticoagulants alter thrombus growth. For this, we used thromboelastometry and thrombin generation assays to perform in vitro experiments by spiking normal human blood or plasma with clinically relevant concentrations of rivaroxaban, fondaparinux, dabigatran, and tinzaparin. To investigate any potential differences between the anti‐Xa or anti‐IIa activities of the AT‐dependent agents and the respective specific activities of the direct inhibitors of FXa or thrombin, we performed mixing experiments of rivaroxaban and dabigatran in ratio which simulated those of the LMWH.
2. MATERIALS AND METHODS
2.1. Reagents
For thromboelastormery assays, recombinant human thromboplastin (Dade‐Innovin) was purchased from Siemens Healthcare (Paris, France). Calcium chloride (CaCl2) was from Sigma‐Aldrich Chimie S.a.r.l. (Lyon, France). For thrombin generation assays, 5 pm TF PPP‐Reagent and PRP‐reagent were obtained from Stago (Asnieres, France); the other reagents were purchased from Thrombinoscope BV (Maastricht, the Netherlands).
Rivaroxaban pure powder (Xarelto) was obtained from Bayer Schering Pharmacy (Wuppertal, Germany). Fondaparinux (Arixtra) was obtained from ASPEN (Paris, France). Dabigatran (Pradaxa) pure powder was obtained from Boehringer Ingelheim Pharma (Ingelheim, Germany). Tinzaparin (Innohep) was purchased from LEO Laboratories (Paris, France).
2.2. Sample preparation
Blood was collected from eight healthy volunteers (members of the laboratory staff) with atraumatic vein puncture using 22 G blood collection needles (Eclipse, BD Vacutainer Plymouth, UK) into siliconized Vacuette tubes (Greiner Bio‐One GmbH, Kremsmunster, Austria) containing 1/9 (v/v) of buffered sodium citrate (3.2%). Within 1 hour after venipuncture, blood from all donors was centrifuged twice at 2250 rpm for 15 minutes to obtain platelet‐poor plasma (PPP). Samples of PPP were pooled and subsequently separated in 1 mL aliquots and stored at −80°C until assayed. Platelet rich plasma (PRP) was prepared separately after centrifugation of whole blood at 1070 rpm for 10 minutes and used for thrombin generation experiments. Platelet count in PRP samples was adjusted to 200 G/L using dilution with autologous plasma before being pooled. The blood samples collected from the first four donors were individually spiked with rivaroxaban, dabigatran, tinzaparin, or fondaparinux. In separate experiments, whole blood was also spiked with associations of rivaroxaban and dabigatran. Samples were incubated with the studied anticoagulants for 30 minutes. The concentrations of rivaroxaban and dabigatran used for the thromboelastometry and thrombin generation experiments were 14, 42, 126, 252, and 700 ng/mL plasma. The studied concentrations of fondaparinux were 0.4, 0.6, and 0.8 μg/mL plasma. The target plasma concentrations of tinzaparin were 0.05, 0.1, 0.2, 0.4, 0.6, and 0.8 anti‐Xa IU/mL plasma. These concentration ranges were selected according to the pharmacokinetics of the studied agents after administration of a therapeutic relevant dose.18, 19, 20 .
Associations of rivaroxaban and dabigatran were as follows: 7 ng/mL of rivaroxaban with 7 ng/mL of dabigatran (RD1), 21 ng/mL of rivaroxaban with 7 ng/mL of dabigatran (RD2), 21 ng/mL of both compounds (RD3), 90 ng/mL of both compounds (RD4), 180 ng/mL of rivaroxaban with 90 ng/mL of dabigatran (RD5), 180 ng/mL of both compounds (RD6), 500 ng/mL of rivaroxaban with 180 ng/mL of dabigatran (RD7), 500 ng/mL of both rivaroxaban and dabigatran (RD8).
2.2.1. Thromboelastometry assay
Thromboelastometry was performed on ROTEM delta, Tem Innovations GmbH, Werfen, (Munich, Germany).21 Minimal tissue factor triggered whole blood thromboelastometry (min‐TF TEM) was performed using diluted human recombinant thromboplastin. For each experiment, 330 μL of whole blood was mixed with 20 μL of CaCl2 0.2 mol/L and 10 μL of diluted thromboplastin (yielding a 1:7200 final dilution) in ROTEM final cups and the measurement was started 2 seconds after mixing. The following thromboelastometric parameters of trace were determined: Clotting Time (CT) is the time from the start of the sample run to the point of first significant clot appearance corresponding to an amplitude of 2 mm; Clot Formation Time (CFT) is the time from CT until the level of clot firmness reaches an arbitrary value of 20 mm; α‐angle represents the measurement of clot development kinetics; Maximum Clot Firmness (MCF) is the maximum vertical amplitude of the thromboelastometry trace reflecting the maximum strength and firmness of the clot. Data acquisition was allowed to continue for a maximum of 2 hours. The inter‐ and intra‐assay coefficients of variation for all parameters were 8% and 5%, respectively. The inter‐individual coefficient of variation was 19% for the CT, 17% for the CFT, 5% for the α‐angle, and 19% for the MCF.
2.2.2. Thrombin generation assay
Thrombin generation in PPP or PRP was studied with the Calibrated Automated Thrombogram (CAT) Diagnostica Stago, (Gennevilliers, France) and the respective software (Thrombinoscope BV, Maastricht, the Netherlands) using Fluoroskan Ascent, a fully automated, computer‐controlled fluorometric microplate reader (Thermo Fisher Scientific, Waltham, Massachusetts, USA). In each well of the microtiter plate, 80 μL of PPP or PRP, spiked with the anticoagulants under study or with physiological NACl were mixed with 20 μL PPP‐Reagent (5 pmol/L of TF and 4 μmol/L of phospholipids) or PRP‐reagent respectively. Thrombin generation was initiated by adding a triggering solution containing CaCl2 (16.7 mmol/L final concentration) and a fluorogenic substrate (Z‐Gly‐Gly‐Arg‐AMC, 417 μmol/L final concentration). Each measurement was performed in duplicate. In a third well Thrombin Calibrator (Diagnostica Stago) was added to correct thrombin generation curves for substrate consumption and inner filter fluorescence effects. Spontaneous activation of the contact system of blood coagulation might be a variable that influence results accuracy. To rule out this possibility we performed preliminary experiments by incubating plasma with corn trypsin inhibitor (which blocks spontaneous activation of the contact system). This series of experiments showed that inhibition of contact system activation did not modify the results of the assay (data not shown). The following thrombogram parameters were analyzed: lag‐time (LT): initiation phase of coagulation; time to peak (ttPeak): time to maximum thrombin generation; peak (Peak): maximum concentration of free thrombin; endogenous thrombin potential (ETP): total enzymatic activity of thrombin and mean rate index (MRI) of the propagation phase of thrombin generation calculated by the formula MRI = Peak/(ttPeak−LT). The inter‐ and intra‐assay coefficients of variation for all parameters were 5%.
2.3. Statistical analysis
Data are presented as mean ± SD of five separate experiments. Statistical comparison was performed using the paired Student's t test to determine the significance of the differences between the values obtained under each experiment condition compared to the basal values for whole blood, PRP, and PPP. The unpaired Student's t test was used to control the differences between rivaroxaban, fondaparinux, dabigatran and tinzaparin. The analysis of variance (ANOVA) test was used to compare changes in continuous variables in the presence of the studied antithrombotics. Differences were considered as significant if P < .05. The half maximal inhibitory concentration (IC50) values were calculated by extrapolation of the concentration‐dependent curve constructed for each compound in each assay. The CT×2 was defined as the concentration required for doubling the clotting time and CFT×20% was defined as the concentration required for increasing the clot formation time by 20%. This cut‐off level was defined since it was higher as compared to the inter‐individual variability of the assay in healthy controls. The Statistical Package for Social Sciences (SPSS) software for Windows was used for statistical analysis (SPSS Inc., Chicago, Illinois, USA).
3. RESULTS
3.1. Donors’ characteristics
Principal clinical characteristics and individual values of basic blood tests of the healthy donors are shown in Table 2. None of the donors had a personal history of thrombotic or bleeding disorder and none of the female donors used oral contraceptives. White blood cells count, platelet count, prothrombin time and activated partial thromboplastin time were in the normal range for all volunteers enrolled.
Table 2.
Clinical characteristics and biological values of the donors whose blood was used for throboelastometry and thrombin‐generation experiments
| Age | Sex | BMI | Smoking | Hematocrit (%) | Fibrinogen (g/L) | Type of experiment | |
|---|---|---|---|---|---|---|---|
| D1 | 50 | M | 28 | 5 c/day | 44.2 | 3.4 | ROTEM and thrombin generation test |
| D2 | 27 | M | 25 | NO | 46 | 2.8 | ROTEM and thrombin generation test |
| D3 | 42 | F | 22 | NO | 33.1 | 3.1 | ROTEM and thrombin generation test |
| D4 | 38 | F | 20 | NO | 38.9 | 3.2 | ROTEM and thrombin generation test |
| D5 | 25 | M | 20 | NO | 45.7 | 2.9 | Thrombin generation test |
| D6 | 30 | M | 19 | 10 c/day | 47.2 | 3.2 | Thrombin generation test |
| D7 | 28 | F | 23 | NO | 40.6 | 3.3 | Thrombin generation test |
| D8 | 25 | M | 21 | NO | 48 | 3.2 | Thrombin generation test |
BMI, body mass index; D, donor.
3.2. Effect of the antithrombotic agents on minimal TF‐triggered whole‐blood thromboelastometry
Table 3 shows the concentrations of rivaroxaban, dabigatran, fondaparinux, tinzaparin, and the association of rivaroxaban and dabigatran which doubled the CT and increased by 20% the CFT. Representative thromboelastograms illustrating the dose‐response of each compound are shown in Figure 1.
Table 3.
Comparison of the concentrations of rivaroxaban, fondaparinux, dabigatran, tinzaparin, and the association of rivaroxaban and dabigatran necessary to induce a 2‐fold increase of the CT and 20% of the CFT
| Rivaroxaban (ng/mL) | Dabigatran (ng/mL) | Fondaparinux (μg/mL) | Tinzaparin (anti‐Xa IU/mL) | Rivaroxaban+dabigatran (ng/mL of rivaroxaban) | Rivaroxaban+dabigatran (ng/mL of dabigatran) | |
|---|---|---|---|---|---|---|
| CT×2 | 355 ± 170 | 52.5 ± 12.99 | 0.66 ± 0.043 | 0.05 ± 0.0006 | 48 ± 22.05 | 46.6 ± 18.5 |
| CFT×20% | 206.67 ± 63.4 | 313.3 ± 230.1 | 0.2 ± 0.004 | 0.05 ± 0.0006 | 36 ± 18.5 | 27 ± 24.9 |
Values are expressed as mean ± standard deviation of five experiments. CT×2, the concentration required for doubling the clotting time, CFT×20%, the concentration required for increasing by 20% the clot formation time; CFT, clot formation time; CT, clotting time.
Figure 1.

Alterations of min‐TF whole blood thromboelastometry by rivaroxaban, dabigatran fondaparinux and tinzaparin. Representative thromboelastographic traces from 1 out of 5 experiments. (A) Rivaroxaban. (B) Fondaparinux. (C) Dabigatarn. (D) Tinzaparin. (E) Rivaroxaban and Dabigatran at low concentrations. (F) Rivaroxaban and Dabigatran at high concentrations. R, rivaroxaban; D, dabigatran
3.2.1. Factor Xa inhibitors
Rivaroxaban prolonged the CT in a concentration‐dependent manner (Figure 2A). Rivaroxaban had no significant influence on the CFT while 20% prolongation of the CFT was obtained at concentrations higher than 126 ng/mL compared to control samples, although it was not statistically significant (P = .231) (Figure 2B). Even in the high‐dose range, rivaroxaban had no detectable influence on the α‐angle and MCF (Figure 2C, D).
Figure 2.
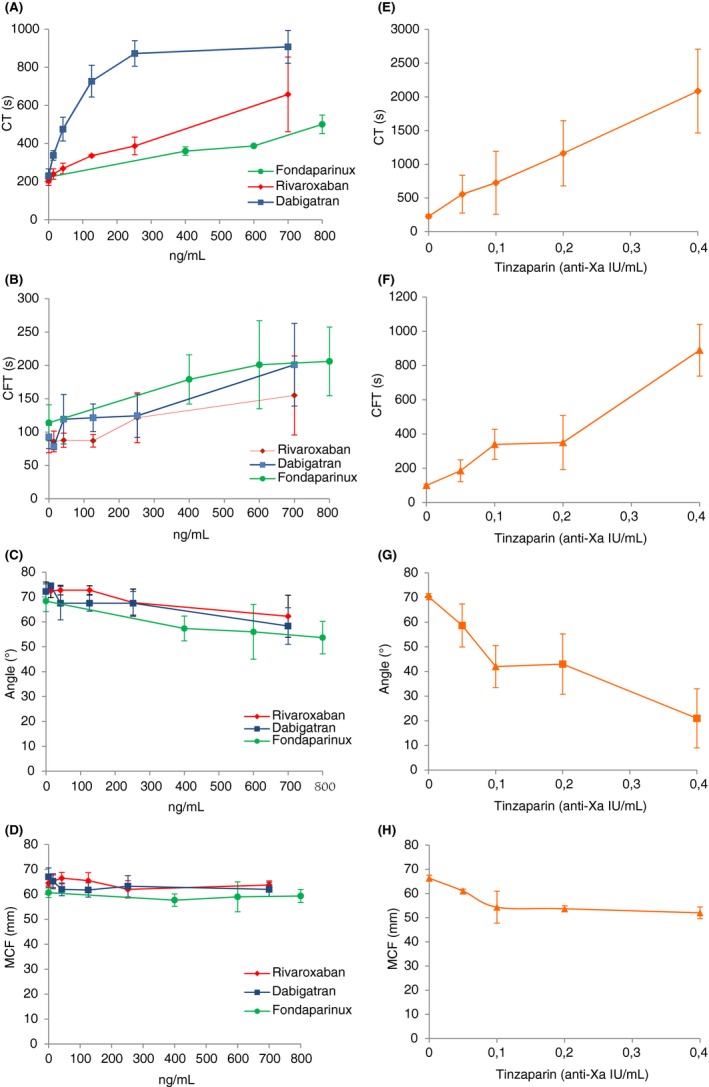
Effects of the four antithrombotics (rivaroxaban, fondaparinux, dabigatran, and tinzaparin) in ROTEM®. Compounds were spiked into whole blood over a range of concentrations as indicated in the graph. Red, rivaroxaban; blue, dabigatran; green, fondaparinux; orange, tinzaparin. CT, clotting time; CFT, clot formation time; MCF, maximum clot firmness. Values are the mean ± SD of five experiments. CT, P ˂ 0.05 for rivaroxaban versus control; P ˂ 0.01 for fondaparinux versus control; P ˂ 0.001 for dabigatran and tinzaparin versus control. CFT, P ˂ 0.05 for fondaparinux versus control; P ˂ 0.01 for tinzaparin versus control. α‐angle, P ˂ 0.05 for fondaparinux, dabigatran and tinzaparin versus control. MCF, P ˂ 0.05 for tinzaparin versus control
Fondaparinux prolonged both CT and CFT in a concentration‐dependent manner although the effect was more pronounced on the CT (Figure 2A, B). Its maximum effect on the CT was a 50% increase compared to control values. At the highest studied concentration, fondaparinux reduced the α‐angle by 20% but had practically no effect on MCF (Figure 2C, D).
3.2.2. Specific thrombin inhibitors
Dabigatran had a more pronounced effect on the CT than on CFT. At concentrations equal or higher than 252 ng/mL the effect of dabigatran on CT reached a plateau (Figure 2A). Dabigatran was able to prolong the CFT at concentrations as low as 42 ng/mL. However, higher concentrations, up to 252 ng/mL, had no further influence on the CFT (Figure 2B). At the highest concentration studied, dabigatran was able to increase the CFT 2.2‐fold, compared to controls although the statistical significance of this finding was only marginal (P = .054). At the highest studied concentration, dabigatran was able to reduce the α‐angle by 10% but had no significant influence on the MCF (Figure 2C, D).
3.2.3. Combined inhibition of factor Xa and thrombin
Tinzaparin at concentrations equal or higher than 0.6 anti‐Xa IU/mL completely abolished clot formation. Lower concentrations of tinzaparin prolonged both the CT and CFT and decreased the α‐angle and MCF. The effect of tinzaparin was concentration‐dependent (Figure 2, frames E, F, G, and H).
Associations of rivaroxaban and dabigatran amplified the effect on CT and CFT and reduced the α‐angle significantly, compared to the effect of each agent alone (Figure 3, frames A, B, and C). In contrast, the effect of the associations did not significantly alter the MCF, even at the highest concentration (Figure 3D). In the presence of dabigatran, the concentration of rivaroxaban required to increase the CT by 2‐fold and prolong the CFT by 20% was 48 and 36 ng/mL, respectively. In comparison, in the presence of rivaroxaban, the concentrations of dabigatran required to increase the CT by 2‐fold and prolong the CFT by 20% were 46.6 and 27 ng/mL, respectively (Table 3).
Figure 3.

Effects of the association rivaroxaban/dabigatran in ROTEM® parameters. Compounds were spiked into whole blood as indicated in the Materials and Methods section. RD1: 7 ng/mL of rivaroxaban with 7 ng/mL of dabigatran; RD2: 21 ng/mL of rivaroxaban with 7 ng/mL of dabigatran; RD3: 21 ng/mL of both compounds; RD4: 90 ng/mL of both compounds; RD5: 180 ng/mL of rivaroxaban with 90 ng/mL of dabigatran; RD6: 180 ng/mL of both compounds; RD7: 500 ng/mL of rivaroxaban with 180 ng/mL of dabigatran, RD8: 500 ng/mL of both rivaroxaban and dabigatran; CT, clotting time; CFT, clot formation time; MCF, maximum clot firmness. Values are the mean ± SD of five experiments. P ˂ 0.01 versus control for CFT and α‐angle; P ˂ 0.001 versus control for CT
3.3. Effect of the antithrombotic agents on thrombin generation in platelet‐rich plasma
Representative thrombograms in the presence of increasing concentrations of each compound are shown in Figure 4.
Figure 4.

Representative thrombograms of rivaroxaban, fondaparinux, dabigatran, tinzaparin and the association of rivaroxaban and dabigatran on platelet rich plasma (PRP) thrombin generation (TGA). Plasma samples were spiked with the compounds as indicated in the graph. RD2, 21 ng/mL of rivaroxaban with 7 ng/mL of dabigatran; RD3, 21 ng/mL of both; RD4, 90 ng/mL of both; RD5, 180 ng/mL of rivaroxaban with 90 ng/mL of dabigatran
3.3.1. Factor Xa inhibitors
Rivaroxaban prolonged the LT and ttPeak and reduced the Peak, ETP, and MRI in a concentration‐dependent manner. At the highest concentration (700 ng/mL) the Peak of thrombin was 28 ng/mL corresponding to about 16% of the Peak of thrombin for the control experiment. In the presence of the highest concentration of rivaroxaban, the time required for the generation of 10% of thrombin was about 30 minutes.
Fondaparinux at the lower concentration (0.4 μg/mL) had maximal effect on LT, ttPeak, Peak, and MRI (Figure 4B). At the highest concentration (0.8 μg/mL) the Peak of thrombin was 89 ng/mL corresponding to about 60% of the Peak of thrombin observed in the control experiment. In the presence of 0.8 μg/mL of fondaparinux the time required for the generation of 10% of thrombin was about 10 minutes.
3.3.2. Specific thrombin inhibitors
Dabigatran significantly prolonged the LT in a concentration‐dependent manner. At the highest concentration (700 ng/mL) the Peak of thrombin was 20 ng/mL corresponding to about 12% of the Peak of thrombin for the control experiment. In the presence of 700 ng/mL of dabigatran the time required for the generation of 10% of thrombin was about 40 minutes.
3.3.3. Combined inhibition of factor Xa and thrombin
Tinzaparin at concentrations ranging from 0.05 to 0.1 anti‐Xa IU/mL did not significantly alter thrombin generation. On the other hand, at concentrations higher than 0.1 anti‐Xa IU/mL tinzaparin significantly prolonged the LT and ttPeak and reduced the Peak, ETP and MRI. Tinzaparin, at concentrations equal or higher than 0.6 anti‐Xa IU/mL completely suppressed thrombin generation. At 0.4 IU/mL the Peak of thrombin was 35 ng/mL corresponding to about 17% of the Peak of thrombin for the control experiment. In the presence of 0.4 IU/mL of tinzaparin, the time required for the generation of 10% of thrombin was about 37 minutes.
Association of rivaroxaban and dabigatran at concentrations higher than 180 ng/mL completely abolished thrombin generation. At lower concentrations, the association prolonged the LT and ttPeak and decreased the Peak and MRI in a concentration‐dependent manner. The effect on ETP was less pronounced compared to the other parameters of the thrombogram. At 180 ng/mL rivaroxaban associated with 90 ng/mL dabigatran, the Peak of thrombin was 78 ng/mL corresponding to about 36% of the Peak of thrombin for the control experiment. In the presence of the above mentioned mix, the time required for the generation of 10% of thrombin was about 30 minutes.
3.4. Effect of the antithrombotic agents on thrombin generation in platelet poor plasma
Representative thrombograms in the presence of increasing concentrations of each compound are shown in Figure 5.
Figure 5.

Representative thrombograms of rivaroxaban, fondaparinux, dabigatran, tinzaparin and the association of rivaroxaban and dabigatran on platelet poor plasma (PPP) thrombin generation (TGA). Plasma samples were spiked with the compounds as indicated in the graph. RD2, 21 ng/mL of rivaroxaban with 7 ng/mL of dabigatran; RD3, 21 ng/mL of both; RD4, 90 ng/mL of both; RD5, 180 ng/mL of rivaroxaban with 90 ng/mL of dabigatran; RD6, 180 ng/mL of both
3.4.1. Factor Xa inhibitors
Rivaroxaban completely suppressed thrombin generation at the highest studied concentration (700 ng/mL). At lower concentrations, rivaroxaban had a more potent effect on the ttPeak compared to LT. Rivaroxaban dramatically decreased the MRI and Peak in a concentration‐dependent manner. Among the different thrombogram parameters, the ETP was the least affected. At a concentration of 252 ng/mL the Peak of thrombin was 42 ng/mL corresponding to about 14% of the Peak of thrombin for the control experiment. In the presence of 252 ng/mL rivaroxaban, the time required for the generation of 10% of thrombin was about 9 minutes.
Fondaparinux had a marginal effect on the LT and ttPeak but significantly reduced the Peak, ETP, and MRI at the lowest concentration (0.4 μg/mL). At concentrations higher than 0.4 μg/mL there was not any significant ulterior reduction in thrombogram parameters. At the highest studied concentration (0.8 μg/mL) the Peak of thrombin was 35 ng/mL corresponding to about 16% of the Peak of thrombin for the control experiment. In the presence of the highest concentration of fondaparinux the time required for the generation of 10% of thrombin was about 7 minutes.
3.4.2. Specific thrombin inhibitors
Dabigatran completely abolished thrombin formation at the highest studied concentration (700 ng/mL). At concentrations below 700 ng/mL, dabigatran prolonged the LT and ttPeak in a concentration‐dependent manner. At a concentration of 252 ng/mL, the Peak of thrombin was 137 ng/mL corresponding to about 45% of the Peak of thrombin for the control experiment. In the presence of 252 ng/mL dabigatran, the time required for the generation of 10% of thrombin was about 19 minutes.
3.4.3. Combined inhibition of factor Xa and thrombin
Tinzaparin only marginally prolonged the LT at the lowest concentrations. In contrast, for concentrations up to 0.4 anti‐Xa IU/mL tinzaparin prolonged the ttPeak and reduced the Peak, ETP and MRI in a concentration‐dependent manner. For concentrations higher than 0.4 anti‐Xa IU/mL, there was no detectable thrombin formation. At 0.4 anti‐Xa IU/mL tinzaparin, the Peak of thrombin was 2.8 ng/mL corresponding to about 0.9% of the Peak of thrombin for the control experiment.
Association of rivaroxaban and dabigatran had added effect on the LT and ttPeak although this effect was only evident when the two drugs were combined at concentrations of 90 ng/mL or higher. At the highest concentrations of rivaroxaban (500 ng/mL), thrombin generation was suppressed. At concentrations of 180 ng/mL for both compounds, the Peak of thrombin was 70 ng/mL corresponding to about 40% of the Peak of thrombin for the control experiment. In the presence of the above mentioned concentrations, the time required for the generation of 10% of thrombin was about 36 minutes.
4. DISCUSSION
The present study explored in vitro the impact of the LMWH tinzaparin, the antithrombin‐dependent FXa inhibitor fondaparinux, and the specific and direct inhibitors of FXa (rivaroxaban) and thrombin (dabigatran) on clot formation kinectics and clot firmness. All agents delayed thrombus formation in a concentration‐dependent manner; however, they differed substantially with regard to their impact on fibrin polymerization and clot firmness. Previously, our group showed that whole blood thromboelastometry assessment using a low TF concentration was sensibly influenced by LMWH and fondaparinux.22, 23 However, when the test was performed in the presence of high TF concentration (EXTEM) or contact system activator (INTEM) was less sensitive to the activity of these agents.24, 25
Comparison of the data obtained by thrombin generation assessment in PPP or PRP with those obtained by the thromboelastometric study in whole blood shows that the delay in clot formation is principally linked to the prolongation of the initiation phase of thrombin generation and to the delay of the propagation phase. The inhibitory potency of the antithrombotic agents on thrombin generation was significantly higher in PPP compared to PRP. The property of platelets to inhibit the antithrombotic activity of UFH and to a lesser degree LMWHs has been well described and is principally mediated by platelet factor 4 (PF4).26 Fondaparinux, rivaroxaban, and dabigatran do not interfere with PF4; thus, this outcome could be attributed to an increased efficiency of the enzymatic complexes (prothrombinase and intrinsic tenase) formed in the presence of platelets compared to those formed in the presence of synthetic phospholipids (included in PPP‐Reagent 5pMTF). This intriguing observation merits to be investigated in a new study. It should be pointed out that the precision of thrombin generation assessment in the presence of dabigatran, is restricted by the inherent limitations of the Thrombogram CAT assay as described elsewhere.27, 28 Our findings are in agreement with previous studies reporting that these antithrombotic agents inhibit thrombin generation propagation phase by 50%‐80%.16, 17, 29, 30, 31 Thus, we assume that the prolongation of the initiation phase and the inhibition of the propagation phase of thrombin generation are translated principally to delay of clot formation. Tinzaparin was much more potent than rivaroxaban, fondaparinux, or dabigatran both on the suppression of thrombin generation and on prolongation of clot formation. We have previously shown that the anti‐IIa activity of tinzaparin is the major determinant of its antithrombotic potency.15 Indeed, according to the anti‐Xa/anti‐IIa ratio of tinzaparin, 0.05 anti‐Xa IU/mL correspond to about 0.02 anti‐IIa IU/mL that induce 50% inhibition of thrombin generation.17 The importance of thrombin inhibition on the delay of clot formation is further supported by the finding that dabigatran doubled the clotting time at concentrations usually observed at the end of the therapeutic daily cycle, whereas rivaroxaban and fondaparinux had a similar effect at concentrations that are observed within the first 4 hours after drug intake.
The coexistence of anti‐Xa and anti‐IIa activities, as for tinzaparin, seems to multiply the inhibitory effect as indicated by the findings for the association of rivaroxaban and dabigatran. Interestingly, although the association rivaroxaban/dabigatran amplified the effect on CFT and α‐angle, the MCF was not significantly altered. At all concentrations of rivaroxaban, dabigatran, or their association, at least 10% of maximal thrombin was generated as compared to the control experiment. This amount of thrombin appears to be sufficient for inducing normal fibrin polymerization and clot firmness. This finding is in accordance with the mathematical model developed by Mann et al32 who showed that tiny amounts of thrombin, appeared at the beginning of the initiation phase of coagulation, are required for normal fibrin polymerization. In the presence of fondaparinux at concentrations which induced comparable inhibition of thrombin generation as rivaroxaban, although the minimum thrombin generation was preserved, clot formation kinetics were altered. Tinzaparin also had significantly more impact on clot formation and its quality, compared to the effect of the rivaroxaban/dabigatran association. We assume that the physicochemical properties of the pentasaccharide domain in the polysaccharidic structure of the LMWH chains, rather than the inhibition of FXa or FIIa are determinants for the decrease of clot firmness. Previous studies have demonstrated that preparations of glycosaminoglycans as well as unfractionated heparin and LMWHs alter fibrin polymerization via non‐specific electrostatic interactions with fibrin.33 Heparins (UFH and LMWHs) influence the fibrin/fiber nanostructure through both the AT‐mediated inhibition of thrombin and through a direct, non‐AT dependent effect. The effect of LMWHs on clot structure seems to vary in function of their concentration and may be a consequence of the incorporation of LMWH chains into the fiber network.34 To the best of our knowledge this is the first report to indicate that the minimum pentasaccharide domain required for AT‐mediated inhibition of FXa is also required for fibrin polymerization inhibition. These data lead to the proposition of additional criteria for the classification of the anticoagulant drugs according to their effect on clot formation kinetics and clot quality.
Some limitations of the study should be acknowledged since they do not allow extrapolation of these findings in the clinical field. Blood samples were obtained from healthy volunteers; thus, the present study does not allow the evaluation of the impact of some pathological conditions, such as inflammation, on the effect of the antithrombotic agents on clot formation and thrombin generation. Moreover, the in vitro design of the study favored the anti‐IIa activity of the LMWH tinzaparin. Indeed, in vivo the elimination of the anti‐IIa activity is rapid, whereas in a static in vitro system this activity persists at the same level throughout the whole experimental period.
In conclusion, direct and specific inhibitors of FXa delay clotting time without affecting fibrin polymerization and clot firmness. Direct and specific inhibition of thrombin affects mainly the clotting time and marginally influences fibrin polymerization but does not modify clot firmness. The AT‐dependent agents affect both the clotting time and clot formation kinetics and decrease clot firmness. The effect of AT‐dependent agents on clotting time and fibrin polymerization kinetics is amplified by the combined inhibition of FXa and thrombin. The present study leads to the hypothesis that during the acute phase of thrombosis the administration of an antithrombotic treatment which also alters fibrin polymerization and clot firmness might be beneficial for the inhibition of thrombus extension and vein recanalization. This concept has to be tested in a prospective clinical trial.
RELATIONSHIP DISCLOSURE
None of the authors have any disclosures relevant to this paper.
AUTHOR CONTRIBUTIONS
S. Salta has made substantial contribution to conception and design of the study, analysis and interpretation of data, wrote the manuscript and has given final approval of the version to be published, agreed to be accountable for all aspects of the work in ensuring that questions related to the accuracy or integrity of any part of the work are appropriately investigated and resolved. L. Papageorgiou has made substantial contribution to the design of the study and the interpretation of the data and critically revised the manuscript. A. Larsen has made substantial contribution to the design of the study and critically revised the manuscript. P. Van Dreden has made substantial contributions to study design and organization, acquisition, analysis and interpretation of data. C. Soulier has made substantial contribution in the acquisition, analysis and interpretation of the data. D. V. Cokkinos has made substantial contribution to conception and design of the study, analysis and interpretation of data and critically revised the manuscript. I. Elalamy has made substantial contribution to conception and design of the study, the interpretation of the data and gave final approval of the manuscript. G. T. Gerotziafas has made substantial contribution to conception and design of the study, analysis and interpretation of data, drafted and gave final approval of the manuscript. All authors approved the final draft.
ACKNOWLEDGMENTS
The authors wish to acknowledge Marie‐Paule Roman and Hayat Mokrani for their excellent technical assistance.
Salta S, Papageorgiou L, Larsen AK, et al. Comparison of antithrombin‐dependent and direct inhibitors of factor Xa or thrombin on the kinetics and qualitative characteristics of blood clots. Res Pract Thromb Haemost. 2018;2:696–707. 10.1002/rth2.12120
REFERENCES
- 1. Longstaff C, Kolev K. Basic mechanisms and regulation of fibrinolysis. J Thromb Haemost. 2015;13:98–105. [DOI] [PubMed] [Google Scholar]
- 2. Prandoni P, Barbar S, Milan M, et al. Optimal duration of anticoagulation. Provoked versus unprovoked VTE and role of adjunctive thrombophilia and imaging tests. Thromb Haemost. 2015;113:1210–5. [DOI] [PubMed] [Google Scholar]
- 3. Undas A, Zawilska K, Ciesla‐Dul M, et al. Altered fibrin clot structure/function in patients with idiopathic venous thromboembolism and in their relatives. Blood. 2009;114:4272–8. [DOI] [PubMed] [Google Scholar]
- 4. Martinez MR, Cuker A, Mills AM, et al. Enhanced lysis and accelerated establishment of viscoelastic properties of fibrin clots are associated with pulmonary embolism. Am J Physiol Lung Cell Mol Physiol. 2014;306:397–404. [DOI] [PMC free article] [PubMed] [Google Scholar]
- 5. Siudut J, Grela M, Wypasek E, Plens K, Undas A. Reduced plasma fibrin clot permeability and susceptibility to lysis are associated with increased risk of postthrombotic syndrome. J Thromb Haemost. 2016;14:784–93. [DOI] [PubMed] [Google Scholar]
- 6. Lawrence MJ, Sabra A, Mills G, et al. A new biomarker quantifies differences in clot microstructure in patients with venous thromboembolism. Br J Haematol. 2015;168:571–5. [DOI] [PubMed] [Google Scholar]
- 7. Laux V, Perzborn E, Kubitza D, Misselwitz F. Preclinical and clinical characteristics of rivaroxaban: a novel, oral, direct factor Xa inhibitor. Semin Thromb Hemost. 2007;33:515–23. [DOI] [PubMed] [Google Scholar]
- 8. Perzborn E, Strassburger J, Wilmen A, et al. In vitro and in vivo studies of the novel antithrombotic agent BAY 59‐7939–an oral, direct factor Xa inhibitor. J Thromb Haemost. 2005;3:514–21. [DOI] [PubMed] [Google Scholar]
- 9. Kubitza D, Becka M, Wensing G, Voith B, Zuehlsdorf M. Safety, pharmacodynamics, and pharmacokinetics of BAY 59‐7939–an oral, direct Factor Xa inhibitor–after multiple dosing in healthy male subjects. Eur J Clin Pharmacol. 2005;61:873–80. [DOI] [PubMed] [Google Scholar]
- 10. Choay J, Petitou M, Lormeau JC, Sinaÿ P, Casu B, Gatti G. Structure‐activity of relationship in heparin: a synthetic pentasaccharide with high affinity for antithrombin III and eliciting high anti‐factor Xa activity. Biochem Biophys Res Comm. 1983;116:492–9. [DOI] [PubMed] [Google Scholar]
- 11. Walenga JM, Jeske WP, Samama MM, Frapaise FX, Bick RL, Fareed J. Fondaparinux: a synthetic heparin pentasaccharide as a new antithrombotic agent. Expert Opin Investig Drugs. 2002;11:397–407. [DOI] [PubMed] [Google Scholar]
- 12. Samama MM, Gerotziafas GT. Evaluation of the pharmacological properties and clinical results of the synthetic pentasaccharide (Fondaparinux). Thromb Res. 2003;109:1–11. [DOI] [PubMed] [Google Scholar]
- 13. Hankey GJ, Eikelboom JW. Dabigatran etexilate: a new oral thrombin inhibitor. Circulation. 2011;123:1436–50. [DOI] [PubMed] [Google Scholar]
- 14. Stangier J. Clinical pharmacokinetics and pharmacodynamics of the oral direct thrombin inhibitor dabigatran etexilate. Clin Pharmacokinet. 2008;47:285–95. [DOI] [PubMed] [Google Scholar]
- 15. Gerotziafas GT, Petropoulou AD, Verdy E, Sammama MM, Elalamy I. Effect of the anti‐factor Xa and anti‐factor IIa activities of low‐molecular‐weight heparins upon the phases of thrombin generation. J Thromb Haemost. 2007;5:955–62. [DOI] [PubMed] [Google Scholar]
- 16. Oswald E, Velik‐Salchner C, Innerhofer P, et al. Results of rotational thromboelastometry, coagulation activation markers and thrombin generation assays in orthopedic patients during thromboprophylaxis with rivaroxaban and enoxaparin: a prospective cohort study. Blood Coagul Fibrinolysis. 2015;26:136–44. [DOI] [PubMed] [Google Scholar]
- 17. Xu Y, Wu W, Wang L, et al. Differential profiles of thrombin inhibitors (heparin, hirudin, bivalirudin, and dabigatran) in the thrombin generation assay and thromboelastography in vitro. Blood Coagul Fibrinolysis. 2013;24:332–8. [DOI] [PubMed] [Google Scholar]
- 18. Testa S, Tripodi A, Legnani C, et al. START‐Laboratory Register. Plasma levels of direct oral anticoagulants in real life patients with atrial fibrillation: results observed in four anticoagulation clinics. Thromb Res. 2016;137:178–83. [DOI] [PubMed] [Google Scholar]
- 19. Donat F, Duret JP, Santoni A, et al. The pharmacokinetics of fondaparinux sodium in healthy volunteers. Clin Pharmacokinet. 2002;4:1–9. [DOI] [PubMed] [Google Scholar]
- 20. Pautas E, Siguret V, d'Urso M, et al. Monitoring of tinzaparin treatment at treatment dose of 10 days in elderly patients. Rev Med Interne. 2001;22:120–6. [DOI] [PubMed] [Google Scholar]
- 21. Luddington RJ. Thrombelastography/thromboelastometry. Clin Lab Haematol. 2005;27:81–90. [DOI] [PubMed] [Google Scholar]
- 22. Gerotziafas GT, Chakroun T, Samama MM, Elalamy I. In vitro comparison of the effect of fondaparinux and enoxaparin on whole blood tissue factor‐triggered thromboelastography profile. Thromb Haemost. 2004;92:1296–302. [DOI] [PubMed] [Google Scholar]
- 23. Konstantinidis K, Gerasimidis T, Verdy E, Elalamy I, Samama MM, Gerotziafas GT. Inhibition of clot formation process by treatment with the low‐molecular‐weight heparin nadroparin in patients with carotid artery disease undergoing angioplasty and stenting. A thromboelastography study on whole blood. Thromb Haemost. 2007;97:109–18. [PubMed] [Google Scholar]
- 24. Seyve L, Richarme C, Polack B, Marlu R. Impact of four direct oral anticoagulants on rotational thromboelastometry (ROTEM). Int J Lab Hematol. 2018;40:84–93. [DOI] [PubMed] [Google Scholar]
- 25. Thomas O, Larsson A, Tynngård N, Schött U. Thromboelastometry versus free‐oscillation rheometry and enoxaparin versus tinzaparin: an in‐vitro study comparing two viscoelastic haemostatic tests’ dose‐responses to two low molecular weight heparins at the time of withdrawing epidural catheters from ten patients after major surgery. BMC Anesthesiol. 2015;15:170. [DOI] [PMC free article] [PubMed] [Google Scholar]
- 26. Bendetowicz AV, Kai H, Knebel R, et al. The effect of subcutaneous injection of unfractionated and low molecular weight heparin on thrombin generation in platelet rich plasma—a study in human volunteers. Thromb Haemost. 1994;72:705–12. [PubMed] [Google Scholar]
- 27. Wagenvoord RJ, Deinum J, Elg M, Hemker HC. The paradoxical stimulation by a reversible thrombin inhibitor of thrombin generation in plasma measured with thrombinography is caused by alpha‐macroglobulin‐thrombin. J Thromb Haemost. 2010;8:1281–9. [DOI] [PubMed] [Google Scholar]
- 28. Van Ryn J, Grottke O, Spronk H. Measurement of dabigatran in standardly used clinical assays, whole blood viscoelastic coagulation, and thrombin generation assays. Clin Lab Med. 2014;34:479–501. [DOI] [PubMed] [Google Scholar]
- 29. Tsantes AE, Kyriakou E, Ikonomidis I, et al. Comparative assessment of the anticoagulant activity of rivaroxaban and dabigatran in patients with nonvalvular atrial fibrillation: a noninterventional study. Medicine (Baltimore). 2016;95:e3037. [DOI] [PMC free article] [PubMed] [Google Scholar]
- 30. Hosokawa K, Ohnishi T, Sameshima H, et al. Comparative evaluation of direct thrombin and factor Xa inhibitors with antiplatelet agents under flow and static conditions: an in vitro flow chamber model. PLoS One. 2014;9:e86491. [DOI] [PMC free article] [PubMed] [Google Scholar]
- 31. Semeraro F, Incampo F, Ammollo CT, et al. Dabigatran but not rivaroxaban or apixaban treatment decreases fibrinolytic resistance in patients with atrial fibrillation. Thromb Res. 2016;138:22–9. [DOI] [PubMed] [Google Scholar]
- 32. Mann KG, Brummel K, Butenas S. What is all that thrombin for? J Thromb Haemost. 2003;1:1504–14. [DOI] [PubMed] [Google Scholar]
- 33. Collet JP, Mishal Z, Vasse M, et al. Pharmacological approaches of fibrin gel architecture modulation and thrombus degradation: its implication in atherogenesis and thromboembolism disease. Thromb Res. 1994;75:353–9. [DOI] [PubMed] [Google Scholar]
- 34. Yeromonahos C, Marlu R, Polack B, Caton F. Antithrombin‐independent effects of heparins on fibrin clot nanostructure. Arterioscler Thromb Vasc Biol. 2012;32:1320–4. [DOI] [PubMed] [Google Scholar]