

Abstract
Background
Upon platelet activation, a subpopulation of procoagulant platelets is formed, characterized by the exposure of the anionic aminophospholipid phosphatidylserine (PS) on the surface membrane.
Objective
To evaluate procoagulant PS‐exposing platelets by imaging flow cytometry.
Methods
Platelet ultrastructure was examined by transmission electron microscopy, and a comprehensive analysis of procoagulant platelets was performed using imaging flow cytometry; platelets were fluorescently labeled for the markers glycoprotein (GP)IX, activated integrin αIIbβ3, CD62P, and PS exposure.
Results
A subpopulation of platelets stimulated in suspension by the physiological agonists thrombin+collagen, and all platelets stimulated by the calcium ionophore A23187, had a distinct round morphology. These platelets were PS‐exposing, larger in size, had an increased circularity index, and had reduced internal complexity compared with non‐PS‐exposing platelets. They expressed CD62P and αIIbβ3 in an inactive conformation on the surface, and demonstrated depolarized inner mitochondrial membranes. For the first time, using imaging flow cytometry, a large proportion of PS‐exposing platelets possessing platelet‐associated extracellular vesicles (EVs) was observed, which demonstrated heterogeneous platelet marker expression that was different from free released EVs.
Conclusions
Innovative imaging flow cytometry allowed detailed fluorescence‐based, quantitative morphometric analysis of PS‐exposing platelets; in becoming procoagulant, platelets undergo remarkable morphological changes, transforming into spherical “balloons,” almost devoid of their normal internal architecture. Almost all PS‐exposing platelets have associated EVs that are not detectable by traditional flow cytometry. While their functions have yet to be fully elucidated, the heterogeneity of platelet‐associated and released EVs suggests that they may contribute to different aspects of hemostasis and of thrombosis.
Keywords: blood platelets, extracellular vesicles, flow cytometry, phosphatidylserines, platelet activation
Essentials.
Upon activation, phosphatidylserine (PS) is exposed on the surface of a platelet subpopulation.
PS‐exposing platelets were evaluated in suspension by high resolution imaging flow cytometry.
In becoming procoagulant, platelets are transformed into distinct round balloon‐like structures.
A large proportion of procoagulant PS‐exposing platelets possess associated extracellular vesicles.
1. INTRODUCTION
Platelets are physiologically heterogeneous, and platelet reactivity and responses are diverse. As a result, following platelet stimulation, discrete subpopulations are formed.1 Procoagulant platelets are one such subpopulation,2, 3 the nomenclature of which varies in the literature from collagen/convulxin and thrombin‐activated (COAT/COATED) platelets,4, 5, 6 to necrotic platelets,7 SCIPs (sustained calcium‐induced platelet morphology),8 superactivated,9 and zombie platelets.10 The procoagulant surface of activated platelets results from loss of normal membrane phospholipid bilayer asymmetry in resting platelets; upon stimulation, the anionic aminophospholipid phosphatidylserine (PS) is translocated from the inner membrane leaflet, where it is normally sequestered, to the outer leaflet.1, 2 Negatively charged PS facilitates assembly of the intrinsic tenase and prothrombinase coagulation complexes on the activated platelet surface, thereby accelerating thrombin generation.2 Impaired platelet PS exposure in the rare congenital disorder Scott syndrome is associated with moderate/severe bleeding symptoms.2, 11, 12 A critical role has emerged for the procoagulant platelet subpopulation in regulating both normal hemostasis and pathological thrombus formation.1, 3 Indeed, we have previously demonstrated that PS exposure on activated platelets persists in vitro,13 and in vivo,14 and that blocking the procoagulant surface inhibits platelet‐mediated events in experimentally induced arterial thrombosis.15
Adherent procoagulant platelets have been observed, by various imaging techniques, to adopt a unique morphology. Using phase‐contrast video imaging, Heemskerk and colleagues described platelets transforming into blebbing, balloon‐like structures when adhered to collagen, but not fibrinogen.16 Similarly, transmission electron microscopy (TEM) imaging of cryo‐prepared samples demonstrated the formation of spherical to ovoid balloon‐like structures, with highly “dilute” cytoplasm and few inclusions, following platelet adhesion to collagen/collagen‐related peptide.17 Subsequently, Munnix et al18 identified that bleb‐shaped platelets adhered to collagen were PS‐exposing, as indicated by annexin A5 binding; a recent study confirmed this finding for ballooned platelets using four‐dimensional live‐cell confocal microscopy, and described the mechanism involved in ballooning, that of fluid entry into platelets.19
Flow cytometric analysis of PS‐exposing platelets in suspension using fluorescently‐labeled annexin A5, first described over two decades ago,20 has become widely used in studies of procoagulant platelets and platelet‐derived extracellular vesicles (EVs).4, 21, 22, 23, 24, 25 A limitation of traditional flow cytometry is the lack of images of individual analyzed cells. Imaging flow cytometry combines the high‐throughput features of traditional flow cytometry with high resolution images provided by a charge‐coupled device (CCD) camera that operates with a pixel size of 0.1 μm2 with 60× magnification and advanced image analysis software, making it an innovative tool for accurate quantitative analysis of standard flow cytometry parameters, as well as morphological characteristics of cells.26 Recently, imaging flow cytometry has been used to study a variety of cell types,27, 28, 29, 30 including platelet‐leukocyte aggregates,31, 32, 33 and has been proposed as a reliable technique that can overcome the challenges currently faced in EV research.34
Here, using TEM, we identified that a distinct subpopulation of platelets stimulated in suspension with a combination of the physiological agonists thrombin and collagen, and most platelets stimulated with the calcium ionophore A23187, had a unique round, balloon‐like morphology. Then, using imaging flow cytometry to examine this morphologically distinct platelet population in suspension, we determined that the round balloon‐like platelets were PS‐exposing, and showed, for the first time, that the majority possessed EVs associated with the PS‐exposing platelet surface. A comprehensive characterization of the procoagulant PS‐exposing subpopulation of platelets, their associated EVs, and EVs released from platelets was performed.
2. MATERIALS AND METHODS
2.1. Washed platelet preparation and stimulation
Blood was drawn from four different healthy volunteers who had not taken medications affecting platelet function for at least two weeks prior to blood donation. Informed consent was obtained under The Hospital for Sick Children Research Ethics Board approval.
Blood was collected into acid‐citrate‐dextrose anticoagulant; washed platelets, prepared as described previously,13, 35 were suspended in Tyrode solution (137 mmol/L NaCl, 2.7 mmol/L KCl, 11.9 mmol/L NaHCO3, 0.42 mmol/L NaH2PO4, 1 mmol/L MgCl2, 2 mmol/L CaCl2, and 5.5 mmol/L glucose) with 5 mmol/L HEPES, 0.35% BSA (fraction V) (MP Biomedicals, LLC, Santa Ana, CA) and apyrase (prepared from potatoes by a slight modification of the method of Molnar and Lorand,36 and used as described elsewhere35, 37), pH7.4. The platelet count was adjusted to 1 × 10⁹/mL and platelets were stimulated with a combination of the physiological agonists thrombin (1 U/mL) (Haematologic Technologies Inc., Essex Junction, VT) and collagen (10 μg/mL) (Horm, native type I collagen fibrils from equine tendon) (Takeda, Munich, Germany), or the nonphysiological calcium ionophore A23187 (3 μmol/L) (Sigma‐Aldrich, St. Louis, MO) that directly increases intracellular Ca2+ concentrations, as described previously.13
2.2. Transmission electron microscopy
TEM sample preparation was followed as described previously,38 with minor modifications. Briefly, suspensions of washed platelets, resting or stimulated as above, were pre‐fixed in 0.1% glutaraldehyde/phosphate‐buffered saline (PBS) (1:1) for 15 minutes, before centrifuging to pellet at 800 g for 10 minutes. The platelet pellet was fixed in 2.5% glutaraldehyde/PBS for at least 60 minutes, post‐fixed in 1% OsO4 for 60 minutes, washed twice in distilled H2O, then dehydrated in a graded series of acetone (50%, 70%, 90% acetone: 2 × 10 minutes; 100% acetone: 2 × 15 minutes). The pellet was incubated in 100% acetone/Epon resin (1:1) for 60 minutes, and then polymerized in pure Epon resin in a BEEM embedding capsule for 1‐3 days at 60°C. Blocks were sectioned, mounted on copper grids, and stained with uranyl acetate followed by lead citrate. Electron micrographs were obtained using a JEM‐1011 (JEOL USA, Inc., Peabody, MA) or a Philips CM10 (Philips Analytical, Eindhoven, the Netherlands) electron microscope. Digital images were captured using a side‐mounted Advantage HR CCD camera (Advanced Microscopy Techniques, Corp. (AMT), Woburn, MA). Platelet quantitation from TEM micrographs was performed using ImageJ software (National Institutes of Health, Bethesda, MD).
2.3. Imaging flow cytometry
Resting, and thrombin+collagen‐ (T+C‐) or A23187‐stimulated platelets (2 μL) were labeled with the platelet marker anti‐CD42a‐eFluor 450 (eF450) (anti‐platelet glycoprotein [GP]IX) (Thermo Fisher Scientific, Waltham, MA), and the platelet activation markers PAC1‐FITC (integrin αIIbβ3 [GPIIb‐IIIa] activation) (BD Biosciences, San Jose, CA; 2 μL), anti‐CD62P‐PE (P‐selectin expression) (BD Biosciences; 2 μL) and annexin A5‐Alexa Fluor 647 (AF647) (phosphatidylserine [PS]‐exposure) (Thermo Fisher Scientific; 1 μL). Platelet inner mitochondrial membrane potential (ΔΨm) was assessed with tetramethylrhodamine methyl ester (TMRM) (Thermo Fisher Scientific; 1 μL/100 nmol/L). Samples were incubated in a final volume of 30 μL Tyrode solution without BSA for 30 minutes in the dark, at room temperature. Samples were acquired on an Amnis ImageStreamX Mark II (ISX) multispectral imaging flow cytometer using INSPIRE software (MilliporeSigma, Seattle, WA). A minimum of 150 000 events per sample was acquired, with low flow rate/high sensitivity. Data were acquired with 60× magnification, at which the ISx charge‐coupled device (CCD) camera operates with a pixel size of 0.1 μm2 (or 0.3 μm pixel diameter). Images were acquired using bright field illumination and the excitation lasers 405, 488, 561, 642, and 785 nm. Bright field (BF) was collected in channels (Ch) 01 and 09 (two BF channels were used to monitor camera alignment), dark field (side scatter) was collected in Ch 06; fluorescence was detected in the relevant channels (see following). Two staining panels were used: (a) PAC1‐FITC (Ch 02), TMRM (Ch 03), anti‐CD42a‐eF450 (Ch 07), and annexin A5‐AF647 (Ch 11); and (b) PAC1‐FITC (Ch 02), anti‐CD62P‐PE (Ch 03), anti‐CD42a‐eF450 (Ch 07) and annexin A5‐AF647 (Ch 11). Single‐stained controls were used for compensation matrix calculations, and relevant fluorescence minus one (FMO) controls were used to discriminate true positive vs negative events.
2.4. Imaging flow cytometry data analysis
2.4.1. Platelets and released EVs
A comprehensive analysis of data acquired on the ISX was performed using IDEAS software (MilliporeSigma); data analysis features including their categories are described in Table S1. Appropriate compensation matrices were applied to the raw data and data analysis files were created. Fluorescence saturated, clipped, and unfocused events were excluded from the analysis, based on raw max pixel, raw centroid X and gradient max feature values, respectively. For resting, and T+C‐ or A23187‐stimulated platelets, density plots of area (BF) vs aspect ratio intensity (BF) (Figure 1A) were used to identify and gate single platelets and released EVs (Figure 1B); each gated population was analyzed independently. Irregularly‐shaped objects with an aspect ratio intensity <0.6, and an area >10 μm2, including platelets with long extended filopodia, platelet doublets, small aggregates and other debris, were excluded from the analysis, ie, ungated objects (Figure 1B). Platelets and released EVs populations were examined according to platelet marker fluorescence intensity, as well as features in the size, shape and texture categories (Table S1). Default masks, ie, the sets of pixels that contain the region of interest, which are automatically created in IDEAS, were adjusted using the “erode” mask feature to remove the desired number of pixels from all edges of the default mask; tightly fitting object masks minimize the fluorescence halo effect, which could result in artifactual size measurements. Area and circularity measurements were based on anti‐CD42a‐eF450 fluorescence, while bright detail intensity was based on dark field/side scatter.
Figure 1.
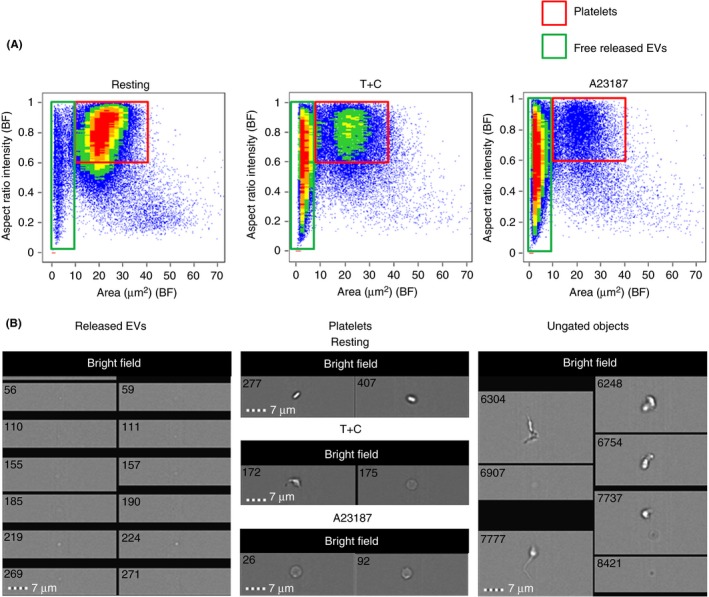
Flow cytometric gating strategies for resting and thrombin+collagen‐ (T+C‐) or A23187‐stimulated platelets, and for released extracellular vesicles (EVs). (A) Density plots, acquired by imaging flow cytometry, illustrating the gating of platelet and released EV populations based on area (bright field; BF) and aspect ratio (BF), and (B) corresponding bright field images. Ungated objects were excluded from the analysis; these included platelet doublets or small aggregates, as well as unidentified debris. Representative of n = 4 independent experiments
2.4.2. Platelet‐associated EVs
Data regarding the PS‐exposing subpopulations of T+C‐ or A23187‐stimulated platelets were extracted from the original data files and new data files were created. A platelet‐associated EV was visualized as a small area, or spot, on the platelet with a fluorescence intensity greater than that of the entire platelet. Firstly, a “truth” population, ie, a population that is a positive representation of the phenotype of interest, of 10‐20 platelets that possessed an associated EV was identified and tagged by visually examining fluorescent images of the platelets. For example, a truth population that possessed CD42a+ EVs was defined based on images in Ch 07 that showed the presence of small spots of high fluorescence intensity. This truth population and the whole PS‐exposing platelet population were plotted on a scatter plot of area vs median pixel intensity (Table S1). All objects that colocalized with the truth population on the scatter plot were gated, and identified as platelets possessing associated EVs. The number of associated EVs per platelet was calculated using the spot count feature (Table S1). This analysis was performed for each platelet marker (PAC1, CD62P, CD42a, and annexin A5), independently.
2.5. Statistical analyses
Values reported are mean ± SEM. Statistical analyses were performed using GraphPad Prism 5 software (GraphPad Software Inc., La Jolla, CA) by t tests or one‐way ANOVA with a Bonferroni post‐hoc test. A value of P < 0.05 was considered statistically significant.
3. RESULTS
3.1. Transmission electron microscopy
3.1.1. A subpopulation of T+C‐ stimulated and the majority of A23187‐stimulated platelets have an altered morphology
The morphology of resting, and T+C‐ or A23187‐stimulated platelets was assessed by TEM. As expected, resting platelets were discoid with intact internal structures (Figure 2A [i]), while the majority of T+C‐stimulated platelets had lost their discoid shape and had extended filopodia (Figure 2A [ii]). However, the shape and ultrastructure of a subpopulation of T+C‐ and the majority of A23187‐stimulated platelets were dramatically transformed; they were spherical and balloon‐like, with the cytoplasm almost completely devoid of granules, organelles or other typical internal ultrastructure components (Figure 2A [ii] and [iii]).
Figure 2.
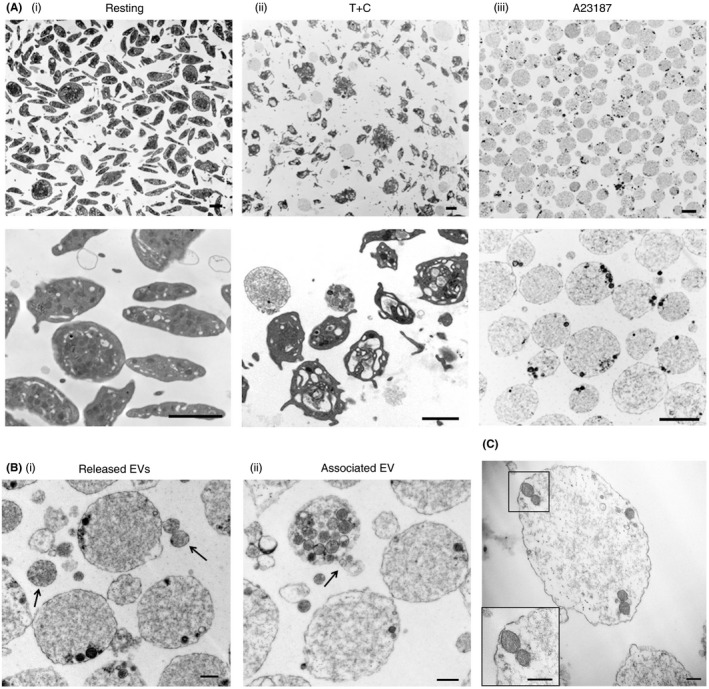
Platelets stimulated by thrombin+collagen (T+C) or A23187 in suspension undergo dramatic morphological changes. Transmission electron micrographs illustrating: (A) (i) Control, resting platelets, and (ii) morphological changes in platelets stimulated with T+C, or (iii) the calcium ionophore A23187, at lower magnification (upper panels) and higher magnification (lower panels). A subpopulation of T+C‐ and most A23187‐stimulated platelets were transformed to round, empty balloon‐like structures. Scale bars represent 2 μm; representative of n = 3 independent experiments. (B) Extracellular vesicles (EVs) (i) released from, and (ii) associated with, round platelets stimulated with A23187, as indicated by the arrows. Scale bars represent 0.5 μm; representative of n = 3 independent experiments. (C) Organelles remaining in round platelets stimulated with T+C or A23187 include mitochondria. Inset shows the double membrane and cristae characteristic of mitochondria. Scale bars represent 0.2 μm; representative of n = 3 independent experiments
Small EVs ranging in diameter from 0.1 to 1 μm were observed in the vicinity of stimulated platelets (Figure 2B [i]) or, in some cases, associated with the surface membrane of the balloon‐like platelets (Figure 2B [ii]).
3.1.2. Mitochondria are among the remaining organelles/granules in the morphologically unique platelets
The round balloon‐like platelets were further examined to gain insight into the nature of the remaining ultrastructural features. 63.6 ± 5.8% and 28.0 ± 2.7% of the balloon‐like platelets activated by T+C and A23187, respectively, appeared empty except for amorphous cytoplasm. Of the remainder, essentially all T+C‐stimulated platelets and 90% of A23187‐stimulated platelets had granules/organelles located at the periphery only, with 10% of the A23187‐stimulated platelets having granules/organelles distributed throughout the cytoplasm. Some of these structures were identified as mitochondria, distinguished by the presence of characteristic double membranes and cristae (Figure 2C).
3.2. Imaging flow cytometry
3.2.1. A PS+ subpopulation of T+C‐ or A23187‐stimulated platelets is significantly larger in size and has a significantly higher circularity index than PS− platelets
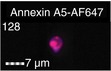
Imaging flow cytometry was used as a novel technique to further examine and quantitate the size and shape of T+C‐ or A23187‐stimulated platelets. Distinct round balloon‐like platelets were detected by bright field in T+C‐ or A23187‐stimulated platelets, similar to those observed by TEM (Figure 3A). Annexin A5‐AF647 labeling demonstrated that only this subpopulation had the aminophospholipid PS exposed on the platelet surface (Figure 3B). The PS+ population was divided into a PS+ (intermediate) subpopulation and a PS+ (high) subpopulation, based on the intensity of annexin A5‐AF647 binding (Figure S1). In this study, we focused on this PS+ (high) subpopulation that accounted for 9.1 ± 4.0% and 31.1 ± 1.2% of T+C‐ and A23187‐stimulated platelets, respectively. Essentially all resting platelets (98.0 ± 0.2%) were PS−. Analysis of resting and stimulated platelets demonstrated that T+C (PS+) or A23187 (PS+) platelets were slightly, but significantly, larger in area (μm2) compared with T+C (PS−) or resting (PS−) platelets (P < 0.01) (Figure 3C [i]). As measured using the circularity feature (Table S1), T+C (PS+) and A23187 (PS+) platelets had a significantly higher circularity index than T+C (PS−) or resting (PS−) platelets (P < 0.001) (Figure 3C [ii]).
Figure 3.
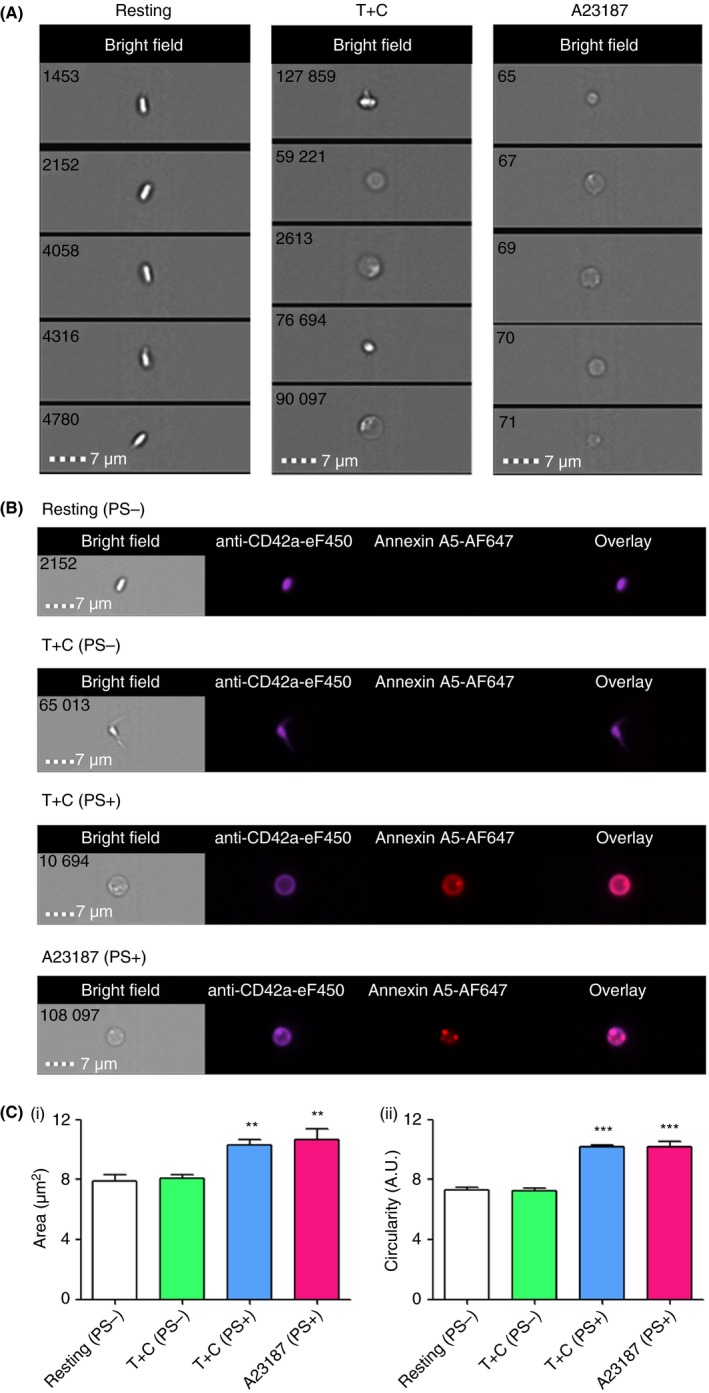
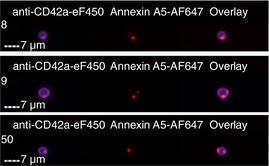
PS‐exposing (PS+) balloon‐like platelets produced upon stimulation by thrombin+collagen (T+C) or A23187 are significantly larger in size and have increased circularity index compared with PS‐negative (PS−) platelets. (A) Bright field images, acquired by imaging flow cytometry, illustrating that round balloon‐like platelets, similar to those observed by TEM, were present in T+C‐ or A23187‐stimulated platelets. (B) Round balloon‐like platelets produced upon stimulation by T+C or A23187 exposed phosphatidylserine (PS) on the surface. Platelets were identified with the platelet marker anti‐CD42a‐eF450 that binds platelet GPIX; PS exposure was measured by the binding of annexin A5‐AF647. Overlay shows a merged image of the anti‐CD42a and annexin A5 fluorescent images. (C) T+C (PS+) and A23187 (PS+) platelets were (i) significantly larger (area; μm2), and (ii) more circular than resting (PS−) or T+C (PS−) platelets. Data are mean ± SEM, **P < 0.01, ***P < 0.001, compared with T+C (PS−) or resting (PS−) platelets. Images are representative of n = 4 independent experiments
3.2.2. PS+ platelets express CD62P and integrin αIIbβ3 in an inactive conformation on the surface, demonstrate depolarized inner mitochondrial membranes, and have significantly reduced internal complexity compared with PS− platelets
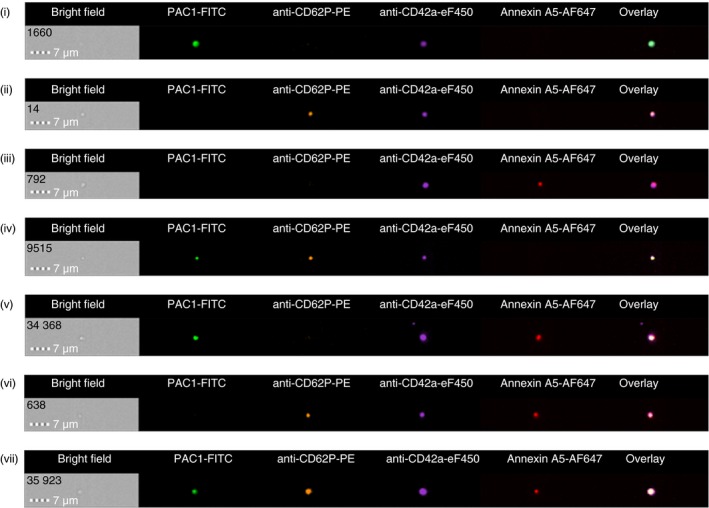
The physiological characteristics of PS+ platelets were further evaluated with a number of fluorescent platelet markers. Stimulation by T+C or A23187 significantly increased the percentage of CD62P‐expressing platelets compared with resting (PS−) platelets (P < 0.05‐0.001); however, there was no significant difference between T+C (PS+) or A23187 (PS+) and T+C (PS−) platelets (Figure 4A, D [i]). A significantly higher percentage of T+C (PS−) (94.8 ± 1.6%) or resting (PS−) (96.4 ± 1.9%) platelets were TMRM+, compared with T+C (PS+) (16.0 ± 0.9%) and A23187 (PS+) (6.2 ± 0.7%) platelets, indicating that PS+ platelets demonstrated depolarized inner mitochondrial membranes (Figure 4B, D [ii]). The percentage of PAC1+ platelets was lower in T+C (PS+) and A23187 (PS+) platelets compared with T+C (PS−) (7.3 ± 0.9% and 6.6 ± 2.3% vs 19.2 ± 6.2%) (Figure 4A, B and D [iii]). Furthermore, using texture features based on dark field intensity and dark field bright detail intensity (Table S1), T+C (PS+) and A23187 (PS+) platelets demonstrated significantly decreased internal complexity compared with T+C (PS−) or resting (PS−) platelets (P < 0.001) (Figure 4A, B, C).
Figure 4.
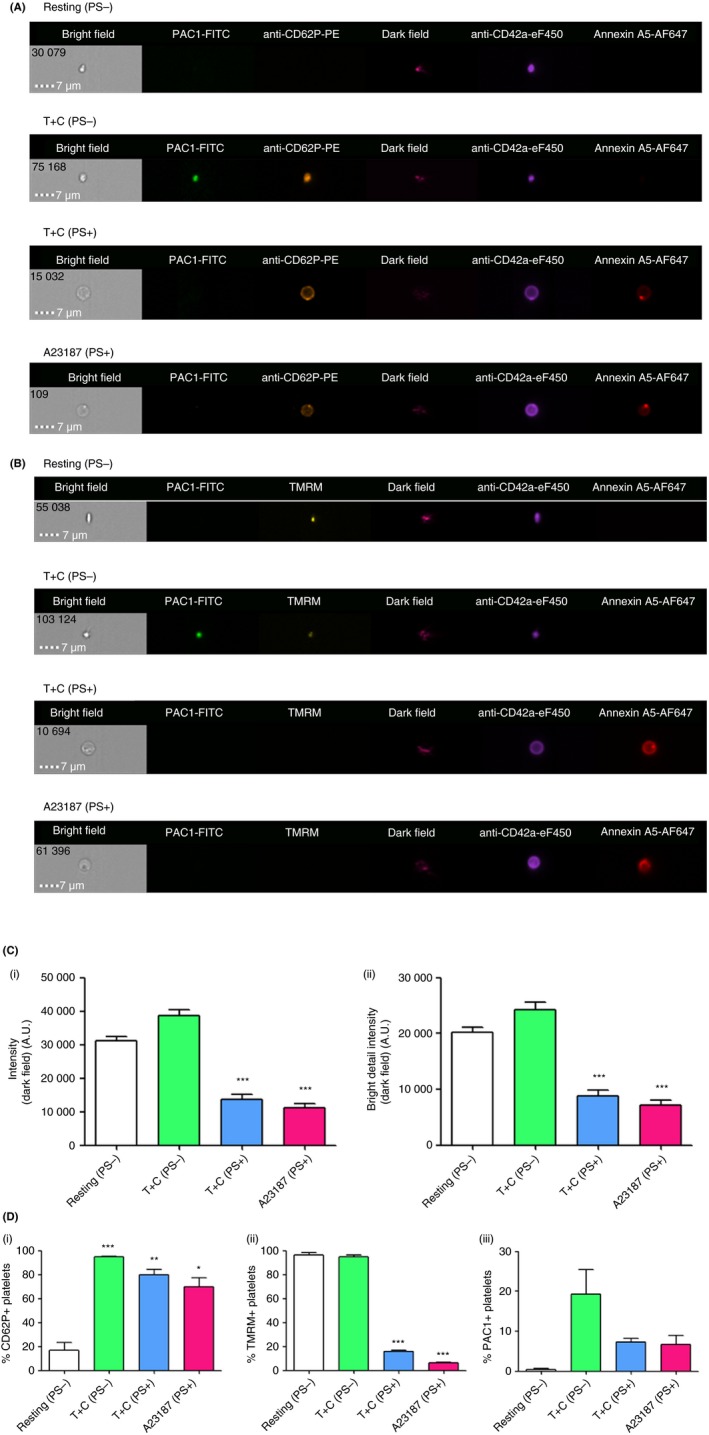
PS‐exposing (PS+) platelets produced upon stimulation by thrombin+collagen (T+C) or A23187 express CD62P and integrin αIIbβ3 in an inactive conformation on the surface, have decreased internal complexity, and demonstrate depolarized inner mitochondrial membranes. (A) Images, acquired by imaging flow cytometry, of resting (PS−), T+C (PS−), T+C (PS+) and A23187 (PS+) platelets illustrating bright and dark field views, as well as PAC1‐FITC, anti‐CD62P‐PE (or (B) TMRM), anti‐CD42a‐eFluor450 and annexin A5‐AF647 binding. (C) T+C (PS+) and A23187 (PS+) platelets were significantly less internally complex (as measured by both (i) dark field intensity, and (ii) dark field bright detail intensity) than resting (PS−) or T+C (PS−). (D) (i) The percentages of T+C (PS+) or A23187 (PS+) platelets expressing CD62P on the surface were significantly increased compared with resting (PS−) platelets, but were similar compared to T+C (PS−) platelets. (ii) The percentages of T+C (PS+) and A23187 (PS+) platelets that were TMRM+ were significantly lower compared with resting (PS−) or T+C (PS−) platelets, indicating a decrease in mitochondrial membrane potential (ΔΨm) in the PS+ platelet subpopulations. (iii) The percentages of T+C (PS+) and A23187 (PS+) platelets that were positive for PAC1, a marker of activated integrin αIIbβ3, tended to be lower compared with T+C (PS−) platelets. Data are mean ± SEM,*P < 0.05, **P < 0.01, ***P < 0.001, compared with T+C (PS−) or resting (PS−) platelets. Images are representative of n = 4 independent experiments
3.2.3. A large proportion of PS+ platelets possess associated EVs, which demonstrate heterogeneity in platelet marker expression
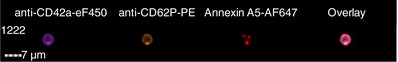
Respectively, 92.0 ± 1.6% and 97.1 ± 0.7% of T+C (PS+) and A23187 (PS+) platelets, possessed at least one associated EV (Figure 5A [i]). In contrast, the percentage of resting (PS−) and T+C (PS−) with associated EVs was negligible. The number of associated EVs per PS+ platelet ranged from one to eight, with the majority of PS+ platelets possessing one or two associated EVs (T+C: 80.2 ± 1.0%; A23187: 72.8 ± 2.5%) (Figure 5A [ii]). Platelets tended to possess multiple CD62P+ EVs, while usually only possessing one or two CD42a+, PS+ or PAC1+ EVs (Figure 5B). Interestingly, platelet‐associated EV size (area; μm2) varied depending on marker expression. PAC1+ only or PS+ only associated EVs were smaller than those that were CD42a+ only or CD62P+ only; for example, 0.4 ± 0.1 μm2 vs 1.2 ± 0.1 μm2 for PAC1+ and CD42a+ associated EVs (T+C), respectively (Figure 5A [iii]). Platelet‐associated EVs were heterogeneous in platelet marker expression, binding markers in various combinations of up to all four (Table 1 A and B, and S2). A large proportion of platelet‐associated EVs, 57%‐77% were CD42a+, CD62P+ or PS+, while only 22.9 ± 4.8% (T+C) and 22.0 ± 5.2% (A23187) of associated EVs were PAC1+ (Table 1A). Platelets with associated EVs positive for three markers (CD42a, CD62P, and PS) were in the highest proportion: 23.1 ± 5.2% (T+C) and 29.4 ± 4.0% (A23187), while only 9.7 ± 3.1% (T+C) and 9.0 ± 1.2% (A23187) possessed EVs that were positive for all four markers (Table 1B and S2).
Figure 5.
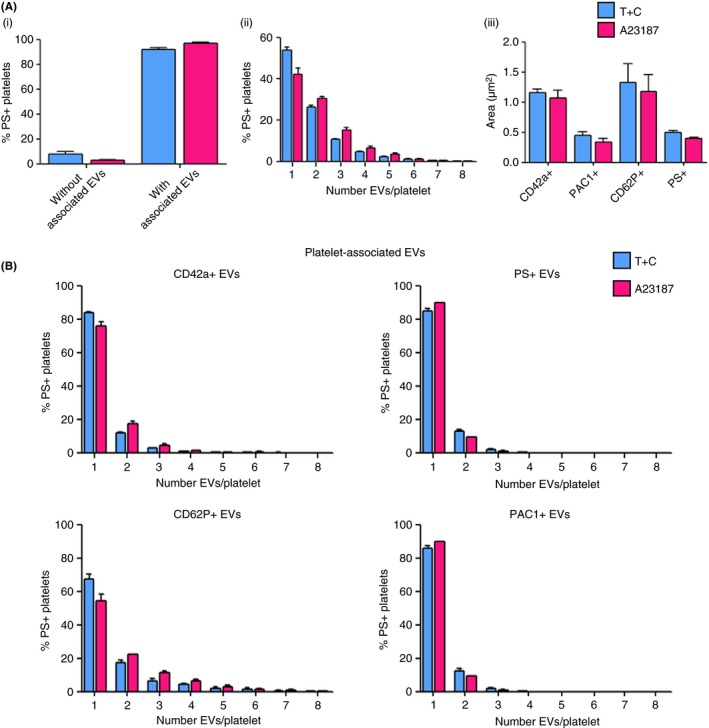
A large proportion of PS‐exposing platelets produced upon stimulation by thrombin+collagen (T+C) or A23187 possess extracellular vesicles (EVs), which demonstrate heterogeneity in platelet marker expression. (A) (i) Almost all T+C (PS+) or A23187 (PS+) platelets had EVs associated with the platelet surface; (ii) T+C and A23187 (PS+) platelets had between one and eight associated EVs per platelet; (iii) Annexin A5+ (PS+) or PAC1+ platelet‐associated EVs were smaller in size (area; μm2) compared with CD42a+ or CD62P+ associated EVs. (B) The number of EVs per platelet was assessed for each platelet marker individually. The majority of platelets that possessed associated EVs positive for CD42a, annexin A5 or PAC1 had just one or two EVs per platelet, while platelets tended to possess multiple CD62P+ EVs. Data are mean ± SEM, n = 4
Table 1.
EVs associated with T+C‐ or A23187‐stimulated PS+ platelets
| Platelet‐associated EV marker | T+C (PS+ platelets) | A23187 (PS+ platelets) | |
|---|---|---|---|
| (A) Percentages binding specific platelet markers | |||
| CD42a+ | 60.1 ± 1.6% (a3.3 ± 0.5%) | 67.8 ± 3.4% (a3.8 ± 0.6%) |
|
| PAC1+ | 22.9 ± 4.8% (a1.7 ± 0.9%) | 22.0 ± 5.2% (a1.1 ± 0.5%) |
|
| CD62P+ | 56.8 ± 9.9% (a4.0 ± 2.3%) | 67.0 ± 2.1% (a3.2 ± 1.0%) |
|
| PS+ | 72.9 ± 5.2% (a12.0 ± 4.0%) | 76.9 ± 6.2% (a8.6 ± 0.6%) |
|
| (B) Percentages binding specific combinations of platelet markers (values >5% are presented) | |||
| CD42a+ and PS+ | 12.2 ± 4.5% | 11.8 ± 3.6% |
|
| CD42a+ and CD62P+ | 6.5 ± 2.4% | 6.6 ± 1.2% |
|
| PS+ and CD62P+ | 8.0 ± 2.2% | 11.7 ± 1.9% |
|
| CD42a+, CD62P+, and PS+ | 23.1 ± 5.2% | 29.4 ± 4.0% |
|
| CD42a+, PAC1+, CD62P+, and PS+ | 9.7 ± 3.1% | 9.0 ± 1.2% |
|
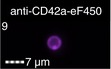
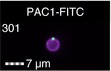
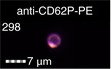
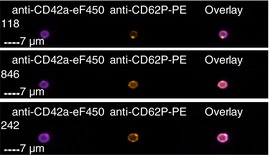
Images are representative of PS+ platelets stimulated by T+C or A23187 in n = 4 independent experiments. (A) All images show anti‐CD42a‐eF450 fluorescence (to illustrate the platelet with which the EV is associated), as well as the marker for associated EVs as indicated.
(B) Overlay is a merged image of each of the fluorescent images shown. As illustrated, platelets may have one associated EV positive for multiple markers, ie, colocalized, or multiple EVs positive for one or more markers. EV, extracellular vesicle; PS+, phosphatidylserine positive; T+C, thrombin+collagen.
EVs positive for only the marker stated and negative for all other markers.
Data are mean ± SEM.
3.2.4. Free EVs released from platelets upon stimulation with T+C or A23187 are heterogeneous, but differ from platelet‐associated EVs in their expression of platelet markers
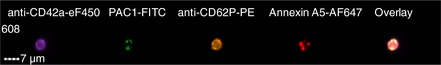
EVs released from platelets stimulated by T+C or A23187 were also characterized using imaging flow cytometry, examining their binding of anti‐CD42a, PAC1, anti‐CD62P, and annexin A5 (Figure 6). Bright field images illustrate the size and shape of released EVs (Figure 6). One hundred percent were positive for the platelet marker CD42a. In contrast with the platelet‐associated EVs, in which only 3.3 ± 0.5% and 3.8 ± 0.6% of EVs associated with T+C‐ and A23187‐stimulated platelets, respectively, were CD42a+ alone (Table 1A), 55.5 ± 8.0% and 58.9 ± 7.1% of EVs released from T+C and A23187‐stimulated platelets, respectively, were CD42a+ only, and negative for PAC1, CD62P, or PS (Table 2). A large proportion of the remaining released EVs (38.7 ± 9.0% from T+C, and 38.2 ± 7.2% from A23187‐stimulated platelets) were CD62P+, with a small percentage of PAC1+ EVs (1.3 ± 0.4% from T+C‐ and 0.5 ± 0.1% from A23187‐stimulated platelets) (Table 2). Interestingly, the percentage of PS+ released EVs was significantly less than the percentage of PS+ platelet‐associated EVs; 11.4 ± 1.8% (T+C) and 6.5 ± 1.7% (A23187) released EVs were PS+ (Table 2), compared with 72.9 ± 5.2% (T+C) and 76.9 ± 6.2% (A23187) of platelet‐associated EVs (Table 1A).
Figure 6.
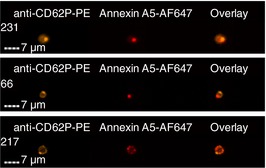
Free extracellular vesicles (EVs) released from platelets stimulated by thrombin+collagen (T+C) or A23187 express platelet markers heterogeneously, but differ from platelet‐associated EVs. Images of EVs released from platelets stimulated by thrombin+collagen (T+C) or A23187 acquired by imaging flow cytometry, showing bright field views, as well as PAC1‐FITC, anti‐CD62P‐PE, anti‐CD42a‐eFluor450, and annexin A5‐AF647 binding. 100% of released EVs were CD42a+. Some released EVs were (i) CD42a+ and PAC1+, (ii) CD62P+, or (iii) annexin A5+ (PS+), while others (iv‐vi) were CD42a+ and positive for two of the markers, or (vii) all three of the markers. The overlay is a merged image of each of the fluorescent images shown. Images are representative of n = 4 independent experiments
Table 2.
Characterization of free EVs released upon platelet stimulation by T+C or A23187
| Released EV marker | T+C | A23187 |
|---|---|---|
| CD42a+ | 100% (55.5 ± 8.0%) | 100% (58.9 ± 7.1%) |
| PAC1+ | 1.3 ± 0.4% (a0.4 ± 0.2%) | 0.5 ± 0.1% (a0.2 ± 0%) |
| CD62P+ | 38.7 ± 9.0% (a30.9 ± 8.2%) | 38.2 ± 7.2% (a33.3 ± 6.2%) |
| PS+ | 11.4 ± 1.8% (a4.3 ± 0.8%) | 6.5 ± 1.7% (a2.2 ± 0.4%) |
| PAC1+ and PS+ | 0.1 ± 0% | 0% |
| PAC1+ and CD62P+ | 0.5 ± 0.3% | 0.2 ± 0% |
| CD62P+ and PS+ | 6.6 ± 1.5% | 4.2 ± 1.4% |
| PAC1+, CD62P+, and PS+ | 0.2 ± 0.1% | 0.1 ± 0% |
100% of released EVs were CD42a+. 55.5 ± 8.0% and 58.9 ± 7.1% of EVs released from T+C‐ and A23187‐stimulated platelets, respectively, were CD42a+ only, and negative for all other markers. EV, extracellular vesicle; PS+, phosphatidylserine positive; T+C, thrombin+collagen.
Released EVs were CD42a+ and positive for the marker stated and negative for all other markers. Data are mean ± SEM, n = 4.
4. DISCUSSION
Adherent procoagulant platelets have been morphologically described as blebbing16, 18 or fragile balloon‐like structures.17, 19 Based on the ultrastructural appearance of platelets adherent to surfaces such as collagen or collagen‐related peptide, Hess and Siljander17 subdivided the balloon‐like structures into those that possessed a highly “dilute” cytoplasm with few inclusions, and those that possessed a moderately dense cytoplasm with a higher number of recognizable organelles, which occurred less frequently. The morphology of procoagulant platelets in suspension has been studied less closely. In this study, we examined procoagulant platelets formed in response to the physiologically‐relevant combination of agonists, thrombin and collagen (T+C), and the non‐physiological calcium ionophore A23187 that directly increases intracellular Ca2+ levels. The observations with A23187 are relevant to platelet responses in vivo because the formation of procoagulant platelets relies on sustained increases in intracellular Ca2+.
Using TEM, we observed that a subpopulation of platelets stimulated with T+C, and most platelets stimulated with A23187, in suspension, formed round balloon‐like structures. The majority of T+C‐stimulated round balloon‐like platelets were empty, while the remainder, as well as the majority of A23187‐stimulated platelets, contained few granules/organelles, usually localized peripherally. Some of these internal structures were identified as mitochondria based on their characteristic membrane appearance. Gerrard et al39 observed similarly altered ultrastructure of A23187‐stimulated platelets in suspension by electron microscopy, and reported that platelets exposed to high A23187 concentrations lost their alpha and dense granules, and often had the cytoplasmic gel concentrated in a dense mass, with swollen membranes that were pulled away from the cell contents. We observed extracellular vesicles (EVs) in T+C‐ or A23187‐stimulated conditions; in some cases, these EVs appeared to be associated with or blebbing from the platelet surface, similar to the EVs budding from platelets incubated in the presence of fibroblast‐like synoviocytes observed by Boilard et al40 and from platelets activated with thrombin observed by Ponomareva et al,41 suggesting that the free EVs had been released from the balloon platelets.
While traditional flow cytometry has been successfully used to study procoagulant platelets, imaging flow cytometry has unique features that also allow detailed morphological analysis. In this study, these features were used to identify T+C‐ or A23187‐stimulated platelets that had transformed into round balloon‐like structures, as observed by TEM. These distinct round balloon‐like platelets were confirmed to be PS‐positive (PS+). Cell size is often measured by forward scatter in traditional flow cytometry, though it can be affected by cell refractive index (RI). Size features, based on bright field or fluorescence, in imaging flow cytometry overcome this issue, which is particularly pertinent in our study where the composition, and thus the RI, of procoagulant platelets is dramatically altered. Indeed, we found that PS+ platelets were significantly larger in size than PS‐negative (PS−) platelets, though previous studies using traditional cytometry reported PS+ platelets to be smaller.42, 43, 44 Furthermore, quantitation of platelet internal complexity showed that PS+ platelets were significantly less internally complex than PS− platelets. Interestingly, despite releasing the contents of their granules (as determined by CD62P expression), activated T+C (PS−) platelets displayed internal complexity similar to that of resting platelets. Thus, while the ultrastructure of T+C (PS−) platelets was altered compared to that of resting platelets (as observed by TEM), some intact structures that could be measured by dark field were still present, unlike in PS+ platelets. We found that the percentage of PS+ platelets expressing CD62P on the surface was similar to that of activated (T+C) PS− platelets. In agreement with our previous studies,13 almost all resting and T+C‐ stimulated PS− platelets had intact inner mitochondrial membrane potential, while the majority of PS+ platelets had depolarized mitochondria. PAC1 binding was decreased in PS+ platelets compared with T+C (PS−) platelets, confirming that integrin αIIbβ3 is in a resting conformation on procoagulant platelets, and differentiating this procoagulant platelet subpopulation from pro‐aggregatory platelets.18, 23
It has been reported that the protein “coat” on procoagulant platelet surface is not uniformly distributed, but rather that adhesive proteins, PS and bound coagulation factors are predominantly localized in a small convex region or “cap”22, 45; 85% of procoagulant platelets possess a “cap,” with strictly one per platelet.22 However, recently, it has been shown that the procoagulant activity initially located on the “cap” on the remnant platelet body moves to the balloon platelets.46 Using imaging flow cytometry, we observed that more than 90% of procoagulant PS‐exposing platelets possessed what we termed here, a platelet‐associated EV. Forty to fifty percent of procoagulant platelets possessed only one platelet‐associated EV, while the remaining platelets possessed multiple associated EVs. Interestingly, marker expression heterogeneity between platelets and their associated EVs was observed. Indeed, there was also heterogeneity among EVs associated with the same platelet, ie, a platelet may possess one EV that is positive for only one marker, and another EV that is positive for multiple markers.
Imaging flow cytometry overcomes some of the challenges traditionally associated with studying platelet‐derived free EVs by allowing visual interrogation of each event passing through the flow cell; fluorescent signals of particles below optical resolution that would be otherwise undetectable can be detected by imaging flow cytometry.34 Since EVs are formed from procoagulant platelets following activation, it is anticipated that EVs should retain the properties of the activated platelet membrane. Recent studies have challenged this view, demonstrating diversity among platelet‐derived EVs.41, 47 In keeping with these reports, we observed heterogeneity within the released EV population. Additionally, while released EVs were similar to activated PS+ platelets in terms of expression of activated integrin αIIbβ3, the majority of released EVs were PS−. Furthermore, CD62P expression on released EVs differed from that of activated PS+ platelets; fewer released EVs expressed CD62P compared with PS+ platelets (38% vs 80% [T+C] and 70% [A23187], respectively). The characteristics of released EVs were also different from platelet‐associated EVs; a smaller percentage of released EVs expressed CD62P and activated integrin αIIbβ3, and, most noticeably, the percentage of PS‐exposing released EVs was considerably lower compared with platelet‐associated EVs (7%‐11% vs 72%‐77%, respectively).
In summary, we have demonstrated by TEM that, in becoming procoagulant in suspension, platelets undergo remarkable morphological changes, transforming into spherical “balloons,” almost devoid of their normal internal architecture; this could be quantitated by imaging flow cytometry analysis. These procoagulant platelets are PS‐exposing, express CD62P and integrin αIIbβ3 in an inactive conformation, and have depolarized inner mitochondrial membranes. Furthermore, we found that a large proportion of PS‐exposing platelets have associated EVs that are heterogeneous with respect to expression of CD42a and CD62P, binding of PAC1 and PS exposure, and have a phenotype that differs from platelet‐derived free EVs. Platelet‐associated EVs are not detectable by traditional flow cytometry, but could be evaluated in the present study by the high resolution imaging power of the imaging flow cytometer. Though their exact function has yet to be determined, these platelet‐associated EVs may promote and support platelets to mount and sustain a procoagulant response. Similarly, while the mechanisms underlying EV generation are not fully understood, our findings clearly demonstrate the heterogeneity of released EVs, suggesting that distinct EV subpopulations may contribute to different aspects of hemostasis and of thrombosis.
AUTHOR CONTRIBUTIONS
E.C. Reddy designed and performed research, analyzed and interpreted data, and wrote the manuscript; H. Wang designed and performed research, and edited the manuscript; H. Christensen performed research and edited the manuscript; E. McMillan‐Ward performed research and edited the manuscript; S.J. Israels discussed research, interpreted data, and edited the manuscript; K.W.A. Bang designed research, interpreted data, and edited the manuscript; M.L. Rand designed and supervised research, interpreted data, and wrote the manuscript.
Supporting information
ACKNOWLEDGMENTS
This work was supported by grant G‐14‐0005881 from the Heart and Stroke Foundation of Canada.
RELATIONSHIP DISCLOSURE
The authors have nothing to disclose.
Reddy EC, Wang H, Christensen H, et al. Analysis of procoagulant phosphatidylserine‐exposing platelets by imaging flow cytometry. Res Pract Thromb Haemost. 2018;2:736–750. 10.1002/rth2.12144
REFERENCES
- 1. Baaten CCFM, Ten Cate H, van der Meijden PEJ, Heemskerk JWM. Platelet populations and priming in hematological diseases. Blood Rev. 2017;31:389–99. [DOI] [PubMed] [Google Scholar]
- 2. Zwaal RF, Comfurius P, Bevers EM. Surface exposure of phosphatidylserine in pathological cells. Cell Mol Life Sci. 2005;62:971–88. [DOI] [PubMed] [Google Scholar]
- 3. Agbani EO, Poole AW. Procoagulant platelets: generation, function, and therapeutic targeting in thrombosis. Blood. 2017;130:2171–9. [DOI] [PubMed] [Google Scholar]
- 4. Dale GL, Friese P, Batar P, et al. Stimulated platelets use serotonin to enhance their retention of procoagulant proteins on the cell surface. Nature. 2002;415:175–9. [DOI] [PubMed] [Google Scholar]
- 5. Dale GL. Coated‐platelets: an emerging component of the procoagulant response. J Thromb Haemost. 2005;3:2185–92. [DOI] [PubMed] [Google Scholar]
- 6. Jobe SM, Leo L, Eastvold JS, et al. Role of FcRgamma and factor XIIIA in coated platelet formation. Blood. 2005;106:4146–51. [DOI] [PMC free article] [PubMed] [Google Scholar]
- 7. Jackson SP, Schoenwaelder SM. Procoagulant platelets: are they necrotic? Blood. 2010;116:2011–8. [DOI] [PubMed] [Google Scholar]
- 8. Kulkarni S, Jackson SP. Platelet factor XIII and calpain negatively regulate integrin alphaIIbbeta3 adhesive function and thrombus growth. J Biol Chem. 2004;279:30697–706. [DOI] [PubMed] [Google Scholar]
- 9. Mazepa M, Hoffman M, Monroe D. Superactivated platelets: thrombus regulators, thrombin generators, and potential clinical targets. Arterioscler Thromb Vasc Biol. 2013;33:1747–52. [DOI] [PubMed] [Google Scholar]
- 10. Storrie B. A tip of the cap to procoagulant platelets. Blood. 2016;128:1668–9. [DOI] [PMC free article] [PubMed] [Google Scholar]
- 11. Weiss HJ. Impaired platelet procoagulant mechanisms in patients with bleeding disorders. Semin Thromb Hemost. 2009;35:233–41. [DOI] [PubMed] [Google Scholar]
- 12. Lhermusier T, Chap H, Payrastre B. Platelet membrane phospholipid asymmetry: from the characterization of a scramblase activity to the identification of an essential protein mutated in Scott syndrome. J Thromb Haemost. 2011;9:1883–91. [DOI] [PubMed] [Google Scholar]
- 13. Leung R, Gwozdz AM, Wang H, et al. Persistence of procoagulant surface expression on activated human platelets: involvement of apoptosis and aminophospholipid translocase activity. J Thromb Haemost. 2007;5:560–70. [DOI] [PubMed] [Google Scholar]
- 14. Rand ML, Wang H, Bang KW, Packham MA, Freedman J. Persistence of phosphatidylserine exposure on activated platelets in vivo in rabbits. Thromb Haemost. 2007;98:477–8. [PubMed] [Google Scholar]
- 15. Rand ML, Wang H, Pluthero FG, et al. Diannexin, an annexin A5 homodimer, binds phosphatidylserine with high affinity and is a potent inhibitor of platelet‐mediated events during thrombus formation. J Thromb Haemost. 2012;10:1109–19. [DOI] [PubMed] [Google Scholar]
- 16. Heemskerk JW, Vuist WM, Feijge MA, Reutelingsperger CP, Lindhout T. Collagen but not fibrinogen surfaces induce bleb formation, exposure of phosphatidylserine, and procoagulant activity of adherent platelets: evidence for regulation by protein tyrosine kinase‐dependent Ca2+ responses. Blood. 1997;90:2615–25. [PubMed] [Google Scholar]
- 17. Hess MW, Siljander P. Procoagulant platelet balloons: evidence from cryopreparation and electron microscopy. Histochem Cell Biol. 2001;115:439–43. [DOI] [PubMed] [Google Scholar]
- 18. Munnix IC, Kuijpers MJ, Auger J, et al. Segregation of platelet aggregatory and procoagulant microdomains in thrombus formation: regulation by transient integrin activation. Arterioscler Thromb Vasc Biol. 2007;27:2484–90. [DOI] [PMC free article] [PubMed] [Google Scholar]
- 19. Agbani EO, van den Bosch MT, Brown E, et al. Coordinated membrane ballooning and procoagulant spreading in human platelets. Circulation. 2015;132:1414–24. [DOI] [PubMed] [Google Scholar]
- 20. Dachary‐Prigent J, Freyssinet JM, Pasquet JM, Carron JC, Nurden AT. Annexin V as a probe of aminophospholipid exposure and platelet membrane vesiculation: a flow cytometry study showing a role for free sulfhydryl groups. Blood. 1993;81:2554–65. [PubMed] [Google Scholar]
- 21. Alberio L, Safa O, Clemetson KJ, Esmon CT, Dale GL. Surface expression and functional characterization of alpha‐granule factor V in human platelets: effects of ionophore A23187, thrombin, collagen, and convulxin. Blood. 2000;95:1694–702. [PubMed] [Google Scholar]
- 22. Abaeva AA, Canault M, Kotova YN, et al. Procoagulant platelets form an alpha‐granule protein‐covered “cap” on their surface that promotes their attachment to aggregates. J Biol Chem. 2013;288:29621–32. [DOI] [PMC free article] [PubMed] [Google Scholar]
- 23. Mattheij NJ, Gilio K, van Kruchten R, et al. Dual mechanism of integrin alphaIIbbeta3 closure in procoagulant platelets. J Biol Chem. 2013;288:13325–36. [DOI] [PMC free article] [PubMed] [Google Scholar]
- 24. Harper MT, Poole AW. Chloride channels are necessary for full platelet phosphatidylserine exposure and procoagulant activity. Cell Death Dis. 2013;4:e969. [DOI] [PMC free article] [PubMed] [Google Scholar]
- 25. Fager AM, Wood JP, Bouchard BA, Feng P, Tracy PB. Properties of procoagulant platelets: defining and characterizing the subpopulation binding a functional prothrombinase. Arterioscler Thromb Vasc Biol. 2010;30:2400–7. [DOI] [PMC free article] [PubMed] [Google Scholar]
- 26. Zuba‐Surma EK, Kucia M, Abdel‐Latif A, Lillard JW, Ratajczak MZ. The ImageStream system: a key step to a new era in imaging. Folia Histochem Cytobiol. 2007;45:279–90. [PubMed] [Google Scholar]
- 27. Samsel L, Dagur PK, Raghavachari N, Seamon C, Kato GJ, McCoy JP. Imaging flow cytometry for morphologic and phenotypic characterization of rare circulating endothelial cells. Cytometry B Clin Cytom. 2013;84:379–89. [DOI] [PMC free article] [PubMed] [Google Scholar]
- 28. Niswander LM, McGrath KE, Kennedy JC, Palis J. Improved quantitative analysis of primary bone marrow megakaryocytes utilizing imaging flow cytometry. Cytometry A. 2014;85:302–12. [DOI] [PMC free article] [PubMed] [Google Scholar]
- 29. McGrath KE. Utilization of imaging flow cytometry to define intermediates of megakaryopoiesis in vivo and in vitro. J Immunol Methods. 2015;423:45–51. [DOI] [PMC free article] [PubMed] [Google Scholar]
- 30. Zhao W, Minderman H, Russell MW. Identification and characterization of intestinal antigen‐presenting cells involved in uptake and processing of a nontoxic recombinant chimeric mucosal immunogen based on cholera toxin using imaging flow cytometry. Clin Vaccine Immunol. 2014;21:74–84. [DOI] [PMC free article] [PubMed] [Google Scholar]
- 31. Polanowska‐Grabowska R, Wallace K, Field JJ, et al. P‐selectin‐mediated platelet‐neutrophil aggregate formation activates neutrophils in mouse and human sickle cell disease. Arterioscler Thromb Vasc Biol. 2010;30:2392–9. [DOI] [PMC free article] [PubMed] [Google Scholar]
- 32. Hui H, Fuller K, Erber WN, Linden MD. Measurement of monocyte‐platelet aggregates by imaging flow cytometry. Cytometry A. 2015;87:273–8. [DOI] [PubMed] [Google Scholar]
- 33. Hui H, Fuller KA, Erber WN, Linden MD. Imaging flow cytometry in the assessment of leukocyte‐platelet aggregates. Methods. 2017;112:46–54. [DOI] [PubMed] [Google Scholar]
- 34. Headland SE, Jones HR, D'Sa AS, Perretti M, Norling LV. Cutting‐edge analysis of extracellular microparticles using ImageStream(X) imaging flow cytometry. Sci Rep. 2014;4:5237. [DOI] [PMC free article] [PubMed] [Google Scholar]
- 35. Mustard JF, Kinlough‐Rathbone RL, Packham MA. Isolation of human platelets from plasma by centrifugation and washing. Methods Enzymol. 1989;169:3–11. [DOI] [PubMed] [Google Scholar]
- 36. Molnar J, Lorand L. Studies on apyrases. Arch Biochem Biophys. 1961;93:353–63. [DOI] [PubMed] [Google Scholar]
- 37. Kinlough‐Rathbone RL, Perry DW, Rand ML, Packham MA. Most apyrase preparations are impure and contain inhibitors of cathepsin G: suggestions for use of apyrase in preparation and stabilization of platelet suspensions. Thromb Haemost. 1999;81:849–50. [PubMed] [Google Scholar]
- 38. Christensen H, Kahr WHA. Diagnosis of platelet disorders by electron microscopy In: Stirling JW, Curry A, Eyden B, editors. Diagnostic electron microscopy – A practical guide to interpretation and technique. West Sussex: John Wiley & Sons, 2013; p. 277–91. [Google Scholar]
- 39. Gerrard JM, White JG, Rao GH. Effects of the lonophore A23187 on the blood platelets II. Influence on ultrastructure. Am J Pathol. 1974;77:151–66. [PMC free article] [PubMed] [Google Scholar]
- 40. Boilard E, Nigrovic PA, Larabee K, et al. Platelets amplify inflammation in arthritis via collagen‐dependent microparticle production. Science. 2010;327:580–3. [DOI] [PMC free article] [PubMed] [Google Scholar]
- 41. Ponomareva AA, Nevzorova TA, Mordakhanova ER, et al. Intracellular origin and ultrastructure of platelet‐derived microparticles. J Thromb Haemost. 2017;15:1655–67. [DOI] [PMC free article] [PubMed] [Google Scholar]
- 42. Rand ML, Wang H, Bang KW, et al. Phosphatidylserine exposure and other apoptotic‐like events in Bernard‐Soulier syndrome platelets. Am J Hematol. 2010;85:584–92. [DOI] [PubMed] [Google Scholar]
- 43. Rukoyatkina N, Begonja AJ, Geiger J, Eigenthaler M, Walter U, Gambaryan S. Phosphatidylserine surface expression and integrin alpha IIb beta 3 activity on thrombin/convulxin stimulated platelets/particles of different sizes. Br J Haematol. 2009;144:591–602. [DOI] [PubMed] [Google Scholar]
- 44. Gyulkhandanyan AV, Mutlu A, Freedman J, Leytin V. Mitochondrial permeability transition pore (MPTP)‐dependent and ‐independent pathways of mitochondrial membrane depolarization, cell shrinkage and microparticle formation during platelet apoptosis. Br J Haematol. 2015;169:142–5. [DOI] [PubMed] [Google Scholar]
- 45. Podoplelova NA, Sveshnikova AN, Kotova YN, et al. Coagulation factors bound to procoagulant platelets concentrate in cap structures to promote clotting. Blood. 2016;128:1745–55. [DOI] [PubMed] [Google Scholar]
- 46. Agbani EO, Hers I, Poole AW. Temporal contribution of the platelet body and balloon to thrombin generation. Haematologica. 2017;102:e379–81. [DOI] [PMC free article] [PubMed] [Google Scholar]
- 47. Boilard E, Duchez AC, Brisson A. The diversity of platelet microparticles. Curr Opin Hematol. 2015;22:437–44. [DOI] [PubMed] [Google Scholar]
Associated Data
This section collects any data citations, data availability statements, or supplementary materials included in this article.
Supplementary Materials