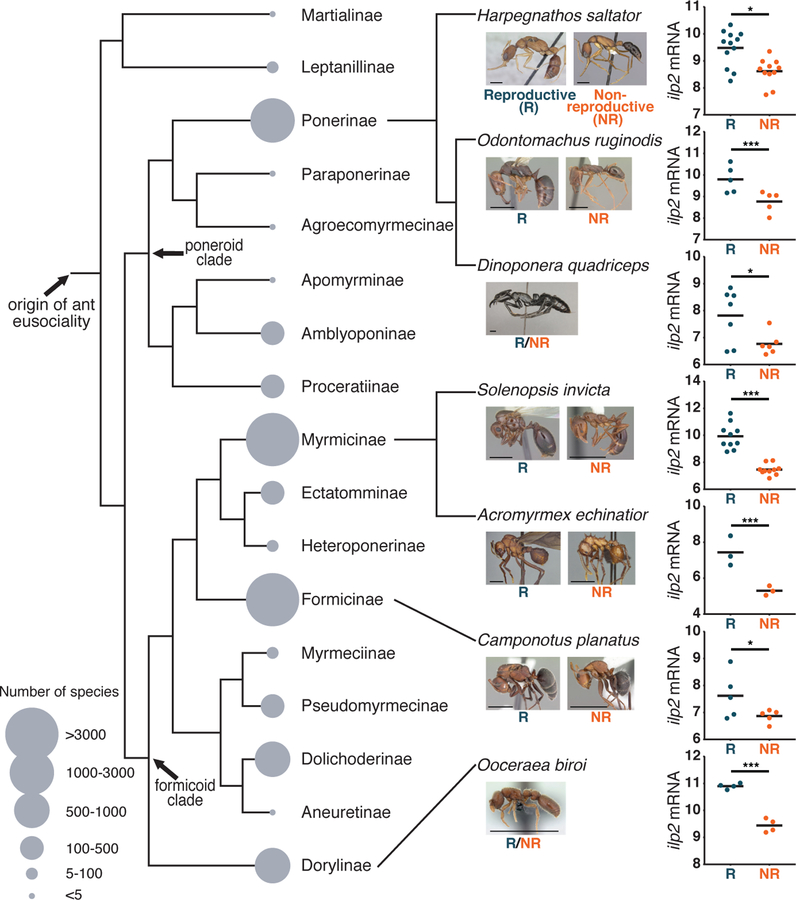
Figure 1: Brain gene expression in seven ant species identifies one conserved differentially expressed gene.

The figure shows the summary cladogram of the seven ant species used in this study in the context of the entire ant phylogeny with all subfamilies labeled. Five of the focal species have queens, while two (D. quadriceps and O. biroi) are queenless. Although H. saltator is not queenless, the data compared reproductive and non-reproductive workers (Table S1). The dot plots show variance-stabilized transformed read counts for ilp2. Blue and orange dots indicate reproductive and non-reproductive ants, respectively. Horizontal bars indicate means, and asterisks indicate statisically significant differences between groups (Wald test: * p<0.05; *** p<0.001). All images except for A. echinatior are from A. Nobile, S. Hartman, and E. Prado (www.antweb.org). Scale bars represent 2mm. The phylogeny is based on (30). Species numbers are from (6).
