

Abstract
The histone variant macroH2A occupies large repressive domains throughout the genome, however mechanisms underlying its precise deposition remain poorly understood. Here, we characterized de novo chromatin deposition of macroH2A2 using temporal genomic profiling in murine-derived fibroblasts devoid of all macroH2A isoforms. We find that macroH2A2 is first pervasively deposited genome-wide at both steady state domains and adjacent transcribed regions, the latter of which are subsequently pruned, establishing mature macroH2A2 domains. Pruning of macroH2A2 can be counteracted by chemical inhibition of transcription. Further, CRISPR/Cas9-based locus-specific transcriptional manipulation reveals that gene activation depletes pre-existing macroH2A2, while silencing triggers ectopic macroH2A2 accumulation. We demonstrate that the FACT (facilitates chromatin transcription) complex is required for macroH2A2 pruning within transcribed chromatin. Taken together, we have identified active chromatin as a boundary for macroH2A domains through a transcription-associated ‘pruning’ mechanism that establishes and maintains the faithful genomic localization of macroH2A variants.
Incorporation of histone variants plays an important role in chromatin organization and transcriptional output1,2. MacroH2A variants differ from canonical H2A by the presence of a unique C-terminal macro domain, which is approximately twice the size of its H2A-like histone fold region2. In mammals, three macroH2A isoforms are encoded by two genes, H2afy (macroH2A1.1, macroH2A1.2) and H2afy2 (macroH2A2)2. MacroH2A histones are generally regarded as repressive variants that interfere with chromatin remodeling and transcription factor binding3,4, but have also been implicated in transcriptional activation5,6 and DNA repair7,8. Functionally, macroH2A isoforms maintain cellular identity by impeding the reactivation of pluripotent genes during somatic cell reprogramming2,9,10 and act as tumor suppressors across multiple cancer types2,11.
MacroH2A variants are enriched in distinct domains that can span hundreds of kilobases in mammalian chromatin5,10. These variants associate with several types of repressed chromatin in both genic and intergenic regions5,12–14, while depleted from actively transcribed loci10,15. Most notably, macroH2A variants are enriched on the inactive X chromosome (Xi) in female mammals16 and co-localize with H3K27me3-decorated autosomal chromatin across the genome5,10,12. Due to the extensive overlap with repressive chromatin modifications, macroH2A deposition has been considered a redundant mechanism of transcriptional repression6,10,17,18.
Despite our understanding of the steady state localization of macroH2A variants, the dynamics of establishing and maintaining such extended chromatin domains remain poorly understood. While nucleation and spreading has been suggested as a model for the establishment of repressive domains decorated by H3K27me319 or H3K9me320, it remains unclear whether spreading applies to macroH2A. Furthermore, the mechanisms underlying the demarcation of macroH2A domains are ill defined. In this study, we utilized cells isolated from a macroH2A1/2 double knockout (dKO) mouse model10,18 to inducibly express macroH2A2 and perform temporal genomic profiling in order to unravel the de novo deposition dynamics of macroH2A2 into macroH2A-naïve chromatin. We uncovered that macroH2A2 is first pervasively deposited across the genome and subsequently pruned at actively transcribed loci to form mature chromatin domains. We demonstrated that macroH2A2 is depleted from transcribed regions, while its accumulation occurs in the absence of transcription. Through proteomic analyses, we identified the FACT complex as a contributing factor to macroH2A2’s distinct deposition pattern. Thus, by systematically monitoring de novo macroH2A deposition, we have identified a novel ‘pruning’ mechanism that establishes and maintains precisely demarcated macroH2A2 domains throughout the mammalian genome.
Results
Replication-independent deposition of macroH2A histone variants
To accurately study macroH2A2 deposition, we first determined whether its incorporation into chromatin is regulated during the cell cycle utilizing SNAP-tag technology to track newly synthesized histones21. We generated NIH 3T3 mouse fibroblasts stably expressing either SNAP-tagged H3.1, which has replication-dependent chromatin incorporation22, or SNAP-tagged macroH2A2 (Supplementary Fig. 1a). We carried out quench-chase-pulse (QCP) for newly synthesized histones, pulse labeling (P) for the total histone pool, or quench-pulse (QP) to control for background fluorescence (Fig. 1a). Soluble proteins were eliminated to ensure exclusive detection of chromatin-incorporated histones. We performed flow cytometry to correlate SNAP signal and DNA content in asynchronously growing cells. When labeled by QCP, SNAP-H3.1 signal corresponding to new histone deposition was markedly increased in S phase, whereas total H3.1 levels were stable across the cell cycle (Fig. 1b and Supplementary Fig. 1b,c). In contrast, macroH2A2-SNAP revealed similar proportions of newly synthesized histone deposition in G1, S and G2 phases (Fig. 1b and Supplementary Fig. 1b,c), suggesting that macroH2A2 is deposited throughout the cell cycle, like histone variants H3.322 and H2A.Z21.
Figure 1. Chromatin deposition of macroH2A variants is replication-independent.
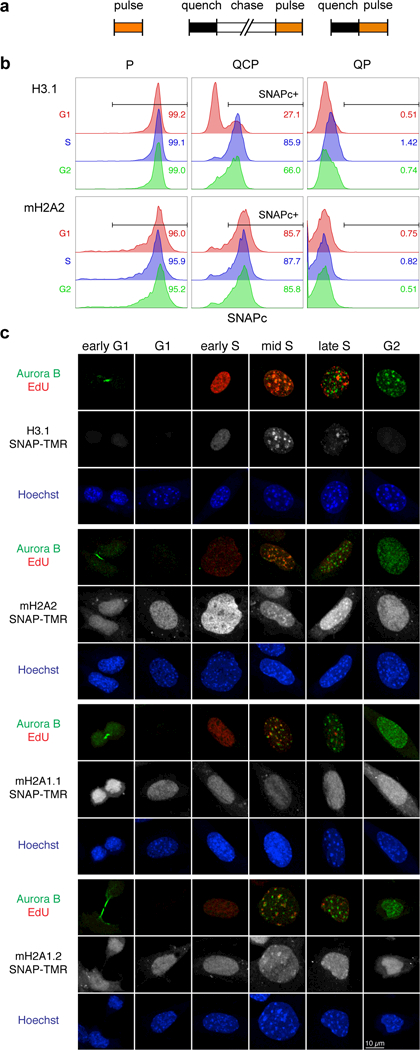
(a) Experimental scheme for in vivo labeling of newly incorporated SNAP-tagged histones. Histones expressed as SNAP-tag fusions in asynchronously growing cells were covalently bound by a non-fluorescent SNAP substrate, irreversibly blocking the existing histone pool from subsequent detection (quench). After allowing synthesis of new SNAP-tagged histones (chase), pulse-labeling with the fluorescent SNAP substrate TMR-Star exclusively marks newly synthesized histones (pulse). Pulse-only labeling represents the total level of old and new SNAP-tagged histones, and quench-pulse is used to control for the background fluorescence level. (b) FACS analysis of SNAP TMR signal normalized to DNA content (SNAPc) in nuclei isolated from asynchronous NIH 3T3 cells expressing SNAP-H3.1 or macroH2A2 (mH2A2)-SNAP. Nuclei positive for tagged histone incorporation (SNAPc+) were identified by comparison to quench-pulse cells. Insets show the percentage of SNAPc+ nuclei across the cell cycle. Cell cycle stages were identified by DNA content (See Supplementary Fig. 1b). (c) Microscopic analysis of newly synthesized H3.1-SNAP, macroH2A2-SNAP, macroH2A1.1 (mH2A1.1)-SNAP or macroH2A1.2 (mH2A1.2)-SNAP in the chromatin of asynchronous WT iDFs. EdU and Aurora B staining were used to distinguish cell cycle stages. Cells are scored as G1 (negative for EdU and Aurora B), S phase (EdU positive) or G2 (EdU negative, Aurora B positive). S phase is divided into early, mid and late phase based on the EdU distribution. Scale bar representing 10 μm applies to all panels. More than 50 cells were examined for each tagged histone.
We also established wild type (WT) mouse immortalized dermal fibroblasts (iDFs) stably expressing SNAP-tagged H3.1, macroH2A1.1, macroH2A1.2 or macroH2A2 (Supplementary Fig. 1d). Here, we coupled the QCP strategy with EdU labeling and Aurora B immunostaining to mark distinct cell cycle stages21. Microscopic analyses confirmed the replication-independent deposition pattern of all macroH2A variants (Fig. 1c). Furthermore, in asynchronously growing iDFs sorted by DNA content, mRNA levels of all endogenous macroH2A isoforms were similar across G1, S and G2 (Supplementary Fig. 1e). Therefore, we used asynchronous cell populations to investigate the genome-wide dynamics of macroH2A2 chromatin incorporation.
A temporal system to profile macroH2A2 deposition into macroH2A-naive chromatin
We devised a temporal profiling strategy to interrogate the genome-wide deposition dynamics of nascent macroH2A into chromatin devoid of pre-existing macroH2A variants. Since macroH2A1 and macroH2A2 isoforms have highly similar genome-wide localization patterns in multiple cell types10,14,18,23, we focused on the understudied macroH2A2 variant, which we previously demonstrated as a barrier of somatic cell reprogramming towards pluripotency10.
We generated and characterized iDFs from neonatal macroH2A1/2 dKO mice (Supplementary Fig. 2a-c), and established dKO iDFs carrying a doxycycline (dox)-inducible GFP-tagged macroH2A2 transgene. We generated clonal lines and selected one with the most synchronous induction kinetics (Supplementary Fig. 2d). This system allowed us to induce macroH2A2 expression in dKO cells and track its de novo deposition (Fig. 2a). A clonally-derived dKO iDF line with a dox-inducible macroH2A1.1-GFP transgene was also generated (Supplementary Fig. 2d). While macroH2A2-GFP and macroH2A1.1-GFP were largely undetectable without dox, expression was observed by 6 hours post-induction and chromatin-incorporated macroH2A plateaued at ~24 hours (Supplementary Fig. 2e-g). Importantly, the dox concentration was chosen to ensure that macroH2A2-GFP expression in dKO background was below the endogenous level of total macroH2A in WT cells (Supplementary Fig. 2h-j).
Figure 2. MacroH2A2 undergoes early pervasive deposition that is subsequently pruned.

(a) Experimental scheme for temporal profiling of de novo macroH2A2-GFP deposition into macroH2A-naive chromatin using an inducible expression system. (b) Genome browser view of nChIP-seq profiles (fold change, ChIP normalized to sequencing-depth-matched input) illustrating relative occupancy of inducibly-expressed macroH2A2-GFP in dKO iDFs, endogenous macroH2As and chromatin modifications (WT DFs). Stranded RNA-seq signal (RPM - reads per million base pair) in dKO iDFs are shown in parallel. Y axes of all tracks start with zero. Bars under signal tracks represent significant peak regions. Red boxes indicate regions with ‘pruning’. (c) Overlap of macroH2A2-GFP peaks at 6 hours vs. 24 hours and 6 hours vs. 5 days after dox induction. Peaks detected exclusively at 6 hours vs. day 5 are termed transient peaks, and all peaks present at day 5 are termed steady state peaks. (d) Scatter plots showing distribution of relative macroH2A2 enrichment level at 6 hours (left panel) and 24 hours (right panel) compared to steady state. Each point represents an individual macroH2A2-GFP peak. Colors denote peak classes as indicated. (e) Metagene plots of average macroH2A2-GFP relative enrichment during de novo deposition at transient peak regions (left panel, n = 25,489) and steady state peak regions (right panel, n=48,486).
Next, we performed native chromatin immunoprecipitation sequencing (nChIP-seq) using GFP-trap24 in macroH2A2-GFP inducible iDFs five days post-induction (steady state) (Supplementary Table 1), and compared it with endogenous macroH2A2 distribution in WT DFs derived from the same mouse strain10 (Supplementary Table 2). We observed accurate restoration of macroH2A2 genomic localization (Supplementary Fig. 3a,b) and formation of broad domains overlapping H3K27me310 (Fig. 2b, Supplementary Table 2). These results suggest that precise de novo establishment of macroH2A2 domains does not require pre-existing macroH2A variants.
De novo macroH2A2 deposition involves pervasive incorporation followed by pruning
To track de novo macroH2A2 deposition, we performed nChIP-seq for macroH2A2-GFP at 0, 6 and 24 hours post-induction (Supplementary Table 1). Normalization to input (Supplementary Table 1) revealed that more than 92% of reads at 0 hours represent background-level signal, confirming minimum leaky expression of the transgene. We termed macroH2A2 peaks present at five days ‘steady state’ (i.e. mature) peaks, and strikingly, ~70% of them were already established by 6 hours (Fig. 2b, c, Supplementary Fig 3c). Unexpectedly, we identified a large number of additional macroH2A2 peaks at 6 hours, localized outside of steady state peak regions (Fig. 2b-d). These ‘transient’ peaks accounted for ~40% of all 6-hour peaks and displayed similar levels of relative macroH2A2 enrichment as mature peaks at 6 hours (Fig. 2e). MacroH2A2 enrichment at transient peak regions decreased significantly by 24 hours and was reduced to background levels at steady state (Fig. 2b,d,e). In contrast, macroH2A2 remained stably enriched at steady state peak regions from 6 hour onwards (Fig. 2b,e). Our results suggest that incorporation of macroH2A2 into macroH2A-naïve chromatin has an early pervasive phase, followed by a ‘pruning’ process, which restricts its localization and enforces the steady state distribution pattern.
Interestingly, while the majority of steady state peaks were established by 6 hours (referred to as ‘early’ steady state peaks), others only became detectable by 24 hours (‘intermediate’) or 5 days (‘late’) (Supplementary Fig 3c). Though macroH2A generally associates with repressed chromatin, regions with delayed deposition were enriched for heterochromatic features, such as H3K27me310 and more dramatically H3K9me325 (Supplementary Fig 3d, Supplementary Table 2). This suggests that heterochromatic regions with more densely packed nucleosomes may hinder the initial access of the macroH2A deposition machinery.
Transient macroH2A2 deposition is enriched at actively transcribed chromatin loci
We next characterized chromatin signatures associated with transient vs. steady state peaks. We found that transient peak regions were enriched for H3K27ac10 (Supplementary Table 2), indicating an association with active transcription, in contrast to steady state peak regions that were enriched for H3K27me3 (Fig. 3a). To partition the genome based on transcriptional status, we performed RNA sequencing (RNA-seq) at 0, 6 and 24 hours post-induction (Supplementary Table 1). Re-expression of macroH2A2 in dKO iDFs caused negligible changes in gene expression under homeostatic conditions (Supplementary Fig. 4a,b). In accordance, we observed that macroH2A acts redundantly with other epigenetic pathways to maintain autosomal gene repression (Supplementary Fig. 4c-e), akin to its role in Xi maintenance17.
Figure 3. Transient macroH2A2 deposition is enriched at actively transcribed chromatin.

(a) Box plots of H3K27me3 and H3K27ac occupancy level at steady state peak (S, n = 48,486) and transient peak (T, n = 25,489) regions of macroH2A2. Boxes span the lower to upper quartile; median is indicated with a black line; whiskers show locations of the minimum and maximum; P values are calculated using two-tailed t test, **** P < 2.2 × 10⁻¹⁶. (b) Proportions of macroH2A2 peak centers that fall into each genomic category. FPKM (fragments per kilobase per million mapped reads) values calculated from RNA-seq data (0 hour) are used to distinguish active (FPKM > 1) and inactive (FPKM ≤ 1) genes. “> 10kb” indicates more than 10kb away from active genes. (c) Metagene profiles of macroH2A2-GFP relative enrichment during de novo deposition at active and inactive gene loci. (d) Heatmap showing macroH2A2-GFP relative enrichment at all active (ranked by FPKM) and inactive (randomly ordered) genes (> 200 bp) during the deposition time course. (e-g) nChIP-qPCR analysis of relative macroH2A2-GFP (e,f) and macroH2A1.1-GFP (g) occupancy levels after dox induction at active (green bar) and inactive genes (red bar). macroH2A-GFP ChIP was normalized to H2B. Three negative control regions (chr2, chr6 and chr14) were used for normalization to calculate relative enrichment. Error bars represent s.d. from n = 3 (e) or n = 2 in (g) independent experiments. In f, n = 2 independent experiments.
Notably, ~70% and 15% of transient peaks localized to active genes or their proximal regions, respectively (Fig. 3b). More than half of active genes showed transient macroH2A2 deposition at 6 hours (Supplementary Fig. 4f). Therefore, we analyzed relative macroH2A2 levels at genes throughout the time course and observed decreased enrichment at active genes over time, yet stable enrichment at inactive loci (Fig. 3c,d), a pattern that recapitulates the gradual pruning of transient peaks. Furthermore, the presence of transient deposition and pruning at proximal regions of active genes - upstream of the transcription start site (TSS) and downstream of the transcript end site (TES) (Fig. 3c,d) suggests an association with proximal transcriptional activity26 marked by elongating RNA polymerase II27 (Supplementary Fig. 4g, Supplementary Table 2).
Normalization of macroH2A2-GFP nChIP to H2B, which represents occupancy of total canonical and variant H2A/H2B dimers, at several active genes (Supplementary Fig. 4h) validated the two-step deposition-pruning process (Fig. 3e,f) identified by normalization to input DNA (Fig 2b, Supplementary Fig. 4i). This suggests that pruning is mediated by histone exchange rather than dimer loss. In agreement, we observed a modest but consistent increase of canonical H2A occupancy during macroH2A2 pruning (Supplementary Fig. 4j). Additionally, de novo macroH2A1.1 deposition undergoes similar dynamics (Fig. 3g), demonstrating a conserved deposition pathway between macroH2A isoforms. Collectively, these findings demonstrate that transient deposition and subsequent pruning of macroH2A histones predominantly occurs at actively transcribed chromatin.
MacroH2A domain boundaries are enriched for actively transcribed genes
Since transient deposition and pruning occurs predominantly at active genes, we examined the proximity of active genes to steady state macroH2A domains. We identified 14,050 steady state macroH2A2-GFP broad domains in iDFs; such macroH2A chromatin domains, hereafter termed MCDs, are enriched for both macroH2A1 and macroH2A2 and span up to hundreds of kilobases averaging ~37 kb (Fig. 4a, Supplementary Fig. 5a). Whereas active genes are depleted within MCDs (Supplementary Fig. 5b), they are localized near MCD boundaries, with their TSS or TES enriched at immediate MCD flanking regions (Fig. 4b,c). Furthermore, transcription in both 5’ and 3’ directions indicated by RNA-seq signal is highly enriched at MCD proximal regions, but is absent within MCDs (Fig. 4d). In accordance, elongating Pol II27 as well as active chromatin signatures H3K27ac10 and H2A.Z (Supplementary Table 1) show enrichment at MCD flanking regions (Supplementary Fig. 5c). Moreover, active genes with transient macroH2A2 localized significantly closer to MCDs than those without (Fig. 4c,e), in keeping with an enrichment of transient macroH2A2 peaks near MCDs (Fig. 4c,f). This indicates that transient deposition and pruning is more likely to occur at active genes near MCD boundaries.
Figure 4. Actively transcribed chromatin loci act as boundaries for MCDs.

(a) Metagene profiles of macroH2A occupancy level at MCDs. (b) Probability ratios of the observed number of TSS/TES localized within the 5kb flanking regions (upstream/downstream) of MCDs over the expected number from a random distribution. In b and f, dashed lines represent the expected value of 1 indicating random distribution; error bars represent s.d.; P values are calculated using Monte Carlo testing, *** P < 0.001. (c) Representative genome browser snapshots showing MCDs flanked by active genes in iDFs. Green and black bars represent significant macroH2A2-GFP peaks and MCDs respectively. In c, h and i, dotted lines represent MCD boundaries and all y axes start with zero. (d) Metagene plot of stranded RNA-seq signal (0 hours) at MCDs and proximal regions in iDFs. Schematic below depicts the identification of TSS/TES from the plot: a sharp drop/rise in RNA-seq profile indicates boundary of a transcription unit, and transcriptional directionality distinguishes between start (TSS) and end (TES) of the unit. (e) Box plots showing the distance between active genes, with (w/, n = 5,203) or without (w/o, n = 4,671) transient macroH2A2 peaks, and their nearest MCDs. Boxes span the lower to upper quartile; median is indicated with a black line; whiskers show locations of the minimum and maximum; P values are calculated using two-tailed t test, **** P < 2.2 × 10⁻¹⁶. (f) Probability ratio of observed over expected random distribution of the distance between transient peaks and their nearest MCDs. (g) Metagene plots of RNA-seq signal29 in fetal liver cells (left panel) and C2C12 myoblast (right panel) at MCDs and proximal regions in respective cell types. (h, i) Representative genome browser snapshot of MCDs with conserved (h) and non-conserved (i) _Captionboundary demarcation across indicated cell types.
Analyses of macroH2A1/2 ChIP-seq from mouse liver cells18 and C2C12 myoblasts28 revealed that MCDs in these cell types are also flanked by transcribed regions, marked by RNA-seq signal29 (Fig. 4g,h), Pol II occupancy29,30 and transcription-associated histone modifications29 (Supplementary Fig. 5d,e, Supplementary Table 2), indicating a conserved localization pattern across differentiated cell types. Notably, distinct gene expression patterns at MCD-flanking regions across cell types associate with differential boundary demarcation. For example, lack of transcription at the Hoxc gene cluster boundary is associated with an expanded MCD in liver cells (Fig. 4i). These results demonstrate that actively transcribed loci delimit MCDs under steady state across cell types and display pruning of pervasively deposited macroH2A2 during establishment of adjacent MCDs.
Active transcription is necessary for the pruning of pervasively incorporated macroH2A2
MacroH2A is generally depleted from active genes10,15. We observed an anti-correlation between gene expression levels and macroH2A2 occupancy in iDFs (Fig. 5a), and that lineage-specific macroH2A localization is associated with differential transcription, whereby macroH2A is specifically depleted from genes expressed in a particular cell type (Fig. 5b). Together, these data suggest that transcriptional activity antagonizes macroH2A deposition. To determine whether transcription drives the pruning of pervasively incorporated macroH2A2 during de novo deposition, we calculated a ‘pruning index’ representing the degree of macroH2A2 pruning between 6 to 24 hours, and found it positively correlated with transcription levels (Fig. 5c). Interestingly, active genes without pervasively deposited macroH2A2 at 6 hours display significantly higher occupancy of elongating Pol II (Supplementary Fig. 6a,b), suggesting that macroH2A2 has already been pruned due to high transcriptional activity.
Figure 5. Pruning of pervasively deposited macroH2A requires active transcription.

(a) Metagene profile of macroH2A2 occupancy at genes in expression quintiles ranked from least to most expressed in iDFs. (b) Representative genome browser snapshots of cell type specific depletion of macroH2A occupancy at transcribed regions. (c) Boxplot of pruning indices (log2 (6h/24h), macroH2A2-GFP nChIP) at genes in expression quintiles from a. (d) Western blot of whole cell extracts from macroH2A2-GFP-inducible dKO iDFs after FP treatment (4 hours) at indicated concentrations; NT, no treatment. S2P, serine-2 phosphorylation. S5P, serine-5 phosphorylation. β-tubulin used as loading control. The experiment was repeated twice with the same result. Uncropped Western blot images shown in Supplementary Data Set 1. (e) Experimental scheme of FP treatment during de novo macroH2A2-GFP deposition. (f) Representative genome browser snapshot demonstrating the retention of pervasively deposited macroH2A2 near the α-globin gene cluster MCD. Dotted lines represent steady state MCD boundaries. Stranded RNA-seq signal (0 hour) is shown in parallel. (g) Scatter plot showing the genome-wide retention of pervasively deposited macroH2A2 at transient peak regions (compare with Fig. 2d). Each point represents a macroH2A2-GFP peak. (h) Metagene profiles of macroH2A2-GFP relative enrichment at active and inactive gene loci +/− FP during de novo macroH2A-GFP deposition. (i) Heatmap of macroH2A2-GFP relative enrichment at all active genes ranked by FPKM (see Supplementary Fig. 7g for inactive genes). (j, k) nChIP-qPCR analysis of relative macroH2A2-GFP and macroH2A1.1-GFP occupancy during de novo macroH2A-GFP deposition +/− FP. macroH2A-GFP ChIP was normalized to H2B. Three negative control regions (chr2, chr6 and chr14) were used for normalization to calculate relative enrichment. Error bars represent s.d. from n = 2 independent experiments. Green and red bars represent active and inactive genes, respectively.
Next, we blocked Pol II elongation globally using the CDK9 inhibitor flavopiridol (FP)31,32. FP efficiently inhibited Pol II Serine-2 phosphorylation (S2P), a hallmark of productive elongation (Fig. 5d), and transcription was significantly reduced (Supplementary Fig. 6c). We treated macroH2A2-GFP inducible iDFs with dox for 6 hours, allowing pervasive deposition to occur, and then added FP for 18 hours to challenge subsequent pruning (Fig. 5e). FP treatment dramatically diminished pruning at transient peak regions, resulting in genome-wide preservation of pervasively incorporated macroH2A2, whereas it did not alter the deposition at steady state macroH2A2-decorated chromatin (Fig. 5f,g, Supplementary Fig. 6d,e, Supplementary Table 1). Notably, aberrant retention of macroH2A2 near MCDs resulted in domain expansion (Fig. 5f). Moreover, global macroH2A2 distribution at 24 hours with FP treatment correlated stronger with the 6-hour vs. untreated 24-hour profile (Supplementary Fig. 6f). Further inspection at genic regions revealed that macroH2A2 pruning from formerly active genes was largely abrogated by FP treatment (Fig. 5h-j, Supplementary Fig. 6g). Transcriptional inhibition also led to macroH2A1.1 retention (Fig. 5k), demonstrating that macroH2A isoforms undergo similar transcription-dependent pruning during de novo deposition.
Steady state macroH2A2 deposition is subject to transcriptional states
Next, we utilized CRISPR/Cas9-based techniques to activate or repress specific genes in iDFs and examined consequent changes of macroH2A2 deposition. Hoxc13 is a repressed gene (FPKM = 0.37) localized within an MCD (Fig. 4i, 6a). Using dCas9-activators in dKO iDFs expressing macroH2A2-GFP (Fig. 6b), Hoxc13 was efficiently activated with promoter-targeting sgRNA (sgHoxc13) (Fig. 6c) and macroH2A2 occupancy was diminished across the gene and at promoter proximal regions (Fig. 6d). Tks4 (also known as Sh3pxd2b) is expressed (FPKM = 19.34) and localized near the α-globin gene cluster MCD33 (Fig. 6e). We ablated a 2 kb region containing the Tks4 TSS and associated CpG island (CGI) using CRISPR/Cas9 in dKO iDFs expressing macroH2A2-GFP (Fig. 6e) and selected clones with homozygous TSS deletion (Supplementary Fig. 7a). Transcription of Tks4 was completely abrogated in edited cells (Fig. 6f) and notably, the Tks4 locus accumulated macroH2A2, effectively resulting in expansion of the adjacent MCD (Fig. 6g).
Figure 6. MacroH2A2 occupancy is responsive to transcriptional changes.

(a) Genome browser snapshot showing the silent Hoxc13 locus within an MCD. In a and e, red bars represent nChIP-qPCR primers. (b) Experimental scheme of engineered Hoxc13 activation in dKO iDFs expressing macroH2A2-GFP. A non-targeting sgRNA (sgEV) was used as control. Green line indicates presence of macroH2A2-GFP in b and k. (c) RT-qPCR of Hoxc13 gene expression level in iDFs with sgEV or sgHoxc13. FPKM in iDFs is shown. (d) nChIP-qPCR showing macroH2A2-GFP occupancy at the extended Hoxc13 locus. In d, g and h, macroH2A2 ChIP was normalized to H2B. In d, g, h and i, error bars represent s.d. from n = 2 independent experiments. (e) Genome browser snapshot showing macroH2A2 occupancy at the extended Tks4 locus. Black bar indicates the region deleted. Purple bar represents the CGI. Black arrows represent primers for genotyping PCR. (f) RT-qPCR of Tks4 expression level in iDF clones with its TSS intact (+/+) or homozygously deleted (−/−). FPKM in iDFs is shown. (g) nChIP-qPCR showing macroH2A2-GFP occupancy at the extended Tks4 locus in clones in f. (h) RT-qPCR (upper) and nChIP-qPCR (lower) analyses in dKO iDFs expressing macroH2A2-GFP showing gene expression or macroH2A2 occupancy during FP treatment and after washout. 18S rRNA used as internal reference for RT-qPCR. For nChIP-qPCR, Chr2 and Tal1 are used as negative and positive controls, respectively. (i) nChIP-qPCR showing H3K27me3 occupancy at regions in g. (j) Western blot analysis of chromatin from iDFs after GSK126 treatment and dox induction. Amido black staining of histones and Lamin A used as loading controls. The experiment was repeated twice with the same result. Uncropped Western blot images shown in Supplementary Data Set 1. (k) Experimental scheme with macroH2A2-inducible dKO iDFs. (l) Metagene profiles showing macroH2A2-GFP occupancy 24 hours post-induction at steady state macroH2A2 peak regions overlapping H3K27me3.
We further investigated whether transcriptional inhibition of non-engineered, active genes at steady state leads to macroH2A2 accumulation. We treated WT iDFs and macroH2A2-GFP-expressing dKO iDFs with FP to inhibit global transcription31,32 (Supplementary Fig. 7b-d). We observed gradual accumulation of macroH2A2 at multiple formerly expressed genes (Supplementary Fig. 7e,f). In contrast, a small set of primary response genes, whose expression increases upon CDK9 inhibition34 (Supplementary Fig. 7g,h), remained depleted of macroH2A2 (Supplementary Fig 7i,j). Moreover, by blocking transcription and subsequently allowing its resumption upon inhibitor washout, we observed rapid eviction of the accumulated macroH2A2, which closely followed the kinetics of mRNA expression (Fig. 6h). Together, these results demonstrate that transcriptional activation is sufficient to deplete pre-existing macroH2A2 from chromatin, and conversely, transcriptional silencing is sufficient to allow macroH2A2 accumulation. Therefore, transcription plays a principal role in macroH2A2 chromatin localization.
Deposition of macroH2A2 is independent of H3K27me3
Due to the extensive co-localization of macroH2A and H3K27me3 throughout the genome5,10,12, we queried whether H3K27me3 signals for the deposition of macroH2A2. Interestingly, upon silencing of Tks4 via TSS deletion or transcriptional inhibition by FP, the accumulation of macroH2A2 was not accompanied by gain of H3K27me3 (Fig. 6i, Supplementary Fig. 8a). During de novo deposition, transient macroH2A2 incorporation also occurs independently of this modification (Supplementary Fig. 8b). We next treated macroH2A2-GFP-inducible iDFs with the Ezh2 inhibitor GSK12635 for 10 days to deplete H3K27me3 (Fig. 6j, Supplementary Fig. 8c), and then initiated macroH2A2-GFP expression (Fig. 6k). Notably, the de novo deposition dynamics of macroH2A2 recapitulates that of untreated cells, showing pervasive deposition followed by pruning (Supplementary Fig. 8d,e, Supplementary Table 1). Moreover, the genome-wide occupancy of macroH2A2-GFP 24 hours post-induction was unaltered by the absence of H3K27me3 (Fig. 6l, Supplementary Fig. 8f-h). Collectively, these data suggest that H3K27me3 does not play an instructive role in macroH2A2 deposition.
Histone chaperone FACT assists in transcription-associated macroH2A2 pruning
Because histone chaperones are responsible for histone deposition and eviction36, we next sought to identify chaperones that facilitate macroH2A2 pruning at actively transcribed chromatin. We established stable dKO iDFs expressing individual GFP-tagged macroH2A variants (Fig. 7a, Supplementary Fig. 9a,b) and performed MNase IP-quantitative mass spectrometry (qMS) to identify proteins associated with macroH2A-containing nucleosomes (Fig. 7b, Supplementary Fig. 9c). This method has identified chaperones for other histone variants, including H2A.Z24. Notably, known macroH2A1.1 interactors such as PARP16,7,37 and chaperone APLF38 were verified in our system (Fig. 7b,c, Supplementary Fig. 9d). We identified both subunits of the histone chaperone FACT complex, SPT16 and SSRP1, as interacting partners for all three macroH2A isoforms, as well as for H2A as reported39 (Fig. 7c). IP using soluble nuclear extracts validated the interaction between FACT and macroH2A/H2B dimers (Fig. 7d, Supplementary Fig 9e). Furthermore, IP with macroH2A2 deletion mutants demonstrated that its histone fold region is required for this interaction (Supplementary Fig. 9f,g).
Figure 7. The FACT complex facilitates transcription-associated pruning of macroH2A2.

(a) Experimental scheme for purifying GFP-tagged histones and associated proteins for qMS analysis. (b) Silver staining of proteins associated with indicated GFP-tagged histones purified by MNase IP using GFP-trap. (c) Heatmap of relative iBAQ quantification values of indicated protein groups in triplicate IP experiments. Color represents relative intensity adjusted to row minimum and maximum. (d) Western blot analysis of macroH2A2 interacting proteins in soluble nuclear extracts of dKO iDFs expressing macroH2A2-GFP. For SPT16 and SSRP1, a shorter (upper) and a longer (lower) exposure are shown. For d-f, experiments were repeated three times (d) or twice (e, f) with same results; uncropped Western blot images are shown in Supplementary Data Set 1. (e) Western blot analysis of chromatin-associated FACT subunits during de novo deposition of macroH2A2-GFP. Amido black staining of histones and histone H1.2 used as loading controls. Graph below shows quantification; SPT16 and SSRP1 were normalized to H1.2. (f) Western blot of iDF whole cell extract upon SPT16 knockdown. GAPDH used as loading control. (g, h) nChIP-qPCR analysis of macroH2A2 occupancy during de novo deposition (g) or at steady state (h) after SPT16 knockdown. Experimental designs are shown above; green lines indicate presence of macroH2A2-GFP. MacroH2A-GFP ChIP was normalized to H2B. Error bars represent s.d. from n = 2 independent experiments.
FACT mediates transient displacement and redeposition of H2A/H2B dimers during transcription39 and can restrict promiscuous deposition of H2A.Z40 and CENP-A41. During de novo macroH2A2 deposition, the chromatin associated pool of FACT increased following pervasive deposition, peaking at ~9 hours post-induction (Fig. 7e). To determine whether FACT promotes macroH2A2 pruning at transcribed chromatin, we used shRNA to knockdown SPT16 and examined macroH2A2 deposition. Consistent with previous reports, SPT16 depletion destabilized SSRP142, effectively diminishing the entire complex (Fig. 7f). During de novo deposition, FACT depletion led to retention of macroH2A2 at active genes at 24 hours, when it should have been pruned (Fig. 7g). At steady state, FACT depletion caused ectopic macroH2A2 accumulation (Fig. 7h). Importantly, we did not detect significant transcriptional deregulation at the loci analyzed (Supplementary Fig. 9h), suggesting that reduced pruning was not attributable to impaired transcription. Collectively, these results indicate that FACT facilitates macroH2A2 pruning at actively transcribed chromatin.
Discussion
MacroH2A forms distinct chromatin domains, yet little is known about the deposition pathways that govern the specificity of its localization. In dissecting the de novo deposition dynamics of macroH2A2, we observed that pre-existing macroH2A is not required for its deposition, and identified a pervasive deposition pattern that is selectively pruned to establish mature macroH2A domains (see model, Fig. 8). Importantly, this sheds light on the mechanism of macroH2A domain demarcation. MacroH2A1 domain boundaries were shown to occur near TSSs and largely lack occupancy of the insulator protein CTCF5, suggesting alternative demarcation mechanisms. Our genomic analyses further reveal that macroH2A domain boundaries are enriched for both TSSs and TESs of active genes, but not repressed ones, a finding conserved across cell types. Furthermore, transcriptional activity drives macroH2A pruning, while silencing allows its retention and accumulation. Our work demonstrates that actively transcribed chromatin acts as a boundary for the demarcation of macroH2A domains, and reveals a dominant effect of Pol II transcriptional activity in restricting macroH2A genomic localization both during de novo deposition and steady state maintenance.
Figure 8. Model of macroH2A2 chromatin deposition and domain demarcation.

When macroH2A2 is expressed in cells without pre-existing macroH2A variants, a high ratio of soluble to chromatin-incorporated macroH2A2 favors deposition. New macroH2A2 likely utilizes ‘general’ H2A/H2B chaperones leading to an initial wave of pervasive deposition. Actively transcribed chromatin engages FACT and likely other transcription-associated chaperones to promote macroH2A2 pruning, antagonizing pervasive deposition and leading to resolution of MCDs. Therefore, macroH2A2 exclusively accumulates at inactive chromatin, establishing MCDs across the genome that are delimited by transcribed regions. Under the steady state situation, transcribed chromatin engages basal levels of FACT and other pruning chaperones as a surveillance system to counteract macroH2A2 accumulation, thus maintaining the faithful boundary demarcation of MCDs.
Active transcription is associated with high nucleosome turnover43. During transcription, H2A/H2B dimers undergo transient displacement and re-association through the activity of FACT39, and canonical H3.1 is exchanged for variant H3.3 by histone chaperone HIRA36,44. Our results identify a transcription-associated macrohistone pruning process, potentially during histone turnover, that alters the equilibrium of macroH2A incorporation and dissociation in transcribed chromatin vs. neighboring prospective MCDs. Initially during de novo macroH2A deposition, the equilibrium at both regions is similar, leading to pervasive accumulation and expanded immature domains. During the pruning phase, the rate of dissociation increases in transcribed chromatin at prospective domain boundaries, where the resulting lower equilibrium level of macroH2A accumulation drives the resolution of MCDs (Supplementary Fig. 9i). Such pruning, by antagonizing pervasive deposition at neighboring transcribed regions, not only establishes macroH2A enrichment at discrete domains in macroH2A-naïve chromatin, but also maintains the precise boundary demarcation at steady state. Interestingly, heterochromatic regions, which typically show slow replication-independent histone turnover45, display delayed deposition of nascent macroH2A histones.
Importantly, our system provides a valuable model to understand how cells with ‘blank-slate’ chromatin for macroH2A variants respond to synthesis of new macroH2A and establish precise domains across the genome. Physiologically, this model may represent the de novo deposition in the early pre-implantation embryo, where macroH2A is largely absent until the 8-cell stage when its levels rapidly and dramatically increase during the morula/early blastocyst stages46,47. Investigating this process during early development in vivo is therefore an interesting future direction.
Despite multiple attempts to identify ‘specific’ chaperones for macroH2A that deposit it into MCDs genome-wide, none have been revealed to date7,33,37,48. Thus, it is formally possible that macroH2A variants use H2A/H2B chaperones36 for deposition. We found that macroH2A has an intrinsic ability to incorporate pervasively into chromatin, indicating its potential engagement with non-selective deposition pathways. In agreement, NAP-1 was shown to interact with macroH2A49 and is able to assemble macroH2A-containing nucleosomes in vitro50. We observed a macroH2A2/NAP-1 interaction in the chromatin-free fraction of iDFs (Supplementary Fig. 9j), suggesting a potential macroH2A2 pre-deposition complex.
The FACT complex interacts with macroH2A variants in several cellular contexts7,8,49, and was recently reported to promote macroH2A1.2 deposition at sites of recurrent replication stress8. Here, we identified FACT as a macroH2A chaperone whose transcription-associated activity excludes macroH2A2 from active chromatin. Such exclusion is likely through preferential deposition of canonical H2A/H2B over macroH2A2/H2B during transcription, akin to the restriction of H2A.Z from intragenic regions by FACT40. In keeping, fluorescence polarization assays showed that FACT binds H2A/H2B with a higher affinity than macroH2A1.2/H2B8. In addition to restricting macroH2A occupancy, FACT counteracts spreading of other types of silent chromatin and its loss enhances position effect variegation in Drosophila51. Nevertheless, FACT may not be the only chaperone responsible for macroH2A pruning, since transcriptional inhibition induces stronger macroH2A accumulation compared to FACT knockdown alone. Furthermore, other negative regulatory mechanisms for macroH2A deposition at designated genomic regions have been documented33,52, suggesting that regulated exclusion is a critical mechanism to enforce the chromatin targeting specificity of macroH2A variants.
Active chromatin has evolved mechanisms to sustain a transcriptionally-competent state such as utilizing positive feedback circuits (e.g. autoregulatory transcription factors53 and co-transcriptional histone modifications54) and antagonizing Polycomb repression55,56. MacroH2A pruning could serve as another means to ensure faithful propagation of active chromatin states by preventing aberrant epigenetic silencing due to its accumulation. Based on its deposition dynamics, we propose that macroH2A functions during the maintenance stage of repression through a feed-forward mechanism, whereby transcriptional inactivation allows its accumulation to lock in the silent state where macroH2A acts as a redundant layer of epigenetic repression.
MacroH2A and H3K27me3 overlap extensively in repressive domains across the genome5,10,12. Our results show that H3K27me3 does not instruct the deposition of macroH2A2. Additionally, macroH2A1/2 dKO cells maintain proper localization of H3K27me310. Therefore, the deposition pathways of macroH2A and H3K27me3 are largely independent. Moreover, there appears to be a differential requirement for CpG islands (CGIs), which may act as recruitment elements and nucleation sites for Polycomb Repressive Complex 2 (PRC2) in mammalian cells19,57, but not for macroH2A. This study and others58 showed that transcriptional inactivation by deleting TSSs and associated CGI failed to induce H3K27me3 across the gene body. In contrast, we demonstrate that such editing efficiently triggers macroH2A2 accumulation. Furthermore, chemical inhibition of transcription induces PRC2 recruitment predominantly at CGIs59, but allows macroH2A2 deposition at sites regardless of their CpG content (see Supplementary Fig. 7e,f). In accordance, whereas nucleation and rapid spreading allows establishment of H3K27me3 domains19, such a mechanism is not observed for de novo MCD formation. Interestingly, a recent study showed that de novo H3K27 methylation in cells depleted of this modification is established with ‘immediate accuracy’ within 4 days60. In contrast, we demonstrate that precise de novo macroH2A deposition features an early pervasive incorporation followed by specific chaperone-mediated pruning. Therefore, our study highlights distinct mechanisms in establishing the accurate distribution of repressive chromatin domains.
Methods
Cell culture.
DF isolation from neonatal mice was performed as described10. Male DFs were immortalized by SV40 large T antigen. iDFs and NIH 3T3 fibroblasts were grown in DMEM (Corning) with 10% FBS and 1% Pen/Strep (Corning). Transgenic cell lines with stable integration of constructs were generated by lentiviral transduction followed by selection in 2 ug/ml puromycin (Millipore), 500 ug/ml geneticin (Gibco), 4 ug/ml blasticidin (InvivoGen), 200 ug/ml hygromycin (Gibco) or 400 ug/ml zeocin (Invitrogen). Stable cell lines were maintained in half of the antibiotic concentration used for selection. Cell lines were regularly tested for mycoplasma and assayed for macroH2A status. When indicated, cells were treated with 0.5 ug/ml doxycycline (Clontech), 0.5 uM flavopiridol (Sigma), 5 uM GSK126 (Millipore), 2 uM 5-azacytidine (Sigma) or 20 nM Trichostatin A (Sigma).
Plasmids.
Full-length cDNA of mouse macroH2A1.1, macroH2A1.2 and macroH2A2 were cloned from WT DFs. MacroH2A isoforms were subcloned into pEGFP-N1 to add a C-terminal GFP tag. Tagged macroH2A isoforms were subcloned into lentiviral vectors pLVX (Clontech) for dox-inducible expression or pHAGE2 for constitutive expression under human EF-1α promoter. GFP and GFP-H2A (human) were subcloned into the same lentiviral vectors. Mouse H3.1 and macroH2A isoforms were subcloned into pSNAPf (NEB) to generate N-terminally SNAP-tagged H3.1 and C-terminally SNAP-tagged macroH2A isoforms. SNAP-tagged histones were subcloned into pHAGE2 for constitutive expression. Full-length and truncated macroH2A2s (histone fold region and non-histone region with NLS) were N-terminally GFP-tagged and subcloned into lentiviral vectors for constitutive expression. sgRNAs for Tks4 TSS deletion were designed using CRISPR Design Tool (http://crispr.mit.edu) and cloned into pLKO.1-sgRNA-mCherry. A scrambled sgRNA was used as control. sgRNA targeting Hoxc13 promoter was designed with Cas9 Activator Tool (http://sam.genome-engineering.org/database) and cloned into lenti-sgRNA(MS2)-Zeo. pLKO.1 based shRNA constructs (TRC lentiviral shRNA, Open Biosystems) were used for SPT16 knockdown. A scrambled shRNA (shScr) was used as control. Targeting sequences of all sgRNAs and shRNAs are listed in Supplementary Table 3.
Generation of clonal macroH2A-GFP-inducible dKO iDFs.
pLVX-Tet3G-Neo and pLVX encoding macroH2A2-GFP or macroH2A1.1-GFP were transduced into dKO iDFs followed by geneticin/puromycin selection. Single cells were isolated by FACS and expanded to establish clonal cell lines. Dox was added to a subculture of each clone for FACS analysis of macroH2A-GFP induction. Clones with the most synchronous induction kinetics were selected. Stable clones were maintained without dox until further experiments.
Generation of stable cell lines constitutively expressing epitope-tagged histones.
pHAGE2 encoding SNAP-tagged H3.1 or macroH2A isoforms were transduced into NIH 3T3 cells and WT iDFs. pHAGE2 encoding GFP, GFP-H2A and macroH2A-GFPs were transduced into dKO iDFs. Geneticin selection was performed to establish stable cell lines.
Hoxc13 transcriptional activation.
Lenti-dCas9-VP64-Blast and lenti-MS2-p65-HSF1-Hygro (synergistic activation mediator61) vectors were transduced into dKO iDFs expressing macroH2A2-GFP followed by blasticidin/hygromycin selection. Hoxc13 activation was achieved by subsequent lentiviral transduction of lenti-sgRNA(MS2)-Zeo targeting Hoxc13 promoter and zeocin selection. An empty lenti-sgRNA(MS2)-Zeo vector (sgEV) was use as control.
Tks4 TSS knockout.
Lenti-Cas9-Blast vector was first transduced into dKO iDFs constitutively expressing macroH2A2-GFP followed by blastidicin selection. A pair of sgRNAs encoded in pLKO.1-sgRNA-mCherry vector was subsequently introduced by lentiviral transduction to target ~1 kb upstream or downstream of the TSS, respectively. A scrambled sgRNA was used as control. mCherry+/GFP+ cells were sorted out and plated as single cells by flow cytometry. The expanded single clones were screened for homozygous TSS deletion by genomic PCR using primers listed in Supplementary Table 3. Clones with scrambled sgRNA were genotyped and used as wild type TSS control.
Flow cytometry.
For flow cytometric analysis of SNAP-tagged histone incorporation, 106 cells were seeded on a 6-well plate 24 hour prior to the experiment. Blocking was performed with 10 μM SNAP-Cell Block (NEB) for 30 minutes. After a chase of 3.5 hours, cells were detached with trypsin, resuspended in complete media with 3 μM SNAP-Cell TMR-Star (NEB) and incubated for 30 minutes at 37°C with gentle rotation. Nuclei were isolated and extracted by hypotonic lysis in the presence of 1% NP-40 and fixed with 1.5% paraformaldehyde. DNA was stained with 5 μg/ml Hoechst 33342 (Molecular Probes) prior to acquisition on an LSR II cytometer equipped with UV and yellow-green lasers (BD Biosciences). Data was analyzed using FlowJo (FlowJo, LLC). The SNAPc parameter was derived by normalizing the TMR-Star to the Hoechst signal level to account for the doubling of DNA/chromatin amount that occurs during S phase. For analysis of induced expression of macroH2A-GFP, dox-treated cells were detached with trypsin and GFP signal was assessed by an LSR II cytometer.
Fluorescence microscopy.
Labeling of newly synthesized histones in cells grown on coverslips was carried out as described previously with minor modifications21. Pre-existing histones were blocked with 10 μM SNAP-Cell Block for 15 minutes. Cells were allowed to synthesize and incorporate new histones for 4 hours. During the last 15 minutes of incubation, cells were treated with 3 μM SNAP-Cell TMR-Star and 10 μM EdU (Molecular Probes). Pre-extraction of soluble proteins with 0.5% Triton X-100 in CSK buffer was carried out to ensure that the SNAP signal reflected only chromatin-incorporated histones. After fixation. EdU was labeled with the Click-iT Plus Alexa Fluor 647 Picolyl Azide Toolkit (Molecular Probes) using 200 nM dye azide. For immunodetection of endogenous macroH2As in iDFs, permeabilization was carried out after PFA fixation. We used primary antibodies as indicated in Supplementary Table 4 and secondary antibodies conjugated to Alexa Fluor 488 (Molecular Probes). DNA was counterstained with 5 μg/ml Hoechst 33342 (Molecular Probes) and slides were mounted in ProLong Gold (Molecular Probes). Images were acquired on a Zeiss LSM780 confocal microscope using a 40X objective, 2X internal magnification and an optimum voxel size determined by the Zeiss Zen software. Maximum intensity projections of Z-stacks are shown.
Chromatin isolation, whole-cell extract preparation and immunoblotting.
Chromatin fractionation was performed as described62. Whole-cell extracts were prepared using 3~4 million iDFs. Cells were lysed on ice with 400 ul RIPA buffer (50 mM Tris, pH 8.0, 150 mM NaCl, 5mM EDTA, 0.1% SDS, 0.5% sodium deoxycholate, 1% NP-40 and 1× protease inhibitor cocktail). The lysate was sonicated with Bioruptor (Diagenode) at high for 5 cycles and spun at 14,000 r.p.m. for 10 min at 4°C. The supernatant was collected and protein concentration was determined by BCA assay (Thermo Fisher). Samples were boiled in Laemmli buffer (Bio-Rad) at 95°C for 5 min for Immunoblotting with antibodies listed in Supplementary Table 4.
Native ChIP-seq.
nChIP was performed as previously described with modifications23. Buffers were supplemented with 0.5 mM DTT, 0.1 mM PMSF and 1× protease inhibitor cocktail (-EDTA). Nuclei isolation was performed with 30~40 million iDFs. Cells were resuspended with 2 ml Buffer I (0.32 M sucrose, 15 mM Tris, pH 7.5, 60 mM KCl, 15 mM NaCl, 5 mM MgCl2 and 0.1 mM EGTA). 2 ml Buffer II (Buffer I with 0.4% NP-40) was added to the cell suspension, mixed and incubated on ice for 10 min. The mixture was layered onto 8 ml of Buffer III (1.2 M sucrose, 15 mM Tris, pH 7.5, 60 mM KCl, 15 mM NaCl, 5 mM MgCl2 and 0.1 mM EGTA). Nuclei were pelleted at 10,000g for 20 min at minimum deceleration. The supernatant was removed and nuclei were gently resuspended with 50 ul Buffer A (0.32 M sucrose, 50 mM Tris, pH 7.5, 4 mM MgCl2 and 1 mM CaCl2) per 5 million cells and stored at −80°C. For each ChIP, an aliquot of 5 million cells was thawed on ice and diluted with 350 ul of Buffer A. CaCl2 was added to 3 mM, 8.5 U MNase (Affymetrix) was added and reaction was incubated at 37°C for 10 min. The reaction was stopped by adding EGTA to 10 mM. Nuclei were spun down at 10,000g for 7 min. The supernatant was collected as S1 (mostly mononucleosomes). The pellet was gently resuspended with 400 ul of Buffer B (50 mM Tris, pH 7.5, 300 mM NaCl, 2 mM EDTA and 0.1% NP-40) and extracted at 4°C for 2 hours with head-to-head rotation. Nuclei were spun down and supernatant was collected as S2 (longer chromatin fragments). S1 and S2 were pooled and further cleared at maximum speed for 5 min. Chromatin concentration was quantified spectroscopically (OD260). For each immunoprecipitation, 100 ug chromatin was mixed with Buffer C (50 mM Tris, pH 7.5, 150 mM NaCl, 2 mM EDTA, 0.05% NP-40) to 1 ml. 50 ul was taken as input. For GFP IP, 20 ul GFP-Trap_MA (ChromoTek) bead slurry was added followed by a 2.5-hour incubation at 4°C. For IP with antibody, antibodies listed in Supplementary Table 4 were added and incubated at 4°C overnight. 30 ul of Magna ChIP Protein A+G magnetic beads (Millipore) were added and incubated for 2 hours. After IP, beads were washed once with Buffer G 150 (50 mM Tris, pH 7.5, 150 mM NaCl, 0.5% NP-40), twice with Buffer G 250 (50 mM Tris, pH 7.5, 250 mM NaCl, 0.5% NP-40), and once with TE buffer (10 mM Tris, pH 7.5 and 1 mM EDTA). Input and beads were incubated with 50 ug/ml RNase A for 1 hour at 37°C in 200 ul TE. SDS was added to 0.5% and Proteinase K to 500 ug/ml. Samples were incubated overnight at 56°C with constant mixing. Supernatant was collected from the beads. Input/ChIP DNA were purified with QIAquick PCR purification kit (Qiagen) and analyzed/quantified using Agilent 2100 Bioanalyzer High Sensitivity Kit. qPCR was performed using FastStart Universal SYBR Green Master Mix (Rox) (Roche). Primers used are listed in Supplementary Table 5.
nChIP-seq libraries were prepared as previously described with minor changes23. Briefly, 8–10 ng input or ChIP DNA was end-repaired with T4 DNA polymerase (NEB), DNA polymerase I large (Klenow) fragment (NEB) and T4 polynucleotide kinase (NEB) in the presence of dNTPs (Roche). Next, dA-tailing was done using Klenow fragment (3’->5’ exo-, NEB) with dATP (Roche) in NEB Buffer 2. Barcoded Illumina Truseq adaptors were ligated using Quick Ligase (NEB). Libraries were size-selected using agarose gel electrophoresis and the band corresponding to mononucleosomal DNA was cut out and extracted. Size-selected libraries were amplified using KAPA HiFi DNA Polymerase (KAPA biosystems). Optimal number of PCR cycles was determined by qPCR as described63 to make sure libraries were minimally amplified. Size distribution and level of amplification were determined by analysis using Agilent bioanalyzer. Resulting libraries were quantified by Qubit (ThermoFisher), multiplexed and subject to 80-bp single-end sequencing with an Illumina NextSeq 500 instrument, acquiring at least 100 million reads for each sample.
ChIP-seq analysis.
Sequenced reads were aligned to the GRCm38 (mm10) assembly of mouse genome using Bowtie64 (1.1.2) with “-n 2 -l 65 -k 1 -M 5 --best”. Redundant reads were removed using MACS265 (2.1.0) filterdup option with default parameters. Proportion of background reads was calculated using NCIS66. ChIP/input fold enrichment (FE) pileups were generated using MACS2 callpeak module with “--bdg --nomodel --extsize 150” coupled with MACS2 bdgcmp module with “-m FE” using ChIP pileup and control lambda scaled to the same sequencing depth. Such pileups represent sequencing depth and background (input) normalized relative enrichment signal. Conversion to bigwig files was performed using bedGraphToBigWig (v4) from UCSC utilities. Peaks were called using SICER67 (1.1) with “fragment size 150 bp, window size 200 bp, gap size 800 bp and FDR < 0.01”. MCDs were called using SICER with “fragment size 150 bp, window size 1000 bp, gap size 4000 bp and FDR < 0.01”. Metagene analysis was performed with the computeMatrix, plotProfile and plotHeatmap modules from DeepTools68 (2.4.0). For analysis at genes, the mouse Ensembl genes 85 version (GRCm38.p4) was used. ChIP/input FE bigwig files were used and regions analyzed were divided into 100 bp non-overlapping bins, of which the average score was calculated. For analysis at macroH2A peaks and MCDs, 100 and 500 bp bins were used, respectively. For boxplot and scatterplot analysis with R (3.0.0), ChIP enrichment scores at individual genes or peaks were calculated using ‘multiBigwigSummary BED-file’ from DeepTools, with each region as a bin and ChIP/input FE bigwig files as input, followed by normalization to the size of the corresponding region. Pruning index value for each gene was calculated as the log2 value of macroH2A2 enrichment score at 6 hours divided by 24 hours at gene body. Genome-wide Spearman’s correlation analysis was performed using ‘multiBigwigSummary bins’ from DeepTools; ChIP/input FE bigwig files were used as input and the entire genome was divided into 100bp non-overlapping bins. Average distance between genes and their nearest MCDs was calculated using Genomic HyperBrowser69 (v2.0) on segment-to-segment distance mode. The hypothesis that transient peaks localized closer to MCDs than expected by chance was tested using Genomic HyperBrowser. Transient peaks were randomized 10,000 times preserving segment length and inter-segment gaps. Observed/expected values were calculated by dividing the average distance between transient peaks and their nearest MCDs by that between randomized peaks and their nearest MCDs. The hypothesis that one set of regions (A) falling inside another set of regions (B) more than expected by chance was tested using Genomic HyperBrowser. Regions in A are represented by their midpoint, which are randomized 10,000 times preserving inter-point distances. Observed/expected values were calculated by dividing the number of points in A falling inside regions in B by the number of the randomized points falling inside regions in B.
RNA extraction and RT-qPCR.
Total RNA was extracted using RNeasy Mini Kit (Qiagen) according to manufacturer’s protocol. cDNA was generated using First-Strand cDNA Synthesis System (ORIGENE). qPCR was performed using FastStart Universal SYBR Green Master Mix (Rox) (Roche). Primers used are listed in Supplementary Table 6.
RNA-seq library preparation.
RNA-seq was performed with three biological replicates (independent cultures). ~0.5 million iDFs were used for each RNA isolation. Total RNA was extracted using RNeasy Mini Kit (Qiagen). RNA quality control was performed using Agilent RNA 6000 Nano Kit and all samples have RNA Integrity Number (RIN) higher than 9.8. 1.5 ug total RNA was used for poly(A) mRNA selection using NEBNext Poly(A) mRNA Magnetic Isolation Module (NEB) according to manufacturer’s protocol. Directional, strand-specific RNA libraries were prepared using NEXTflex Rapid Directional RNA-seq Kit (Bioo Scientific) according manufacturer’s protocol. Quality of libraries was analyzed using Agilent bioanalyzer. Barcoded libraries were multiplexed and subject to 80-bp single-end sequencing with an Illumina NextSeq 500 instrument.
RNA-seq analysis.
Sequenced reads were aligned to mouse Ensembl genes 85 version (GRCm38.p4) using STAR70 (2.5.2b) with default parameters. Genes larger than 200bp were analyzed. Pileup bedgraph files (reads per million) was generated using STAR and converted to bigwig format using bedGraphToBigWig. Differential expression analysis was performed with Cuffdiff in Cufflinks71 (2.2.1) package with cutoff ‘FDR < 0.05’. FPKM expression values were calculated by Cufflinks.
MNase IP and label-free qMS.
MNase IP were performed with three biological replicates (independent cultures). Buffers were supplemented with 1 mM DTT and 1× protease inhibitor cocktail (-EDTA). Each IP replicate was performed with ~300 million iDFs. Cells were resuspended in PBS with 0.2% Triton X-100 and incubated for 10 min at 4°C with head-to-head rotation. Nuclei were pelleted down, washed with PBS and resuspended with 3 ml EX-100 (10 mM HEPES, pH 7.6, 100 mM NaCl, 1.5 mM MgCl2, 0.5 mM EGTA, 10% glycerol). CaCl2 was added to 2 mM. 12 ul MNase (NEB) was added and the reaction was incubated at 37°C for 10 min. The reaction was stopped by adding EGTA to 10 mM and nuclei were pelleted at 10,000g for 10 min. The supernatant (mostly mononuclesomes) was collected for IP. NaCl was adjusted to 150 mM and NP-40 to 0.1%, followed by clarification at 10,000g for 10 min. 150 ul GFP-Trap_MA (ChromoTek) bead slurry was added and incubated for 4 hours at 4°C. The beads were then washed once with Buffer G 150, twice with Buffer G 250, and three times with Buffer G 150 without NP-40. 5% of beads were boiled with Laemmli buffer for silver staining. For MS, affinity purified proteins were reduced, alkylated, and loaded onto an SDS-PAGE gel to remove detergents and LCMS-incompatible reagents. The gel plugs were excised, destained, and subjected to proteolytic digestion with trypsin. The resulting peptides were extracted and desalted as previously described72. An aliquot of peptides was analyzed with LCMS coupled to an Orbitrap Q Exactive Mass Spectrometer (Thermo Scientific) operated in data dependent mode as previously described72. The data was searched against a UniProt mouse database (downloaded 10/2015), using Andromeda73 within the MaxQuant74 software suite (Version 1.5.3.30). Proteins were quantified using the Intensity-based absolute quantification (iBAQ)75 within MaxQuant. The data can be found in Supplementary Table 7. Heatmap of iBAQ values of selected interacting proteins was generated using web-based tool Morpheus (https://software.broadinstitute.org/morpheus/).
IP with soluble nuclear extract.
Nuclear extracts were prepared essentially according to Dignam et al.76. Buffers were supplemented with 0.5 mM DTT, 0.5 mM PMSF and 1× protease inhibitor cocktail. 30~50 million cells were swollen in hypotonic buffer (10 mM HEPES, pH 7.9, 10 mM KCl, 1.5 mM MgCl2) and nuclei were isolated by homogenization with 6 strokes using a 27g needle. Nuclei were pelleted and extracted for 30 min at 4°C with high salt buffer (20 mM HEPES, pH 7.9, 420 mM NaCl, 1.5 mM MgCl2, 0.2 mM EDTA, 25% glycerol) with 0.1% NP-40. Nuclei were pelleted and supernatant taken for IP. The nuclear extract was diluted with 1.8 volume of hypotonic buffer with 0.1% NP-40 to obtain final NaCl concentration of 150mM and cleared at 40,000g for 30 min at 4°C. IP with GFP-trap and subsequent washes were performed as described in MNase IP. For macroH2A2 endogenous IPs, nuclear extract was incubated with 30 ul anti-macroH2A2 serum overnight, followed by a 2-hour incubation with 50 ul Pierce Protein A/G magnetic beads (ThermoFisher).
IP with chromatin-free cell extract.
Chromatin-free cell extract was prepared as described33. IP with GFP-trap was performed as described in MNase IP.
Statistics and reproducibility.
All ChIP-qPCR and RT-qPCR experiments were repeated at least twice as independent biological replicates and results are presented as mean ± s.d. Value used for each biological replicate represents mean of three technical replicates. All experiments presented as Western blot images have been repeated at least twice with similar results.
Data availability.
ChIP-seq and RNA-seq data have been deposited to GEO under accession number GSE109740. Source data for Fig. 3e-g, Fig. 5j,k, Fig. 6d,g-i, and Fig. 7g,h are available online. Additional data are available upon reasonable reques
Supplementary Material
Acknowledgements.
The authors thank J. Pehrson from University of Pennsylvania for sharing macroH2A dKO mice; R. Fisher, J. Jin, R. Parsons, Y. Hoshida and S. Aaronson from Icahn School of Medicine at Mount Sinai for sharing equipment or reagents; R. Fisher for helpful advices; A. Cook and D. Hasson from the Bernstein lab for critically reading the manuscript; the Tisch Cancer Institute Genomics Core Facility at ISMMS, particularly G. Panda for sequencing assistance; the Flow Cytometry Core at ISMMS for help with cell sorting. This work was supported by Scientific Computing at ISMMS, Office of Research Infrastructure of the NIH to ISMMS (S10OD018522), ISMMS Cancer Center Support Grant P30CA196521 and NIH/NCI R01CA154683 (E.B.).
Footnotes
Author Contributions. Z.S. and E.B. conceived of this study. A.G.M. isolated and immortalized dermal fibroblasts. Z.S. and D.F. characterized iDFs. Z.S. generated and characterized all macroH2A constructs and inducible/constitutive macroH2A-expression iDF cell lines. D.F. performed SNAP-tag experiments with the help of Z.S. Z.S. performed nChIP-seq, RNA-seq, nChIP-qPCR, RT-qPCR, and all bioinformatic and statistical analysis; performed drug treatment, shRNA-based knockdown, and CRISPR/Cas9-based knockout and activation experiments. A.G.M. performed H2A.Z nChIP-seq. Z.S. performed IPs for qMS, silver staining, IP validations and immunoblotting analysis. J.A. performed qMS under the supervision of B.U., J.A. and Z.S. performed qMS data analysis. Z.S., D.F. and E.B. designed experiments and interpreted results. Z.S. and E.B. wrote the manuscript with input from all other authors.
Competing Financial Interests. The authors declare no competing financial interests.
The authors have no competing interests.
References
- 1.Weber CM & Henikoff S Histone variants: dynamic punctuation in transcription. Genes Dev. 28, 672–82 (2014). [DOI] [PMC free article] [PubMed] [Google Scholar]
- 2.Buschbeck M & Hake SB Variants of core histones and their roles in cell fate decisions, development and cancer. Nat. Rev. Mol. Cell Biol 18, 299–314 (2017). [DOI] [PubMed] [Google Scholar]
- 3.Doyen C et al. Mechanism of Polymerase II Transcription Repression by the Histone Variant Mechanism of Polymerase II Transcription Repression by the Histone Variant macroH2A. Mol. Cell. Biol 26, 1156–1164 (2006). [DOI] [PMC free article] [PubMed] [Google Scholar]
- 4.Angelov D et al. The Histone Variant MacroH2A Interferes with Transcription Factor Binding and SWI / SNF Nucleosome Remodeling. Mol. Cell 11, 1033–1041 (2003). [DOI] [PubMed] [Google Scholar]
- 5.Gamble MJ, Frizzell KM, Yang C, Krishnakumar R & Kraus WL The histone variant macroH2A1 marks repressed autosomal chromatin, but protects a subset of its target genes from silencing. Genes Dev. 24, 21–32 (2010). [DOI] [PMC free article] [PubMed] [Google Scholar]
- 6.Chen H et al. MacroH2A1.1 and PARP-1 cooperate to regulate transcription by promoting CBP-mediated H2B acetylation. Nat. Struct. Mol. Biol 21, 981–9 (2014). [DOI] [PMC free article] [PubMed] [Google Scholar]
- 7.Timinszky G et al. A macrodomain-containing histone rearranges chromatin upon sensing PARP1 activation. Nat. Struct. Mol. Biol 16, 923–9 (2009). [DOI] [PubMed] [Google Scholar]
- 8.Kim J et al. Replication Stress Shapes a Protective Chromatin Environment across Fragile Genomic Regions. Mol. Cell 69, 36- (2018). [DOI] [PMC free article] [PubMed] [Google Scholar]
- 9.Pasque V, Gillich A, Garrett N & Gurdon JB Histone variant macroH2A confers resistance to nuclear reprogramming. EMBO J. 30, 2373–87 (2011). [DOI] [PMC free article] [PubMed] [Google Scholar]
- 10.Gaspar-Maia A et al. MacroH2A histone variants act as a barrier upon reprogramming towards pluripotency. Nat. Commun. 4, 1565 (2013). [DOI] [PMC free article] [PubMed] [Google Scholar]
- 11.Kapoor A et al. The histone variant macroH2A suppresses melanoma progression through regulation of CDK8. Nature 468, 1105–1109 (2010). [DOI] [PMC free article] [PubMed] [Google Scholar]
- 12.Buschbeck M et al. The histone variant macroH2A is an epigenetic regulator of key developmental genes. Nat. Struct. Mol. Biol 16, 1074–9 (2009). [DOI] [PubMed] [Google Scholar]
- 13.Zhang R et al. Formation of MacroH2A-containing senescence-associated heterochromatin foci and senescence driven by ASF1a and HIRA. Dev. Cell 8, 19–30 (2005). [DOI] [PubMed] [Google Scholar]
- 14.Douet J et al. MacroH2A histone variants maintain nuclear organization and heterochromatin architecture. J. Cell Sci. 130, 1570–1582 (2017). [DOI] [PubMed] [Google Scholar]
- 15.Changolkar LN et al. Genome-wide distribution of macroH2A1 histone variants in mouse liver chromatin. Mol. Cell. Biol 30, 5473–83 (2010). [DOI] [PMC free article] [PubMed] [Google Scholar]
- 16.Costanzi C & Pehrson JR Histone macroH2A1 is concentrated in the inactive X chromosome of female mammals. Nature 393, 599–601 (1998). [DOI] [PubMed] [Google Scholar]
- 17.Hernández-Muñoz I et al. Stable X chromosome inactivation involves the PRC1 Polycomb complex and requires histone MACROH2A1 and the CULLIN3/SPOP ubiquitin E3 ligase. Proc. Natl. Acad. Sci. U. S. A 102, 7635–40 (2005). [DOI] [PMC free article] [PubMed] [Google Scholar]
- 18.Pehrson JR, Changolkar LN, Costanzi C & Leu NA Mice Without MacroH2A Histone Variants. Mol. Cell. Biol 34, 4523–33 (2014). [DOI] [PMC free article] [PubMed] [Google Scholar]
- 19.Oksuz O et al. Capturing the onset of PRC2-mediated repressive domain formation. Mol. Cell 70, 1149–1162 (2018). [DOI] [PMC free article] [PubMed] [Google Scholar]
- 20.Zhang K, Mosch K, Fischle W & Grewal SIS Roles of the Clr4 methyltransferase complex in nucleation, spreading and maintenance of heterochromatin. Nat. Struct. Mol. Biol 15, 381–8 (2008). [DOI] [PubMed] [Google Scholar]
- 21.Boyarchuk E, Filipescu D, Vassias I, Cantaloube S & Almouzni G The histone variant composition of centromeres is controlled by the pericentric heterochromatin state during the cell cycle. J. Cell Sci. 127, 3347–3359 (2014). [DOI] [PubMed] [Google Scholar]
- 22.Ahmad K & Henikoff S The Histone Variant H3.3 Marks Active Chromatin by Replication-Independent Nucleosome Assembly. Mol. Cell 9, 1191–1200 (2002). [DOI] [PubMed] [Google Scholar]
- 23.Fontanals-Cirera B et al. Harnessing BET Inhibitor Sensitivity Reveals AMIGO2 as a Melanoma Survival Gene. Mol. Cell 68, 731–744 (2017). [DOI] [PMC free article] [PubMed] [Google Scholar]
- 24.Vardabasso C et al. Histone Variant H2A.Z.2 Mediates Proliferation and Drug Sensitivity of Malignant Melanoma. Mol. Cell 59, 75–88 (2015). [DOI] [PMC free article] [PubMed] [Google Scholar]
- 25.Bulut-Karslioglu A et al. Suv39h-dependent H3K9me3 marks intact retrotransposons and silences LINE elements in mouse embryonic stem cells. Mol. Cell 55, 277–90 (2014). [DOI] [PubMed] [Google Scholar]
- 26.Core LJ, Waterfall JJ & Lis JT Nascent RNA sequencing reveals widespread pausing and divergent initiation at human promoters. Science 322, 1845–1848 (2008). [DOI] [PMC free article] [PubMed] [Google Scholar]
- 27.Yildirim E, Sadreyev RI, Pinter SF & Lee JT X-chromosome hyperactivation in mammals via nonlinear relationships between chromatin states and transcription. Nat. Struct. Mol. Biol 19, 56–62 (2012). [DOI] [PMC free article] [PubMed] [Google Scholar]
- 28.Posavec Marjanović M et al. MacroH2A1.1 regulates mitochondrial respiration by limiting nuclear NAD+ consumption. Nat. Struct. Mol. Biol 24, 902–910 (2017). [DOI] [PMC free article] [PubMed] [Google Scholar]
- 29.Yue F et al. A comparative encyclopedia of DNA elements in the mouse genome. Nature 515, 355–364 (2014). [DOI] [PMC free article] [PubMed] [Google Scholar]
- 30.Mousavi K, Zare H, Wang AH & Sartorelli V Polycomb Protein Ezh1 Promotes RNA Polymerase II Elongation. Mol. Cell 45, 255–262 (2012). [DOI] [PMC free article] [PubMed] [Google Scholar]
- 31.Jonkers I, Kwak H & Lis JT Genome-wide dynamics of Pol II elongation and its interplay with promoter proximal pausing, chromatin, and exons. Elife 3, e02407 (2014). [DOI] [PMC free article] [PubMed] [Google Scholar]
- 32.Chao SH & Price DH Flavopiridol inactivates P-TEFb and blocks most RNA polymerase II transcription in vivo. J. Biol. Chem 276, 31793–9 (2001). [DOI] [PubMed] [Google Scholar]
- 33.Ratnakumar K et al. ATRX-mediated chromatin association of histone variant macroH2A1 regulates α-globin expression. Genes Dev. 26, 433–438 (2012). [DOI] [PMC free article] [PubMed] [Google Scholar]
- 34.Lu H et al. Compensatory induction of MYC expression by sustained CDK9 inhibition via a BRD4-dependent mechanism. Elife 4, e06535 (2015). [DOI] [PMC free article] [PubMed] [Google Scholar]
- 35.McCabe MT et al. EZH2 inhibition as a therapeutic strategy for lymphoma with EZH2-activating mutations. Nature 492, 108–112 (2012). [DOI] [PubMed] [Google Scholar]
- 36.Hammond CM, Strømme CB, Huang H, Patel DJ & Groth A Histone chaperone networks shaping chromatin function. Nat. Rev. Mol. Cell Biol 18, 141–158 (2017). [DOI] [PMC free article] [PubMed] [Google Scholar]
- 37.Ouararhni K et al. The histone variant mH2A1.1 interferes with transcription by down-regulating PARP-1 enzymatic activity. Genes Dev. 20, 3324–36 (2006). [DOI] [PMC free article] [PubMed] [Google Scholar]
- 38.Mehrotra PV et al. DNA repair factor APLF is a histone chaperone. Mol. Cell 41, 46–55 (2011). [DOI] [PMC free article] [PubMed] [Google Scholar]
- 39.Belotserkovskaya R et al. FACT facilitates transcription-dependent nucleosome alteration. Science 301, 1090–3 (2003). [DOI] [PubMed] [Google Scholar]
- 40.Jeronimo C, Watanabe S, Kaplan CD, Peterson CL & Robert F The Histone Chaperones FACT and Spt6 Restrict H2A.Z from Intragenic Locations. Mol. Cell 58, 1113–1123 (2015). [DOI] [PMC free article] [PubMed] [Google Scholar]
- 41.Choi ES et al. Factors That Promote H3 Chromatin Integrity during Transcription Prevent Promiscuous Deposition of CENP-ACnp1 in Fission Yeast. PLoS Genet. 8, (2012). [DOI] [PMC free article] [PubMed] [Google Scholar]
- 42.Safina A et al. Complex mutual regulation of facilitates chromatin transcription (FACT) subunits on both mRNA and protein levels in human cells. Cell Cycle 12, 2423–2434 (2013). [DOI] [PMC free article] [PubMed] [Google Scholar]
- 43.Deal RB, Henikoff JG & Henikoff S Genome-wide kinetics of nucleosome turnover determined by metabolic labeling of histones. Science 328, 1161–4 (2010). [DOI] [PMC free article] [PubMed] [Google Scholar]
- 44.Ray-Gallet D et al. Dynamics of Histone H3 Deposition In Vivo Reveal a Nucleosome Gap-Filling Mechanism for H3.3 to Maintain Chromatin Integrity. Mol. Cell 44, 928–941 (2011). [DOI] [PubMed] [Google Scholar]
- 45.Kraushaar DC et al. Genome-wide incorporation dynamics reveal distinct categories of turnover for the histone variant H3.3. Genome Biol. 14, R121 (2013). [DOI] [PMC free article] [PubMed] [Google Scholar]
- 46.Costanzi C, Stein P, Worrad DM, Schultz RM & Pehrson JR Histone macroH2A1 is concentrated in the inactive X chromosome of female preimplantation mouse embryos. Development 127, 2283–9 (2000). [DOI] [PubMed] [Google Scholar]
- 47.Chang C-C et al. A maternal store of macroH2A is removed from pronuclei prior to onset of somatic macroH2A expression in preimplantation embryos. Dev. Biol. 278, 367–80 (2005). [DOI] [PubMed] [Google Scholar]
- 48.Sansoni V et al. The histone variant H2A.Bbd is enriched at sites of DNA synthesis. Nucleic Acids Res. 42, 6405–6420 (2014). [DOI] [PMC free article] [PubMed] [Google Scholar]
- 49.Okuwaki M, Kato K & Nagata K Functional characterization of human nucleosome assembly protein 1-like proteins as histone chaperones. Genes to Cells 15, 13–27 (2010). [DOI] [PubMed] [Google Scholar]
- 50.Chakravarthy S & Luger K The histone variant macro-H2A preferentially forms ‘hybrid nucleosomes’. J. Biol. Chem. 281, 25522–25531 (2006). [DOI] [PubMed] [Google Scholar]
- 51.Nakayama T, Nishioka K, Dong YX, Shimojima T & Hirose S Drosophila GAGA factor directs histone H3.3 replacement that prevents the heterochromatin spreading. Genes Dev. 21, 552–561 (2007). [DOI] [PMC free article] [PubMed] [Google Scholar]
- 52.Bernstein E et al. A phosphorylated subpopulation of the histone variant macroH2A1 is excluded from the inactive X chromosome and enriched during mitosis. Proc. Natl. Acad. Sci. U. S. A. 105, 1533–8 (2008). [DOI] [PMC free article] [PubMed] [Google Scholar]
- 53.Boyer L a et al. Core transcriptional regulatory circuitry in human embryonic stem cells. Cell 122, 947–56 (2005). [DOI] [PMC free article] [PubMed] [Google Scholar]
- 54.Pavri R et al. Histone H2B monoubiquitination functions cooperatively with FACT to regulate elongation by RNA polymerase II. Cell 125, 703–17 (2006). [DOI] [PubMed] [Google Scholar]
- 55.Schmitges FW et al. Histone methylation by PRC2 is inhibited by active chromatin marks. Mol. Cell 42, 330–41 (2011). [DOI] [PubMed] [Google Scholar]
- 56.Wang X et al. Molecular analysis of PRC2 recruitment to DNA in chromatin and its inhibition by RNA. Nat. Struct. Mol. Biol. 24, 1028–1038 (2017). [DOI] [PMC free article] [PubMed] [Google Scholar]
- 57.Mendenhall EM et al. GC-rich sequence elements recruit PRC2 in mammalian ES cells. PLoS Genet. 6, 1–10 (2010). [DOI] [PMC free article] [PubMed] [Google Scholar]
- 58.Hosogane M, Funayama R, Shirota M & Nakayama K Lack of Transcription Triggers H3K27me3 Accumulation in the Gene Body. Cell Rep. 16, 696–706 (2016). [DOI] [PubMed] [Google Scholar]
- 59.Riising EM et al. Gene silencing triggers polycomb repressive complex 2 recruitment to CpG Islands genome wide. Mol. Cell 55, 347–360 (2014). [DOI] [PubMed] [Google Scholar]
- 60.Højfeldt JW et al. Accurate H3K27 methylation can be established de novo by SUZ12-directed PRC2. Nat. Struct. Mol. Biol 25, 225–232 (2018). [DOI] [PMC free article] [PubMed] [Google Scholar]
- 61.Konermann S et al. Genome-scale transcriptional activation by an engineered CRISPR-Cas9 complex. Nature 517, 583–8 (2015). [DOI] [PMC free article] [PubMed] [Google Scholar]
- 62.Chung C-Y et al. Cbx8 Acts Non-canonically with Wdr5 to Promote Mammary Tumorigenesis. Cell Rep. 16, 472–486 (2016). [DOI] [PMC free article] [PubMed] [Google Scholar]
- 63.Buenrostro JD, Wu B, Chang HY & Greenleaf WJ ATAC-seq: A Method for Assaying Chromatin Accessibility Genome-Wide. Curr. Protoc. Mol. Biol 109, 2129 1–9 (2015). [DOI] [PMC free article] [PubMed] [Google Scholar]
- 64.Langmead B, Trapnell C, Pop M & Salzberg SL Ultrafast and memory-efficient alignment of short DNA sequences to the human genome. Genome Biol. 10, R25 (2009). [DOI] [PMC free article] [PubMed] [Google Scholar]
- 65.Zhang Y et al. Model-based analysis of ChIP-Seq (MACS). Genome Biol. 9, R137 (2008). [DOI] [PMC free article] [PubMed] [Google Scholar]
- 66.Liang K & Keleş S Normalization of ChIP-seq data with control. BMC Bioinformatics 13, 199 (2012). [DOI] [PMC free article] [PubMed] [Google Scholar]
- 67.Zang C et al. A clustering approach for identification of enriched domains from histone modification ChIP-Seq data. Bioinformatics 25, 1952–1958 (2009). [DOI] [PMC free article] [PubMed] [Google Scholar]
- 68.Ramírez F et al. deepTools2: a next generation web server for deep-sequencing data analysis. Nucleic Acids Res. 44, W160–5 (2016). [DOI] [PMC free article] [PubMed] [Google Scholar]
- 69.Sandve GK et al. The Genomic HyperBrowser: inferential genomics at the sequence level. Genome Biol. 11, R121 (2010). [DOI] [PMC free article] [PubMed] [Google Scholar]
- 70.Dobin A et al. STAR: Ultrafast universal RNA-seq aligner. Bioinformatics 29, 15–21 (2013). [DOI] [PMC free article] [PubMed] [Google Scholar]
- 71.Trapnell C et al. Differential gene and transcript expression analysis of RNA-seq experiments with TopHat and Cufflinks. Nat. Protoc. 7, 562–578 (2012). [DOI] [PMC free article] [PubMed] [Google Scholar]
- 72.Peled M et al. Affinity purification mass spectrometry analysis of PD-1 uncovers SAP as a new checkpoint inhibitor. Proc. Natl. Acad. Sci. U. S. A 115, E468–E477 (2018). [DOI] [PMC free article] [PubMed] [Google Scholar]
- 73.Cox J et al. Andromeda: A peptide search engine integrated into the MaxQuant environment. J. Proteome Res. 10, 1794–1805 (2011). [DOI] [PubMed] [Google Scholar]
- 74.Cox J & Mann M MaxQuant enables high peptide identification rates, individualized p.p.b.-range mass accuracies and proteome-wide protein quantification. Nat. Biotechnol. 26, 1367–72 (2008). [DOI] [PubMed] [Google Scholar]
- 75.Schwanhüusser B et al. Global quantification of mammalian gene expression control. Nature 473, 337–342 (2011). [DOI] [PubMed] [Google Scholar]
- 76.Dignam JD, Lebovitz RM & Roeder RG Accurate transcription initiation by RNA polymerase II in a soluble extract from isolated mammalian nuclei. Nucleic Acids Res. 11, 1475–89 (1983). [DOI] [PMC free article] [PubMed] [Google Scholar]
Associated Data
This section collects any data citations, data availability statements, or supplementary materials included in this article.
Supplementary Materials
Data Availability Statement
ChIP-seq and RNA-seq data have been deposited to GEO under accession number GSE109740. Source data for Fig. 3e-g, Fig. 5j,k, Fig. 6d,g-i, and Fig. 7g,h are available online. Additional data are available upon reasonable reques