

Summary
Pre-mRNA splicing is an essential step in the expression of most human genes. Mutations at the 5′ splice site (5′ss) frequently cause defective splicing and disease, due to interference with the initial recognition of the exon-intron boundary by U1 small nuclear ribonucleoprotein (snRNP), a component of the spliceosome. Here we use a massively parallel splicing assay (MPSA) in human cells to quantify the activity of all 32,768 unique 5′ss sequences (NNN/GYNNNN) in three different gene contexts. Our results reveal that, although splicing efficiency is mostly governed by the 5′ss sequence, there are substantial differences in this efficiency across gene contexts. Among other uses, these MPSA measurements facilitate the prediction of 5′ss sequence variants that are likely to cause aberrant splicing. This approach provides a framework to assess potential pathogenic variants in the human genome, and to streamline the development of splicing-corrective therapies.
Introduction
Pre-mRNA splicing is the process of joining exon sequences, with the concomitant removal of noncoding intron sequences, to generate mature mRNA in the nucleus. Alternative splicing affects about 95% of the genes in multicellular eukaryotes, allowing for the generation of over 100,000 proteins from about 23,000 protein-coding sequences, thus greatly expanding the coding capacity of eukaryotic genomes (Nilsen and Graveley, 2010). Splicing is a largely co-transcriptional and highly regulated process that involves the dynamic recruitment and assembly of many components, including the core spliceosome that comprises about 200 proteins and five snRNAs, which work in concert with remarkable precision (Will et al., 2011). Mutations in cis-elements essential for splicing or its regulation (i.e., the 5′ splice site, 3′ splice site, branchpoint sequence, and intronic or exonic enhancer and silencer elements) and deregulation of splicing-factor expression cause or contribute to the development of many human diseases. It is estimated that 14% of all disease-associated point mutations affect splice sites (Krawczak et al., 2000; Soemedi et al., 2017), and that as many as 50% of all mutations alter splicing, when accounting for mutations that affect enhancer and silencer elements (Cartegni et al., 2002). Such mutations cause aberrant splicing of relevant genes in cancer, neuromuscular, and other diseases (Krawczak et al., 1992; Srebrow et al., 2006).
The 5′ splice site (5′ss) is a 9-nucleotide motif that demarcates the boundary between an exon and the intron that follows it. It comprises 3 nucleotides at the end of the upstream exon (-3 to -1) and 6 nucleotides at the beginning of the intron (+1 to +6). This 9-nucleotide motif has a consensus sequence of CAG/GUAAGU, which is precisely complementary to a sequence at the 5′ end of U1 snRNA (Lerner et al., 1980; Rogers and Wall, 1980; Zhuang and Weiner, 1986). The great majority of introns are of the U2-type, and are spliced by the major spliceosome (with U1, U2, U4, U5, and U6 snRNAs/snRNPs). Only a small subset of introns is of the U12-type, and are spliced by the minor spliceosome (with U11, U12, U4atac, U6atac, and U5 snRNAs/snRNPs) (Tarn et al., 1995). Among U2-type introns, 98.8% have GU at the +1 and +2 positions of the 5′ss, whereas only 0.87% have GC (Sheth et al., 2006). The remaining 0.33% of U2-type introns have non-consensus sites, such as introns with 5′AT and 3′AC ends (Kubota et al., 2011).
Recent high-resolution crystal and cryo-EM structures of yeast and human spliceosomes and their components are improving our understanding of the mechanism of 5′ss recognition (Kondo et al., 2015; Bao et al., 2017; Bertram et al., 2017; Wan et al., 2017). It was definitively shown that the recognition of an RNA oligonucleotide with an AAG/GUAAGU 5′ss sequence by human U1 snRNP involves direct base pairing with U1 snRNA and is stabilized by hydrogen bonds formed between U1-C polypeptide with the sugar-phosphate backbone of the pre-mRNA, i.e., without base-specific contacts (Kondo et al., 2015). This additional stabilization by U1-C may support non-canonical base pairing interactions (such as U-ψ) (Tan et al., 2016), which may be especially important in higher eukaryotes, due to the more degenerate nature of their 5′ss motif, compared to that of budding yeast.
Many of the point mutations that affect splicing disrupt 5′ss recognition by U1 snRNP, the first step in spliceosome assembly. The 5′ss sequence is highly degenerate, but at least 6 Watson-Crick or wobble base-pairs with U1 snRNA are thought to be necessary for splicing to occur (Zhuang and Weiner, 1986; Ketterling et al., 1999). This vague definition of what constitutes a functional 5′ss sequence reflects current knowledge of the 5′ss element; this knowledge derives on one hand from extensive functional and structural studies involving the consensus sequence or a small number of model substrates, and on the other hand from the alignment of 5′ss sequences from many natural introns. Aligning all the splice sites in this manner, however, overlooks contextual influences and rare splice-site sequences that may be biologically interesting.
In spite of the multiple base pairs formed with U1 snRNA, a single point mutation within the 5′ss can be sufficient to abolish the recognition of a 5′ss. Whereas mutations at the invariant +1G always cause aberrant splicing—due to its role in transesterification chemistry—the consequence of mutations at the other positions of the 5′ss are less predictable. Some mutations are causal for various human diseases, whereas others are neutral. Why certain 5′ss are more sensitive to mutations is mechanistically intriguing, and has broad implications. Yet, there are insufficient data available for most disease-related genes to establish rules to accurately predict which mutations are pathogenic. Of 15,786 single nucleotide polymorphisms (SNPs) identified at 5′ss, only 3.3% are classified as pathogenic or likely pathogenic, whereas the remaining 96.7% have unknown functional consequences (Landrum et al., 2015). Without laborious experimental examination of the effects of individual point mutations, it has not been possible to reliably predict their effects on splicing. This gap in knowledge, in turn, hinders the development of splicing-corrective therapies.
Recent advances in massively parallel assays allow simultaneous surveying of the influence of many different mutations on splicing; this approach has been applied, e.g., to examine the influence of hexamer sequence motifs on nearby alternative splice sites (Rosenberg et al., 2015) and the effects of systemic mutations within an exon (Singh, et al., 2004; Julien et al., 2016; Ke et al., 2018). So far, such studies have focused on regulatory elements spread throughout the sequence, and revealed the high content of cis-regulatory elements within exons and introns. Here, we pursued a complementary approach, using a focused massively parallel splicing assay (MPSA) to empirically examine the effects of all possible variants of a single discrete element, the 9-nucleotide 5′ss. We performed this assay in three different gene contexts: BRCA2 intron 17, SMN1 intron 7, and IKBKAP intron 20. We found that the 5′ss sequence alone is a major determinant of splice-site recognition. In the BRCA2 and SMN1 contexts, the 5′ss sequence accounts for 68–72% of the variation in splice-site usage. Surprisingly, 5′ss selection was unusually stringent in the IKBKAP context, which we demonstrate is attributable to its weak upstream 3′ss: strengthening this 3′ss was sufficient to improve the recognition of selected 5′ss sequences to similar levels as in the BRCA2 and SMN1 contexts. Based on our results, we can predict the negative impact on splicing of ~90% of disease-associated 5′ss mutations. Therefore, this study establishes a quantitative assessment of the usage of all possible 5′ss, and provides insights into how 5′ss mutations may alter splicing efficiency and cause disease. Knowing which mutations are pathogenic can help identify individuals at risk for various genetic diseases, and should facilitate early detection and intervention.
Results
5′ss usage and the effects of mutations are recapitulated in minigenes
To begin dissecting how a particular 5′ss sequence is recognized by U1 snRNP, we constructed a BRCA2 (breast cancer 2, a tumor suppressor gene) minigene spanning exons 16 to 18. We introduced several single point mutations within the 5′ss of exon 17 to determine if its recognition is affected. We inserted the minigenes into the pcDNA5/FRT vector and stably transfected them into a HeLa cell clone, which was selected for a single FRT site (introduced by the Flp-In system) to eliminate variability arising from random genomic integration.
The 5′ss of BRCA2 intron 17 is a non-canonical GC 5′ss with the sequence CAG/GCAAGTTT, which adheres closely to the human consensus 5′ss generated from 202,764 natural 5′ss (Figure 1A) (Sheth et al., 2006), despite having a cytosine at the +2 position and a thymidine at the +7 position. Intervening sequence (IVS) mutations 17-1G>C, IVS17-1G>A, and IVS17+5G>A were previously observed in breast-cancer samples (Hofmann et al., 2003; Landrum et al., 2015; Teng et al., 1996). In our minigene experiments, the G>A point mutation at the +5 position induced complete exon 17 skipping (Figure 1C, lane 3), suggesting that patients with these point mutations likely have splicing defects in BRCA2, and that the effects of such mutations can be accurately reproduced in our minigene assay. Strengthening the splice site by altering the GC to GT was sufficient to suppress the effect of the +5 mutation (lane 4).
Figure 1. 5′ss activity and the effects of mutations can be recapitulated in minigenes.
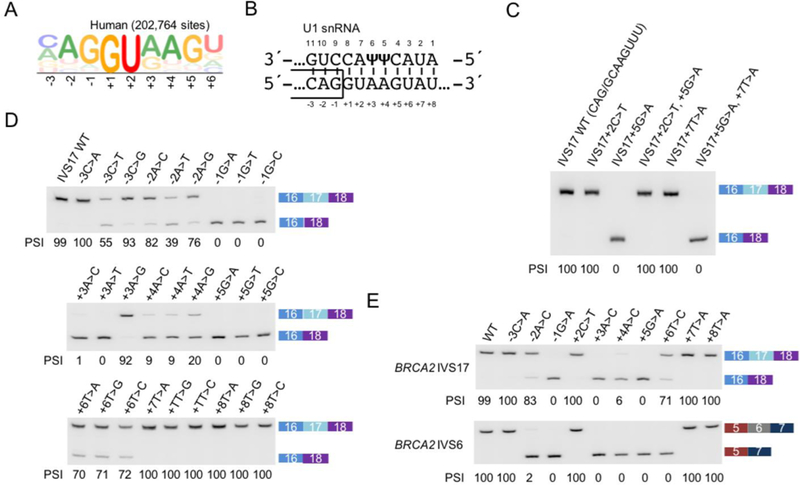
(A) Sequence logo generated from 202,764 5′ss sequences in the human transcriptome.
(B) Diagram showing the base-pairing between U1 snRNA and the consensus 5′ss sequence. ψ represents pseudouridine, an isomer of uridine found at conserved positions in U1 snRNA.
(C) Systematic mutation of the exon 17 5′ss of a BRCA2 minigene spanning exons 16–18. Gel image is representative of triplicates. Percent spliced in (PSI) is indicated below each lane.
(D) Different nucleotides at the same position induce exon skipping to similar extents, except for a few exceptions when the mutated nucleotide maintains complementarity by forming a G:ψ wobble base pair with U1 snRNA (e.g., +3A>G). Gel images are representative of triplicates.
(E) BRCA2 intron 17 5′ss wild-type (WT) and mutant sequences replacing the 5′ss of BRCA2 intron 6 in a BRCA2 exons 5–7 minigene (bottom) show similar splicing efficiencies compared to the intron 17 context (top). Gel images are representative of triplicates.
5′ss recognition can sometimes be influenced by the next two nucleotides in the intron (+7 and +8), which can extend the complementarity at the 5′ end of the U1 snRNA, even though the consensus motif has no nucleotide preference at these positions (Figure 1B) (Freund et al., 2005; Sheth et al., 2006; Hartmann et al., 2008). In this case, however, increasing the complementarity to U1 by changing +7T>A was insufficient to overcome the effect of the +5 mutation (lane 6). Mutations at almost every position (except for +7 and +8) also induced exon skipping, regardless of the actual nucleotide. A few exceptions arise when complementarity is maintained by forming a G:U (-2G:10U) or G:ψ (+3G:6ψ) wobble base pair with U1 snRNA (Figure 1D). Thus, we observed that many distinct single point mutations can strongly affect BRCA2 exon 17 5′ss recognition.
To further evaluate the role of the nucleotide sequence in 5′ss recognition, we used the same 5′ss sequences to replace the natural 5′ss of intron 6 of another BRCA2 minigene spanning exons 5 to 7 (Figure 1E). With two exceptions (-2C:10U and +6C:3A), the activities of these 5′ss in both BRCA2 minigenes closely resembled each other, indicating that a given 5′ss behaves similarly when placed in these two different minigene contexts. This result suggests that although other cis-acting elements may influence the recognition of a 5′ss, the sequence of the 5′ss is a major determinant of its usage.
High-throughput analysis of the activity of all 5′ss sequences
To more thoroughly assess the effect of 5′ss variation, we developed an MPSA to comprehensively assay all 32,768 possible 9-nucleotide GU and GC 5′ss sequences (Figure 2A, S1). For BRCA2, we first generated a partial minigene comprising exon 16, intron 16, and exon 17 with a randomized 9-nucleotide 5′ss sequence replacing the natural exon 17 5′ss, and a randomized 20-nucleotide barcode sequence at the 3′ end. We subjected this library to next-generation sequencing, thus producing a “key” that associates each 20-nt barcode with a corresponding 5′ss. We then inserted intron 17 and exon 18 into restriction sites located between the randomized 5′ss and the 20-nt barcode to complete the minigene library. We transiently transfected the resulting minigene library into HeLa cells to assess splicing by RT-PCR. We separately amplified and deep-sequenced the 20-nt barcodes of two samples: (i) the gel-purified exon-inclusion product and (ii) the total transfected library. With the previously sequenced “key”, we used the barcodes to identify the extent to which individual 5′ss sequences resulted in exon inclusion versus skipping. Using this strategy, we determined and calculated the relative usage of each 5′ss sequence by quantifying the ratio of the number of exon-inclusion barcode reads to the number of barcode reads from total RNA.
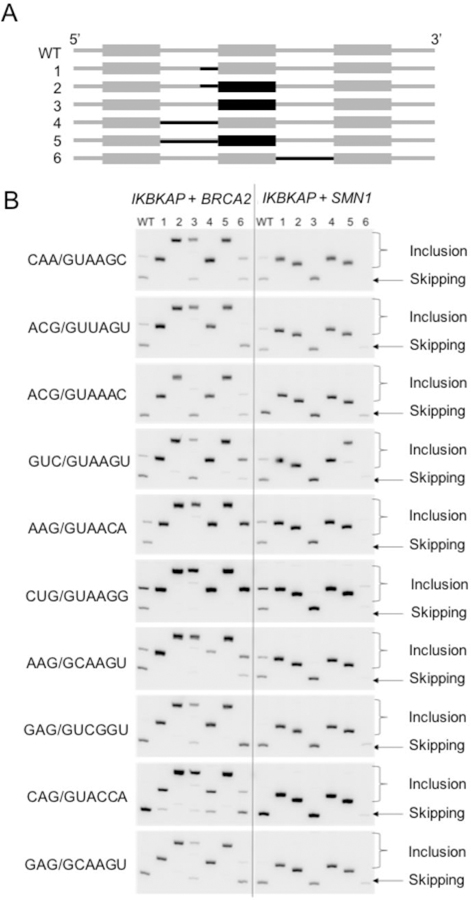
Figure 2. MPSA measurements for 5′ss sequences.
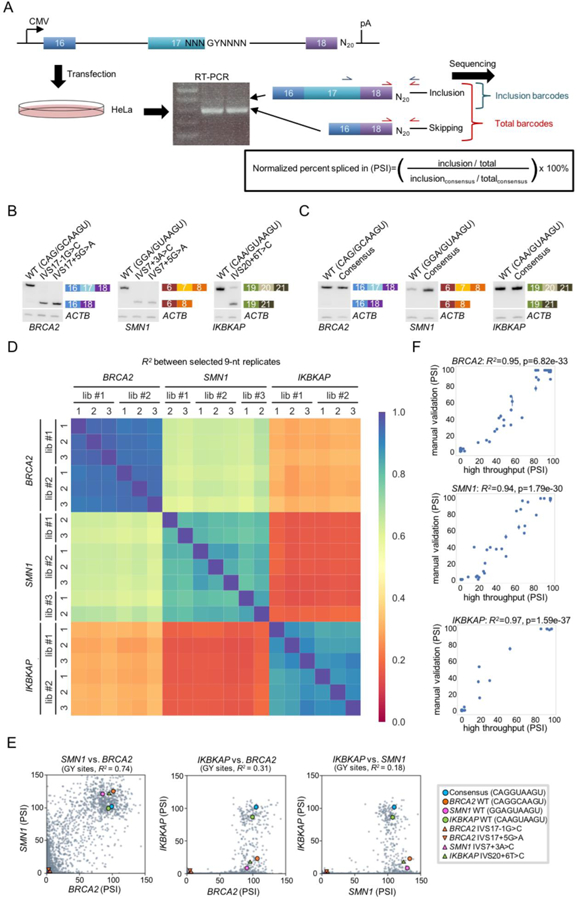
(A) Schematic of the MPSA used to assess all 5′ss sequences. Minigenes were inserted into the pcDNA5 expression vector, which has a cytomegalovirus (CMV) promoter and a bGH polyadenylation site (pA). See also Figure S1.
(B) Splicing of BRCA2, SMN1, and IKBKAP minigenes with wild-type (WT) and mutant 5′ss sequences. These measurements confirm that our minigene constructs can recapitulate the effects of known disease-associated mutations. ACTB was amplified in the same PCR reaction as a loading control. The gel image was divided for easier visualization. Gel images are representative of triplicates.
(C) Splicing of BRCA2, SMN1, and IKBKAP minigenes with WT and consensus (CAG/GUAAGU) 5′ss sequences. The consensus sequence gives 100 PSI in all three contexts, substantiating its use in normalizing PSI measurements. ACTB was amplified in the same PCR reaction as a loading control. The gel image was divided for easier visualization. Gel images are representative of triplicates.
(D) Heat map reporting the squared Pearson correlation (R2) of PSI values measured in 19 independent experiments. These correlations show that the replicate libraries within each context are more consistent with each other than with measurements made in heterologous contexts. Two low-quality datasets (SMN1 library 1, replicate 1 and SMN1 library 3, replicate 3) were not included in this and subsequent analyses (see Figure S2C, D).
(E) Scatter plots comparing PSI values for each pair of minigene contexts. The consensus and WT 5′ss sequences are marked by circles with the indicated colors, and the mutant sequences are marked by triangles.
(F) Comparison of high-throughput PSI measurements to manual measurements made in each context for the same 53 randomly selected 5′ss sequences for each context. Error bars indicate SD across triplicate transfections. Note that the high-throughput PSI measurements shown here are capped at 100. Figure S4 illustrates these measurements for each individual 5′ss assayed.
We generated 5′ss libraries for three different disease-relevant contexts, namely the middle exon of minigenes BRCA2 exons 16–18, SMN1 exons 6–8, and IKBKAP exons 19–21, using the same strategy described above, to determine the extent of context-specific effects. As mentioned above, the BRCA2 IVS17+5G>A pathogenic mutation resulted in defective splicing in our minigene (Figure 2B). SMN1 (survival of motor neuron 1) deletions or point mutations cause spinal muscular atrophy (Lefebvre et al., 1995). Besides a G>C mutation at the invariant +1 position, no other natural 5′ss mutations have been reported in SMN1 intron 7 (Singh et al., 2017). We introduced an additional mutation (IVS7+24G>C) in the SMN1 minigene to prevent the selection of a cryptic 5′ss (data not shown). Among several point mutations we introduced at this 5′ss of SMN1 exon 7, mutations at the +3 and +5 positions induced exon 7 skipping (Figure 2B). Our choice of IKBKAP (inhibitor of kappa light polypeptide enhancer in B cells, kinase associated-protein) was motivated by the fact that a homozygous 5′ss mutation, IVS20+6T>C, is responsible for familial dysautonomia or Riley-Day syndrome (Anderson et al., 2001; Slaugenhaupt et al., 2001). The effect of this mutation was also recapitulated in our minigene assay (Figure 2B).
To ensure the reproducibility of our results, we generated two or three independently derived libraries, each having different barcode to splice site associations. We then assayed each library in three separate replicate experiments. Deep-sequencing analysis showed that each library covered at least 90% of the 32,768 possible 5′ss sequences (Table, Figure S2A, B). Only 8 of the 32,768 sequences (all eight beginning with GCGG) were not represented in any of the libraries. We normalized the inclusion ratio of each 5′ss sequence to that measured for the consensus 5′ss sequence (CAG/GUAAGU), since the consensus 5′ss resulted in complete exon inclusion in all three contexts (Figure 2C, S2C). We equated this normalized ratio to the percent spliced in (PSI) value measured for each 5′ss.
Table. Summary of sequencing data.
Summary statistics for each independently-derived minigene library for the three gene contexts is shown with standard deviation when appropriate. BC stands for barcode and SS stands for splice site. Further information is provided in Figure S2.
| Number of reads |
Percent of splice sites barcoded |
Barcodes per splice site |
Reads per BC- SS association |
||
|---|---|---|---|---|---|
| BRCA2 | library 1 | 1.89 x 10⁷ | 100.0% | 28.84 ± 7.95 | 19.84 ±16.96 |
| library 2 | 1.82 x 10⁷ | 100.0% | 68.27 ± 14.99 | 8.10 ± 6.01 | |
| SMN1 | library 1 | 5.70 x 10⁶ | 91.4% | 10.83 ± 8.46 | 17.25 ± 21.01 |
| library 2 | 1.12 x 10⁷ | 94.5% | 18.52 ± 14.59 | 19.37 ± 17.68 | |
| library 3 | 1.13 x 10⁷ | 92.9% | 12.47 ± 9.62 | 29.64 ± 31.50 | |
| IKBKAP | library 1 | 1.04 x 10⁷ | 99.8% | 34.51 ± 21.86 | 9.02 ± 11.74 |
| library 2 | 8.5 x 10⁶ | 99.7% | 26.44 ± 16.97 | 9.70 ± 12.36 | |
Within each minigene context, we observed good consistency in 5′ss usage among the independently derived libraries and replicates of each minigene, as indicated by the high coefficient of determination (R2) between measured PSI values (Figure 2D, Figure S2D). In addition to validating that each minigene library yielded consistent and reproducible 5′ss usage quantitation, this analysis demonstrated that the 20-nucleotide randomized barcode sequence added to the 3′ end of each minigene generally did not detectably affect 5′ss selection (Figure S2E). The effects of the few outliers are negligible when averaging across the numerous barcodes associated with each 5′ss. By sequencing the exon-exon junction, we observed that GC 5′ss sequences with a GU dinucleotide at the -2 and -1 positions (NGU/GCNNNN) preferentially used the GU instead of the GC (Figure S3). To prevent our results from being skewed by these shifted junctions, we excluded these 1,024 5′ss sequences from this and subsequent analyses.
Measurements within each minigene context correlated substantially better with each other than between minigene contexts (Figure 2D). Averaging across replicates (Figure S2D), we find that PSI measurements for the two BRCA2 libraries correlate at R2 = 96%, measurements for the 3 SMN1 libraries exhibit R2 = 82-87%, and measurements for the two IKBKAP libraries exhibit R2 = 92%. There was a reduced correlation, R2 = 68-72%, between BRCA2 and SMN1 libraries. Finally, these BRCA2 and SMN1 measurements were far less well correlated with the IKBKAP measurements: R2 = 30-32% for BRCA2 vs. IKBKAP and R2 = 18–19% for SMN1 vs. IKBKAP. This result suggests a substantial difference in how 5′ss sequences are recognized by the spliceosome in the IKBKAP context relative to the BRCA2 and SMN1 contexts.
This context dependence is further illustrated in Figure 2E, where 5′ss selection in IKBKAP is seen to be more stringent than in BRCA2 and SMN1. A large population of 5′ss that were used efficiently for splicing in both BRCA2 and SMN1 varied greatly in splicing activity in IKBKAP. All wild-type 5′ss, along with the splicing-deficient mutant 5′ss sequences of each minigene, behaved as expected in their respective contexts. Whereas all three wild-type sequences were efficiently used in both BRCA2 and SMN1, IKBKAP could only tolerate its own natural 5′ss sequence. We manually validated 53 representative sequences in each context, to confirm the reliability of the next-generation-sequencing results (Figure 2F, S4). Altogether, we empirically determined the usage of virtually all possible 9-nucleotide 5′ss sequences in three different gene contexts.
5′ss usage follows general trends, modulated by context-dependent effects
The 5′ss sequences tended to be used in a bimodal manner, such that the majority were either recognized for splicing with high efficiency or not recognized at all (Figure 3A). These bimodal distributions, however, varied substantially between gene contexts. The SMN1 context had a large population of 5′ss sequences comprising both GU and GC splice sites that yielded moderate to low activity, but this was not the case in either the BRCA2 or IKBKAP contexts. Even though our libraries covered at least 90% of the 32,768 possible 5′ss sequences, including both GC and GU splice sites, GC splice sites were considerably weaker than GU splice sites in all three contexts. Paradoxically, though the natural BRCA2 intron 17 5′ss is a GC splice site that is efficiently used for splicing, other GC 5′ss sequences were not tolerated for splicing in this context. Whereas 1279 5′ss sequences had PSI ≥20 in BRCA2, 2892 5′ss had PSI ≥20 in SMN1. Although the overlap in the list of 5′ss with activity in both contexts is high (1117 5′ss with PSI ≥20 in both BRCA2 and SMN1), there is a subset of 5′ss with high activity in one context but little to no activity in the other (6 5′ss with PSI ≥80 in BRCA2 and PSI <20 in SMN1; 70 5′ss with PSI <20 in BRCA2 and PSI ≥80 in SMN1). In agreement with the stringent selection of 5′ss sequences in IKBKAP noted above, only 250 5′ss sequences had PSI ≥20 in IKBKAP. Collectively, our results show that context can have a considerable influence on 5′ss activity.
Figure 3. Further comparisons of MPSA measurements across three different contexts.
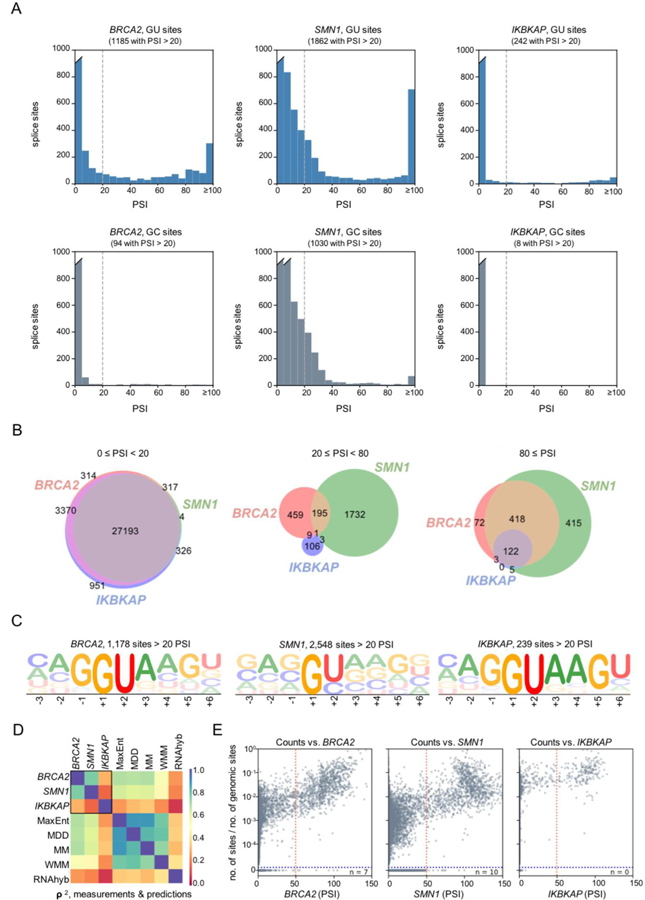
(A) Histograms showing the distribution of PSI measurements for all GU (top) and GC (bottom) 5′ss sequences in each of the three minigene contexts. The dashed line marks the 20% cutoff used to designate a 5′ss as active. The breaks in the left-most bars (indicated by a slant mark) indicate values exceeding the upper limit on the y-axis. PSI measurements above 100 were included in the right-most bar in each plot.
(B) Venn diagrams showing contextual overlap in the number of 5′ss with activities in the ranges 0–20, 20–80, or 80–100 PSI. A complete 9×9 table of such overlaps is provided in Figure S5A.
(C) Sequence logo generated from 5′ss sequences with PSI ≥20 in each context. Separate sequence logos for each independent-replicate library are shown in Figure S5B–D.
(D) Heat map showing squared Spearman rank correlation values (ρ2) between the PSI measurements in each minigene context, and the predictions of previously published models, including: a maximum entropy model (MaxEnt; Yeo et al., 2004), a maximum dependence decomposition model (MDD; Burge et al., 1998), a first-order Markov model (MM; Krogh et al., 1994), a weight matrix model (WMM), and RNAhybrid predictions (RNAhyb; Kruger et al., 2006). Scatter plots for MPSA/model comparisons are shown in Figure S6A.
(E) Scatter plots comparing the occurrence of each 5′ss in the human transcriptome, normalized to the occurrence of the respective 9-mer in the genome, to our measured PSI values. Here “n” indicates the number of 5′ss sequences with >50 PSI (left of the red dotted line) that do not occur in the human transcriptome (below the blue dotted line). A higher cutoff of PSI >50 (marked by the red dash line) was chosen to disregard the population of 5′ss with low activity seen only in the SMN1 context. See also Figure S6C.
When the 5′ss in the bimodal distribution were separated by activity level, only 122 (0.4%) had high inclusion ratios (PSI ≥80) in all three contexts (Figure 3B, S5A). The great majority of 5′ss sequences (27,193, or 83%) had PSI <20 in all three contexts. This large proportion of seemingly non-functional sequences is consistent with the fact that only 9,574 (58.4%) of the 16,384 possible permutations of GU 5′ss, and 92 (0.56%) out of 16,384 possible GC 5′ss have been annotated as bona fide splice sites that occur at least once in the human transcriptome (Sheth et al., 2006). Interestingly, the sequences in the moderate-efficiency population with 20–80 PSI hardly overlapped among the three minigene contexts.
To better understand context-dependent sequence requirements, we generated sequence logos specific to each context (Figure 3C). Whereas the logo for BRCA2 is very similar to the logo for all human 5′ss (Figure 1A), SMN1 has much greater flexibility, showing minimal preference at any of the variable positions of the 5′ss (Figure 3C, Figure S5). On the other hand, IKBKAP has a strong preference for the consensus sequence.
MPSA measurements predict 5′ss activity better than computational algorithms
Comparison between our empirically-derived 5′ss data and several computational scoring matrices that predict 5′ss strength shows modest improvement by our method in predicting 5′ss usage (Figure 3D, Figure S6). Using the measurements from the BRCA2 libraries, we can predict splice-site usage in the SMN1 context with ~70% accuracy (as quantified by the squared Spearman correlation, ρ2), and vice-versa. Whereas some popular prediction algorithms, such as the maximum entropy model (MaxENT; Yeo et al., 2004), the maximum dependence decomposition model (MDD; Burge et al., 1998), and the first-order Markov model (MM; Krogh et al., 1994) can also predict 5′ss usage in our libraries with slightly lower accuracy, the weight matrix model (WMM) and the free energy of 5′ss/U1 base pairing, as calculated by RNAhybrid (Kruger et al., 2006), were the least predictive of the models we examined (ρ2<0.50). However, none of the models, nor our BRCA2 and SMN1 data, could accurately predict 5′ss behavior in the IKBKAP context.
Natural selection for functional 5′ss sequences
Next, we asked whether there are functional 5′ss sequences that exhibit high PSI but do not occur naturally in the human transcriptome. By using a PSI ≥50 cutoff, we disregarded the population of sequences that yielded low splicing activity in the SMN1 context only (Figure 3E). We found only 7 sequences in the BRCA2 context and 10 sequences in the SMN1 context that had ≥50% activity and do not occur naturally (Table S1). However, many of these 5′ss have a secondary GU or GC embedded within the sequence (underlined in Table S1), possibly allowing for the use of an alternative 5′ss. Removal of those sequences left only 2 sequences in the BRCA2 context and 4 sequences in the SMN1 context. Remarkably, one of these sequences, ACG/GUAUCG is shared between the two contexts, which we confirmed by RT-PCR to have high activity in both BRCA2 and SMN1 contexts (Figure S6C). This 5′ss can only base-pair at five positions with the U1 snRNA. Considering the nucleotides flanking the 5′ss, it is unlikely that a shifted or bulged register to the U1 snRNA is used in either context (Roca and Krainer, 2009; Roca et al., 2012). Besides this rare exception, it would appear that natural selection of 5′ss sequences in the human transcriptome has already explored virtually the entire set of functional 9-nt 5′ss sequences.
In addition to base-pairing to the canonical 5′ss motif, we determined the number of 5′ss sequences in our libraries that can be recognized by a shifted register, in which 5′ss base-pairing with U1 snRNA is shifted by one position, so that +1G base-pairs to U1 C9 instead of C8 (Roca et al, 2009; Figure 1B). We restricted this analysis to GU 5′ss only. Taking into account the fixed flanking sequences in each context, we analyzed 480 shifted-register 5′ss in BRCA2, 32 in SMN1, and 32 in IKBKAP. Only 5/480 (1.0%) of the shifted-register 5′ss in BRCA2 gave PSI ≥20. One of the productive shifted-register 5′ss was ACA/GUUAAG, previously validated as an atypical 5′ss sequence recognized by a shifted register (Roca et al., 2009). None of the 32 shifted-register 5′ss in SMN1 and IKBKAP were productively recognized for splicing. This analysis indicates that 5′ss are typically recognized via the normal register, although a shifted-register is possible in rare cases.
We next asked whether 5′ss that occur more frequently in the human transcriptome tend to be stronger in our libraries. It was previously reported that accounting for the occurrence frequency of a 5′ss sequence can improve prediction accuracy (Sahashi et al., 2007). The IKBKAP context had the most stringent requirement for 5′ss selection, with only 250 5′ss having PSI ≥20. Almost all of these 250 5′ss had PSI ≥80 in both BRCA2 and SMN1, suggesting that these are strong 5′ss sequences. However, we did not observe a strong correlation between the number of natural occurrences of these 250 5′ss sequences in the human transcriptome (ranging from 1 to 2261 occurrences, with a median value of 280) and their inherent strengths.
Pairwise nucleotide association influences 5′ss strength
Pairwise nucleotide-position dependencies within the 5′ss were previously observed by comparative genomics (Burge and Karlin, 1997; Carmel et al., 2004; Roca et al., 2008). Identifying such interactions could potentially help predict the impact of 5′ss mutations on splicing.
To investigate the presence of such interactions in our MPSA data, we compared the explanatory power of two different models for PSI, as a function of 5′ss sequence: a “matrix model” and a “matrix+pairwise model.” The matrix model assumes that each base at each position has an independent and additive effect on PSI (Equation 1, STAR Methods). By contrast, the matrix+pairwise model includes contributions to PSI from all pairs of nucleotide positions within the 5’ss (Equation 2, STAR methods). (See STAR Methods for details on how these models were fit to the data.)
The matrix model was fit by regressing sequences against PSI measurements. The results of this model fitting largely recapitulated the motifs that we found by aligning active 5′ss. Only 35% and 48% of the variance in 5′ss PSI measurements in BRCA2 and SMN1, respectively, can be attributed to the independent nucleotide contributions in the matrix model (Figure 4A, B, Figure S7). The pairwise component of the matrix+pariwise model was then fit to the residuals of this matrix model. Adding pairwise interactions increased R2 to 69% and 63% in BRCA2 and SMN1, respectively. The pairwise interactions in BRCA2 were prominent. In particular we identified a distinct and preferential association between -1G and +5G (Figure 4A). Remarkably, all three of the characterized disease-associated mutations in BRCA2 intron 17 (-1G>C, -1G>A, and +5G>A) alter this -1G +5G interaction. The pairwise interactions in SMN1 were subtler, with preferences at several pairs of positions and nucleotides (Figure 4B). Due to the limited productive 5′ss usage in IKBKAP (only 250 5′ss with PSI ≥20), significant pairwise interactions could not be determined for this context. GC 5′ss were also excluded from this analysis for the same reason.
Figure 4. Epistatic interactions in 5′ss activity.
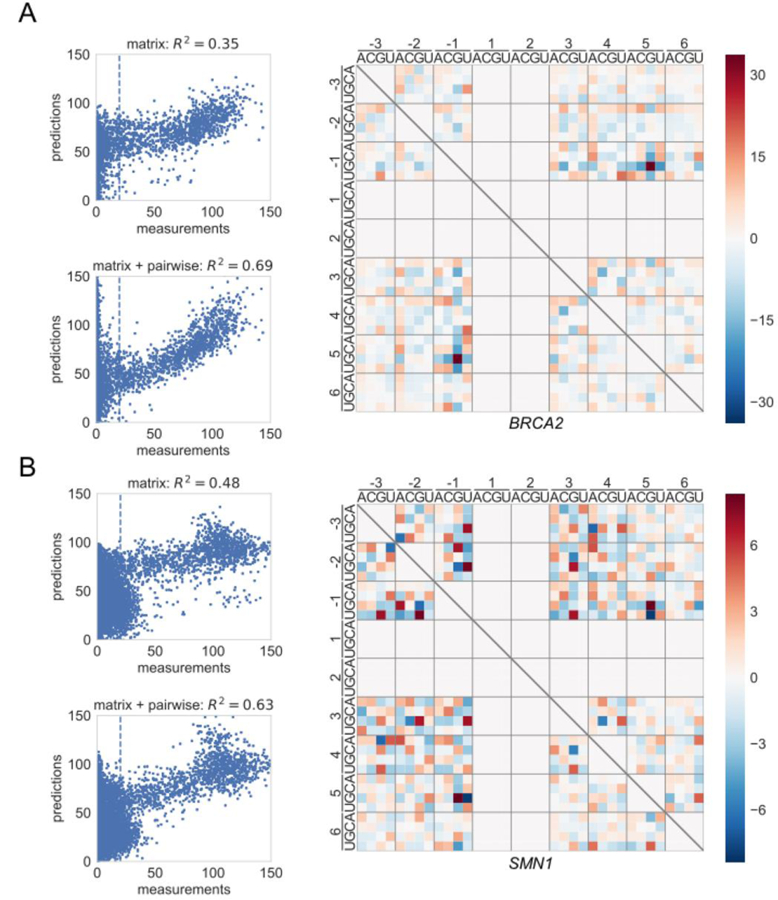
(A) Scatter plots showing measured PSI values vs. PSI values predicted by either the matrix model (top) or the matrix + pairwise model (bottom) for BRCA2. The heat map shows the specific interactions present in the pairwise model. Red indicates a positive interaction; blue indicates a negative interaction. Note that pairwise models were inferred only for GU splice sites. Analyses for each separate library are shown in Figure S7C.
(B) Same as A, but for SMN1. See also Figure S7D.
Notably, the strong positive association between -1G and +5G in BRCA2 is also evident in the SMN1 and IKBKAP contexts. We compared the usage of 5′ss with either a fixed -1G paired with +5U/C/A or a fixed +5G paired with -1U/C/A to their counterparts with -1G +5G. For this analysis, we only considered 5′ss that gave PSI ≥20 with -1G +5G, which resulted in 1,647 BRCA2, 1,818 SMN1, and 531 IKBKAP 5′ss sequences. When G was fixed at the -1 position, 87.1% of BRCA2, 85.8% of SMN1, and 97.6% of IKBKAP 5′ss sequences with +5U/C/A had a ≥20% reduction in PSI, compared to +5G; when G was fixed at the +5 position, 94.7% of BRCA2, 86.5% of SMN1, and 94.9% of IKBKAP 5′ss sequences with -1U/C/A had a ≥20% reduction in PSI, compared to -1G.
Indeed, the absence of a G at -1 and +5 positions is highly unfavorable (only 0.5% of NNH/GYNNHN 5′ss sequences in BRCA2, 5.7% in SMN1, and 0.03% in IKBKAP have PSI >20). Among the 5′ss sequences with either -1G or +5G (NNG/GYNNHN and NNH/GYNNGN), 5.6% in BRCA2, 10.6% in SMN1, and 0.7% in IKBKAP have PSI >20. 5′ss sequences with both -1G and +5G (NNG/GYNNGN) are the most favorable (24.6% in BRCA2, 25.8% in SMN1, 7.7% in IKBKAP have PSI >20). It thus appears that a -1G +5G pairing is generally preferred and reflects a fundamental aspect of 5′ss recognition.
Other epistatic interactions were evident in both the BRCA2 and SMN1 contexts, including strong positive interactions between -3G -1U, -3G +4U, -1U +4U, -1G +5G, and +5G +6U, as well as strong negative interactions between -2G -1G, -2A +5G, and -1G +3C. We also observed context-dependent epistatic interactions exclusively in the BRCA2 or SMN1 context. For example, -2A in BRCA2 prefers +4C, but negatively interacts with +4A; in contrast, -2A in SMN1 prefers +4A, but negatively interacts with the other 3 nucleotides. Similarly, +4U in BRCA2 prefers +3U, but +4U in SMN1 prefers +3G. The mechanisms underlying these general or context-dependent pairwise interactions are presently unknown.
There are multiple potential explanations for these observed epistatic interactions. They might result from mechanistic coupling between nucleotide pairs. Alternatively, they could result from nonlinearities in the relationship between PSI and some intermediate non-epistatic phenotype (e.g., U1 snRNP-5’ss binding energy), a phenomenon known as “global epistasis.” More sophisticated quantitative modeling (e.g., along the lines of Otwinowski et al. 2018) might help distinguish between these possibilities in the future.
A weak upstream 3′ss drives the context-dependency of 5′ss sequence usage in IKBKAP
Recognition of the 5′ss in the IKBKAP context strikingly differs from that in the BRCA2 and SMN1 contexts. Many features can contribute to the overall context and influence the recognition of a 5′ss, such as 3′ss strength (Will et al., 2011), the presence of various exonic and intronic enhancers and/or silencers (Hastings et al., 2001), and RNA secondary structure (Buratti and Baralle, 2004).
In the case of IKBKAP exon 20, the upstream 3′ss is predicted to be weaker than that of BRCA2 or SMN1 (Table S2), whereas the downstream 3′ss sequences are expected to have similar strengths in all three contexts as judged by the MaxEnt algorithm (Yeo et al., 2004). To examine the contribution of these 3′ss and other sequence elements to 5′ss selection, we selected 10 5′ss sequences from the 53 manually validated 5′ss (Fig 2F) that had PSI >80 in both BRCA2 and SMN1 but had PSI <50 in IKBKAP, presuming that the low efficiency of these 5′ss is due to the IKBKAP context. We then introduced various portions of BRCA2 or SMN1 into the IKBKAP minigene, in place of the corresponding IKBKAP sequences (Figure 5A). To ensure that the expected splice junctions were used in the hybrid minigenes, we gel-purified and analyzed the splice products by Sanger sequencing. This analysis confirmed that only the expected splice junctions were used, and no usage of cryptic splice sites was observed. Notably, we found that replacing a 20-nucleotide IKBKAP sequence comprising the upstream 3′ss, with either BRCA2 or SMN1 sequences strongly promoted exon inclusion with all 10 5′ss sequences examined (Figure 5B, construct 1). Whereas the BRCA2 exonic sequence alone modestly increased exon inclusion with most of the tested 5′ss, SMN1 exonic sequence resulted in further inhibition of exon inclusion (Figure 5B, construct 3). Using antisense oligonucleotides, it was previously determined that two silencer elements are present within SMN1/2 exon 7, flanking an exonic splicing enhancer (Hua et al., 2007). The net effect of these opposing elements appears to be repressive in the context of the hybrid minigenes, promoting exon skipping.
Figure 5. A weak upstream 3′ss drives the context-dependence of 5′ss activity in IKBKAP.
(A) Diagram of hybrid minigene constructs. IKBKAP minigene sequences are illustrated in gray. Black indicates either BRCA2 or SMN1 minigene sequences replacing the corresponding IKBKAP features.
(B) Splicing of the hybrid constructs is shown in the RT-PCR gels. Due to the size differences of the middle exon between constructs, the size of the inclusion band varies. Gel images are representative of triplicates.
Replacement of the downstream IKBKAP intron (intron 20) with the corresponding intron from BRCA2 (intron 17) resulted in variable extents of exon 20 inclusion with a subset of the 5′ss, whereas replacement with the SMN1 downstream intron (intron 7) resulted in predominantly unspliced products (not shown) (Figure 5B, construct 6). We conclude that context plays a considerable role in 5´ss recognition in IKBKAP, and strengthening the upstream 3′ss of the IKBKAP minigene was sufficient to increase 5′ss activity to similar levels as in BRCA2 and SMN1. Taken together, our results suggest that 5′ss selection is relatively predictable, in the absence of strong contextual influences.
Library results help to predict pathogenic mutations
To assess the effectiveness of our MPSA measurements in predicting the consequences of 5′ss mutations, we compiled a list of 122 pathogenic 5′ss mutations (excluding +1 mutations, as well as +2U>A, +2U>G, +2C>A, and +2C>G mutations, which are known to abolish splicing) and 103 5′ss mutations with unclassified or unknown consequences identified throughout the BRCA1 and BRCA2 transcripts (Landrum et al., 2015). We then compared the PSI values we measured for these 5′ss sequences in our libraries to the PSI values of their wild-type counterparts, in each of the three minigene contexts (Figure 6A,B). We only analyzed the 5′ss mutations for which the corresponding wild-type 5′ss sequences had ≥20 measured PSI values (excluded data points are in the gray-shaded area). We thus examined 122 BRCA1 or BRCA2 pathogenic 5′ss mutations in BRCA2, 109 in SMN1, and 76 in IKBKAP, along with 103 5′ss mutations with unknown consequences in BRCA2, 101 in SMN1, and 62 in IKBKAP. Among these, 86% of the pathogenic mutations in the BRCA2, 73% in the SMN1, and 93% in the IKBKAP context caused a ≥20% reduction in PSI, compared to the respective wild-type 5′ss sequences (Figure 6A). This is significantly different from the 40% of mutations with unknown consequences in the BRCA2 (p=2.54 × 10⁻¹³, Fisher’s exact test), 38% in the SMN1 (p=2.06 × 10⁻⁷), and 57% in the IKBKAP context (p=2.87 × 10⁻⁷) that caused a ≥20% reduction in PSI, compared to the respective wild-type 5′ss sequences (Figure 6B). This analysis shows that we can use our library data to clearly distinguish known disease-associated mutations from unannotated mutations.
Figure 6. MPSA measurements help to predict pathogenic mutations.
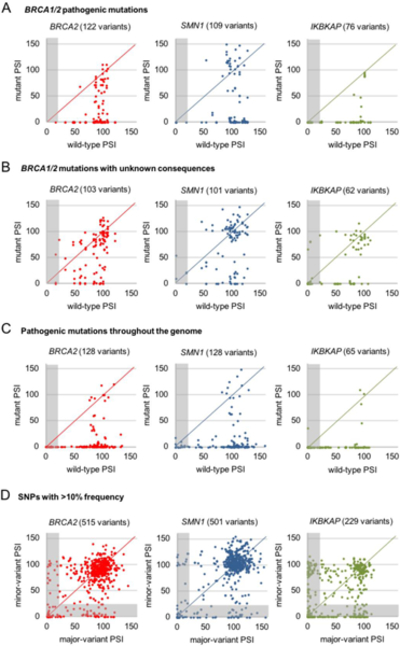
(A) Scatter plots, corresponding to the three minigene contexts, comparing MPSA- measured PSI for multiple WT 5′ss sequences to mutant in BRCA1 and BRCA2 to mutant 5′ss variants thereof that are known to be pathogenic. Gray-shaded area indicates data points with WT PSI <20, which were excluded from the subsequent analysis. See also Figure S6B.
(B) Same as above, but for mutant BRCA1 and BRCA2 5′ss sequences with unclassified or uncertain clinical significance. Gray-shaded area indicates data points with WT PSI <20, which were excluded from the analysis. See also Figure S6B.
(C) Same as above, but for known disease-causing mutations across a broad range of genes and diseases, available from DBASS5 online resource (Buratti et al., 2007). Gray-shaded area indicates data points with WT PSI <20, which were excluded from the analysis. See also Figure S6B.
(D) Same as above, but for 5′ss SNPs with >10% frequency found in the human population, compiled from the ExAC database (Lek et al., 1016). Gray-shaded area indicates data points for which either the major or minor variants had PSI <20, which were excluded from the analysis. See also Figure S6B.
We further examined a selected set of 147 known disease-causing mutations across a broad range of genes and diseases, available at the DBASS5 online resource (Figure 6C) (Buratti et al., 2007). In addition to the same exclusions as the previous analysis, we also excluded BRCA1/2 mutations to avoid redundancy, and mutations that generated a de novo 5′ss. Among these 147 mutations, 128 in BRCA2, 128 in SMN1, and 65 in IKBKAP had corresponding wild-type 5′ss sequences with PSI ≥20. Consistently, our data show a ≥20% reduction in PSI in 93% of the mutations in the BRCA2, 91% in the SMN1, and 95% in the IKBKAP context. Finally, we compared the measured PSI value for major and minor variants of 625 common SNPs with a minor-allele frequency in the human population >10%, obtained from the ExAC database (Lek et al., 2016) (Figure 6D). We only analyzed the 5′ss in which both the major and minor variants yielded ≥20 measured PSI values, which resulted in 515 in the BRCA2, 501 in the SMN1, and 229 in the IKBKAP context. Only 30% of the minor variants in the BRCA2, 29% in the SMN1, and 38% in the IKBKAP context deviated more than 20% in PSI from the respective major variants. Thus, our library data can be used to accurately predict the likely functional consequences of 5′ss mutations across different introns and genes.
Discussion
To elucidate the mechanism of 5′ss recognition and determine the characteristics of 5′ss sequences that are prone to perturbation by point mutations, we measured the 5′ss recognition profile of nearly all 32,768 unique 9-nucleotide GU or GC 5′ss sequences in three heterologous gene contexts (BRCA2, SMN1, and IKBKAP). Although high-throughput mutation studies have become increasingly common, reflecting advances in sequencing technology, the complexity of splicing regulation can confound the interpretation of such massive datasets. In particular, such data are frequently used for holistic modeling that integrates effects across multiple element features, making it difficult to attribute an observed effect to a specific element. Due to the binding of splicing regulators to degenerate sequence motifs throughout the pre-mRNA, a mutation designed to abolish a regulator binding site may unintentionally create another. In addition, the presence of a binding motif is not necessarily indicative of productive binding by the cognate factor. For these and other reasons, it is difficult to accurately predict the effect of specific mutations when multiple random mutations are introduced sparsely throughout the pre-mRNA. These limitations motivated us to adopt a focused approach and directly measure the effects of all possible variations of one element, the 5′ss, which has a well-defined location and length. Our method allows for a transparent assessment of how individual 5′ss sequences affect splicing, and how gene context can alter these effects.
Our study confirmed that the major determinant of 5′ss activity is largely inherent to its nucleotide sequence—as suggested by the high similarity in 5′ss strength between BRCA2 and SMN1—but also revealed substantial context-dependent differences in 5′ss activity. Much of this context-dependent variation is likely contributed by 3′ss strength and the presence of various exonic and intronic enhancers and/or silencers. In particular, we determined that a weak upstream 3′ss in IKBKAP muddled exon definition and prevented the usage of the majority of 5′ss sequences. Strengthening the IKBKAP upstream 3′ss recovered 5′ss recognition to a similar extent as in BRCA2 and SMN1. The inherent nature of 5′ss sequences was also evident in our finding that there were virtually no functional sequences used in our libraries that do not occur naturally as bona fide splice sites in the human transcriptome. In a dataset of 202,764 human authentic 5′ss sequences (Roca et al., 2012), there are 4,141 naturally occurring 9-nucleotide human GU (25.3%) and 49 GC (0.3%) 5′ss sequences that are used at least three times in the human transcriptome, out of all possible unique GU or GC 5′ss sequences (16,384 each). In our BRCA2 experiments, we identified 9.97% (1,634/16,384) of GU and 1.1% (177/16,384) of GC 5′ss sequences with at least 5% splicing activity. With just one exception, all of the active 5′ss sequences in our BRCA2 context also occur naturally. This observation suggests that our results can closely simulate the usage of naturally occurring splice sites.
Intriguingly, however, many natural 5’ss sequences were not active in our experiments. Out of 4,141 authentic 5′ss sequences in the human transcriptome, 2,181 (53.7%) had measured PSI values lower than 5% in all three contexts we examined. The efficient use of these 5′ss sequences in their natural contexts may require features associated, e.g., with specific cell types, physiological conditions, cell-cycle status, or differentiation state. Splicing regulation in general relies on combinatorial interactions involving multiple trans-acting splicing activators and repressors that bind to their corresponding cis-acting enhancer and silencer elements, respectively. Each of the above conditions could result in altered expression or activity of various splicing regulators, the net effect of which would lead to efficient use of 5′ss sequences that showed little to no activity in HeLa cells. The precise requirements for efficient use of these 5′ss sequences warrants further investigation, e.g., by comparing their activities in additional gene contexts, different cell-types, and physiological conditions.
In addition to the inherent contribution of the 5′ss nucleotide sequence, gene context can play a considerable role in determining 5′ss activity. Although 5′ss activity was similar between the BRCA2 and SMN1 contexts, key contextual differences were evident in the large fraction of GC 5′ss with low to moderate activity in SMN1 that were not active in BRCA2. The evidently permissive nature of SMN1 to a broad spectrum of 5′ss sequences, especially GC 5′ss, warrants further investigation. The usage of 5′ss sequences in IKBKAP further demonstrated substantial context-dependency. Notably, the three contexts we examined are constitutive exons in their natural pre-mRNAs. It was previously determined that the 5′ss strengths of alternative exons are only marginally weaker than those of constitutive exons (Wang et al., 2005; Roca et al., 2012). Rather, context may play a more crucial role in the strength of a given 5′ss sequence in alternative exons. In this study, we observed that the rank order of the strength of a 5′ss is largely intrinsic to its sequence, whereas the particular context imposes an activity threshold. It will be of interest in future studies to generalize whether 5′ss recognition relies more on the nucleotide sequence and is fine-tuned by context (as in BRCA2 and SMN1) or whether 5′ss usage that is strongly driven by context (as in IKBKAP) is the more prevalent situation in the human transcriptome.
Even though our MPSA experiments comprehensively characterized both GU and GC splice sites, only a minor subset of possible 9-nt GC 5′ss sequences were recognized as functional 5′ss. After U1 snRNP is displaced from the 5′ss by Prp28 (Staley et al., 1999), +2U of the 5′ss base-pairs with A51 of U6 snRNA in the spliceosomal C* complex (Fica and Nagai, 2017; Sontheimer et al., 1993). Mutations at both +2U of the 5′ss and A51 of U6 snRNA prevent exon ligation in yeast (Collins et al., 2001; Siatecka et al., 1999). In addition to base-pairing to U1 snRNA, this role of +2U in U6 binding, though not strictly required, may explain why GC 5′ss are suboptimal.
Based on the epistasis analysis we performed using our BRCA2 and SMN1 measurements, we expect that mutations that disrupt positive pairwise interactions (such as the strong -1G+5G interaction) may have a negative effect on splicing efficiency. The interaction between positions -1 and +5 was previously described on the basis of comparative genomics between human and mouse (Burge and Karlin, 1997; Carmel et al., 2004; Roca et al., 2008). Previously, a “seesaw linkage” pattern was observed, whereby -1G permits any nucleotide at position +5, and conversely, +5G permits any nucleotide at -1; in our study, we observed a strong positive interaction between -1G and +5G, such that a nucleotide change at either position results in a ≥20% reduction in PSI, compared to the respective -1G and +5G counterpart. Whereas previous reports of such pairwise interactions were based on the statistics of aligned 5′ss sequences from across the genome, we defined couplings on the basis of direct functional measurements of PSI. Our comprehensive approach allowed us to refine this relationship between -1 and +5 positions, in which having Gs at both -1 and +5 positions is highly preferential, having a G at either position results in a reduction in PSI, and having a G at neither position is highly unfavorable. The mechanistic reason for the almost exclusive positive interaction between -1G and +5G is yet to be determined. We speculate that the disruption of the more stable G-C base pairing at the -1 and +5 positions may contribute to the strong dependency observed. Additionally, this interaction may reflect structural constraints that could be revealed by ongoing structural studies of the spliceosome (Fica and Nagai, 2017). Though some additional interactions were context-dependent, we observed other shared pairwise interaction patterns between BRCA2 and SMN1. The precise interactions that may apply to a wide variety of splice sites will need to be elucidated in future work, with larger datasets. Finally, we observed that 5′ss efficiency largely follows a bimodal distribution, such that the majority of 5′ss were used with either high activity or little to no activity. This finding helps to explain why splicing mutations can have such detrimental effects, and underscores the need to characterize SNPs that may strongly alter splicing and thus cause or contribute to disease development.
Besides improving our understanding of the mechanism of 5′ss recognition and splicing, the present findings also have translational relevance. As genetic screening and whole-genome sequencing emerge as common practice, there is a great need to determine which SNPs contribute to disease development. One of the prime examples is the genetic screening for mutations in the tumor-suppressor genes BRCA1 and BRCA2, which allows preventive action based on the inherited risk of developing breast or ovarian cancer. Yet, even for these heavily studied genes, many of the 1,277 and 1,331 point mutations, respectively, that have been identified to date, remain as “unclassified variants of unknown significance” (http://arup.utah.edu/database/BRCA/). For most disease-related genes, the currently available data are insufficient to assess the significance of SNPs discovered by genetic screening. Using the data we collected for BRCA2, we can predict that 86.1% of 122 5′ss mutations annotated as pathogenic throughout the BRCA1 and BRCA2 transcripts, and 93% of 147 known disease-causing mutations across a broad range of genes and diseases do indeed result in a reduction of PSI, compared to the respective wild-type sequence. In addition, we can clearly segregate another 103 SNPs at 5′ss with unclassified or unknown consequences, into likely-benign and likely-pathogenic mutations. By contrast, we observed little to no deviation in the measured PSI value in the majority of major and minor variants of 515 common 5′ss SNPs present at >10% in the human population. This analysis suggests that despite observing context-dependent effects on 5′ss recognition, our data can nonetheless help to predict the likely functional consequences of 5′ss mutations throughout the human transcriptome.
Our measurements of 5′ss activity slightly outperformed various computational scoring matrices in predicting 5′ss usage. Although some of these computational methods can similarly segregate pathogenic from likely-nonpathogenic mutations (Figure S6B), one key distinctive feature of our method is the direct quantification of PSI. Indeed, our data often revealed orders of magnitude of change in PSI, which are not reflected in the scores assigned by existing computational methods. Notwithstanding the limited contexts examined, our quantitative measurements of 5′ss activity will likely have clinical applications.
Promising therapeutic approaches for reversing certain splicing defects are being pursued. Small-molecule enhancers of splicing stabilize the binding of U1 snRNP to SMN2 pre-mRNA, increasing full-length SMN mRNA and protein (Palacino et al., 2015; Sivaramakrishnan et al., 2017). Nusinersen (Spinraza) is an antisense oligonucleotide that increases splicing of full-length SMN2 mRNA in patients lacking functional SMN1 and is the first and so far only FDA/EMA-approved treatment for spinal muscular atrophy (Finkel et al., 2017; Hua et al., 2008). Our comprehensive analysis of 5′ss improves our ability to predict which mutations are likely to affect splicing and are therefore potentially amenable to similar splicing-corrective therapies. To carry forward the momentum of developing successful therapies, it is essential to precisely and efficiently identify disease-associated mutations and SNPs on which to focus therapeutic efforts. Therefore, it will be of interest to expand the systematic method we have established in this study to other splicing regulatory elements, such as the 3′ss. The cumulative data on the usage of every possible 5′ss is an important step towards elucidating the “splicing code” (Wang and Burge, 2008), and will facilitate predictions of the outcome of splice-site mutations and SNPs for risk assessment and development of targeted therapeutics.
STAR methods
Contact for reagent and resource sharing
Further information and requests for resources and reagents should be directed to and will be fulfilled by Adrian Krainer (krainer@cshl.edu).
Experimental model and subject details
HeLa cervical carcinoma cells were cultured at 37 °C in 5% CO2 in Dulbecco’s Modification of Eagle’s Medium (DMEM, Corning, Manassas, VA), containing 10% fetal bovine serum (Seradigm, Radnor, PA).
Method details
Construction and transfection of minigene plasmids
A HeLa FRT clone selected for a single FRT integration site was a generous gift from Dr. Woodring Wright and Dr. Jerry Shay (UT Southwestern Medical Center at Dallas, TX). Human sequences were inserted into the pcDNA5/FRT expression vector (Invitrogen) using a variety of restriction sites. The sequences of the minigenes are available at https://github.com/jbkinney/15_splicing. For stable integration, 0.4 μg of minigene plasmid DNA and 3.6 μg of pOG44 (Invitrogen) were co-transfected into 106 HeLa FRT cells using Lipofectamine 2000 (Life Technologies). After 48 hours, transfected cells were selected with 200 μg/ml hygromycin B (Invitrogen). For transient transfection, 1 μg of minigene plasmid was transfected into HeLa cells. Cells were collected after 48 hours and RNA analyzed by radioactive RT-PCR.
RT-PCR and splicing analysis
RNA was isolated from minigene-expressing HeLa cells using Trizol (Life Technologies). cDNA was made using Improm-II Reverse Transcription System (Promega), following the manufacturer’s instructions. For splicing analysis, a minigene-specific forward primer (FRT F) was used in conjunction with the appropriate reverse primer (BRCA2 18R; BCA2 7R; SMN1 R; IKBKAP R) in the presence of [32P]-dCTP to amplify the splicing isoforms using Phusion High-Fidelity DNA Polymerase (New England Biolabs), following the manufacturer’s instructions. The reaction was initially denatured at 98 °C for 2 min, then denatured at 98 °C for 15 sec, annealed at 58 °C for 30 sec, and extended at 72 °C for 1 min for 26 cycles, with a final extension at 72 °C for 10 min. The PCR products were resolved on a 5.5% non-denaturing polyacrylamide gel and were detected with a Typhoon FLA7000 phosphorimager. Quantification of the isoforms was done using ImageJ (NIH).
Construction and sequencing of libraries
A single-stranded DNA fragment containing a randomized 9-nt 5′ss sequence at the end of the middle exon (BRCA2 Bsu36I ss top; SMN1 BseRI ss top; IKBKAP BseRI ss top) and a separate fragment containing a randomized 20-nt barcode sequence at the end of the last exon (BRCA2 NotI bc bot; SMN1 Not bc bot; IKBKAP XhoI bc bot) were synthesized. Equal molar ratios of the two strands were annealed at the 20-nt complementary region using 1x annealing buffer (10 mM Tris pH 8.0, 50 mM NaCl, 1 mM EDTA) with Phusion High-Fidelity DNA Polymerase (New England Biolabs), heated to 95 °C for 5 min, and extended at 72 °C for 30 min to generate the splice site-barcode double-stranded fragment. Using the respective restriction enzymes, the splice site-barcode fragment was ligated to the pcDNA5 vector comprising the first two exons. The ligated DNA was purified by drop dialysis using a 0.025 µm membrane filter (Millipore) for at least 2 hours, and electroporated into MegaX DH10B T1 Electrocomp Cells (ThermoFisher) using a 0.1-cm cuvette at 2.0 kV, 200 Ω, 25 µF in a BioRad Gene Pulser. The same restriction sites were used to extract the splice site-barcode fragment for Illumina sequencing, after ligating the fragment to Illumina-compatible ends generated by annealing PE1 top with PE1 bot, and PE2 top with PE2 bot, respectively (by heating to 95 °C for 5 min and then gradually cooling to room temperature over the course of 1 hour). The ligation product was separated on a 2% agarose gel and purified using the QIAquick Gel Extraction Kit (Qiagen). The N10 tract within the primer sequences represents a 7–10 nucleotide library identifier sequence. This library was sequenced using an Illumina HiSeq 2500 PE100, and acted as the “key” to determine the identities of the 5′ss associated with the barcodes.
The remaining intronic and exonic sequences were amplified by the respective insert F and insert R primers, and inserted seamlessly into the library using aaRI, a type IIS restriction endonuclease. The library (6 µg) was then transfected into 5×10⁶ HeLa cells using Lipofectamine 2000. Transfected cells were collected after 48 hours. RNA was isolated using Trizol, and analyzed by RT-PCR using Improm-II Reverse Transcription System and Phusion High-Fidelity DNA Polymerase. The exon inclusion product was amplified by PCR, first using a forward primer in the middle exon (BRCA2 17F; SMN17F; IKBKAP 20F) and a minigene-specific reverse primer immediately after the barcode sequence (BC R). Then, the barcode was isolated using the respective forward primer just before the barcode sequence (BRCA2 18F; SMN1 8F; IKBKAP 21F) and the same reverse primer (BC R). The same pair of primers was used to amplify the total barcode sequences from the transfected library. The barcodes in the exon inclusion product and the total barcodes were amplified first with the respective BC-LID F and BC-LID R to add a library-specific identifier represented by the N10 within the primer sequences. A second round of amplification using PE1_v4 and PE2_v4 added Illumina-compatible ends for sequencing. Using the previously sequenced “key”, the barcode was used to identify the splice-site sequences that resulted in exon inclusion or skipping. For each gene, two or three independently derived libraries were made, and each library was transfected in triplicate into HeLa cells to ensure the reproducibility of the results. The inclusion ratio of each 5′ss sequence was normalized to that of the consensus 5′ss sequence (CAG/GUAAGU) for each gene context. Two low-quality datasets (SMN1 library 1, replicate 1 and SMN1 library 3, replicate 3) were removed from further analysis (Figure S2A).
To ensure that the proper 5′ss was used, a junction analysis was performed using the respective forward (BRCA2 17F; SMN1 7F; IKBKAP 20F) and reverse primers (BRCA2 18R; SMN1 8R; IKBKAP 21R) that flank the exon-exon junction. The fragment was amplified first with the respective JUNCT F and JUNCT R primers to add a library-specific identifier, represented by the N10 within the primer sequences. A second round of amplification using PE1_v4 and PE2_v4 added Illumina-compatible ends for sequencing.
In silico analysis of shifted-register 5′ss
We identified shifted-register 5′ss using the following query sequences: NNHGTYRAGT, NYGGTYRAGT, NYAGTRRAGT, NYAGTYYAGT, NYAGTYRBGT, NYAGTYRAHT, and NYAGTYRAGV, where N = A, G, C or T; Y = C or T; R = A or G; H = A, T or C; B = G, C or T; V = G, A or C.
Primers
Primers are listed in Table S3. All primers were purchased from Sigma-Aldrich.
Quantification and statistical analysis
Read parsing
FASTQ files were parsed as follows. First, reads were organized according to sample, based on the 7–10 nt sample barcode, which was then removed from the read. Features of interest, including 5’ splice sites, barcodes, and junction sequences, were then parsed from these reads using regular expressions matching anchor sequences to the side of each sequence of interest. These features were then tallied and stored in tab-delimited text files for further processing.
Splice site-barcode association
As described above, splice site-barcode fragments were cut from their host plasmid, ligated to Illumina adaptors, and submitted for sequencing. This direct ligation protocol avoids PCR-mediated recombination between splice sites and barcodes, which we found to be a major problem in preliminary experiments. Upon parsing the resulting sequence data, we found that, by and large, each 20-nt barcode was associated with one unique splice-site sequence. Specifically, for each barcode, we called an associated splice site if at least 2 reads linked that splice site to the barcode in question, and if this number of reads was at least 4 times as large as the total number of reads linking the same barcode to other splice sites.
PSI quantification
As described above, barcodes were amplified from either total RNA or inclusion RNA using an RT-PCR reaction that added Illumina adaptors. After sequencing, each barcode was computationally associated with its corresponding 5′ss, and the total number of reads for each 5′ss was tallied. We denote these quantities for a given 5′ss as ntot and ninc, respectively. A “relative splicing ratio” that quantifies the relative amount of splicing, independent of the sequencing depth of each sample, was then computed as r = (ninc/ntot) / (Ninc/Ntot), where Ninc and Ntot denote the total number of reads in the inclusion RNA and total RNA samples, respectively. From this ratio, the “percent spliced in” was computed as PSI = 100*r/rcon, where rcon is the relative splicing ratio of the consensus splice site CAG/GUAAGU. The PSI values reported for each library are the median PSI values across replicates for that library, whereas the PSI values reported for each minigene context are the median PSI values across all replicates in all libraries for that context.
Junction quantification
RT-PCR was used to amplify exon junctions and add Illumina adaptors. Junction reads were parsed by regular expression matching to anchor sequences upstream and downstream of the variable 5′ss and splice junction with ~30 nt in between. The number of junctions with each observed length was then tallied, and junctions of exactly the expected length were deemed “correct”. We noted that a number of junction sequences were missing positions -2 and -1 of the 5′ss, which is likely due to the occurrence of ‘GU’ at these positions. We therefore excluded 5′ss with ‘GU’ at positions -2 and -1 from our analysis.
Pairwise dependency
We now describe the regression procedure used to infer pairwise dependencies in 5′ss. In what follows, indices i and j are used to denote the seven variable positions within each 5′ss, i.e., {-2, -1, 3, 4, 5, 6, 7}. Indices b and c are used to denote the four possible RNA bases, {A, C, G, U}. Each sequence s is represented using a 7 × 4 matrix with binary elements sib given by sib = 1 if base b occurs at position i and sib = 0 otherwise. To infer pairwise dependencies, we fit two different models: a “matrix” model, which accounts for the independent effects on PSI of each possible base at each position, and a “matrix + pairwise” model, which additionally accounts for effects on PSI missed by the matrix model. Mathematically, the matrix model is given by
| (Equation 1) |
where Aib quantifies the contribution of base b at position i. The matrix + pairwise model extends this matrix model and is defined by
| (Equation 2) |
where Bijbc denotes the cooperative contribution of having base b at position i together with base c appearing at position j. Matrix model parameters were fit to PSI measurements (only those ≥20%) using ridge regression, with a regularization parameter chosen using generalized cross-validation (Hastie et al., 2011). The additional pairwise model parameters, B_ijbc, were then fit to the residuals using the same ridge-regression procedure. These resulting values for B_ijbc are plotted in Figure 4.
Data and software availability
Illumina sequencing data has been deposited on the NCBI Sequence Read Archive under accession number SRA:SRP135892 (BioProject:PRJNA420342). Computational analyses were performed using custom Python scripts, which are available at https://github.com/jbkinney/15_splicing. Original data is deposited at Mendeley Data, http://dx.doi.org/10.17632/z25p7f4zvt.1.
Supplementary Material
Acknowledgments
The HeLa FRT clone was a generous gift from Dr. Woodring Wright and Dr. Jerry Shay (UT Southwestern Medical Center, TX). We sincerely thank Dr. Xavier Roca (Nanyang Technological University, Singapore) and Dr. David McCandlish (Cold Spring Harbor Laboratory, NY) for comments on the manuscript. We also thank Dr. Sara Ballouz (CSHL, NY) for assistance in parsing the ExAC database. This work was supported by NIH-NIGMS (5F32GM116372–03 and R37GM42699). J.B.K. and A.R.K. are members of the CSHL Cancer Center, which is supported by NIH Cancer Center Support Grant 5P30CA045508.
Footnotes
Declaration of Interests
The authors declare no competing interests.
References
- Anderson SL, Coli R, Daly IW, Kichula EA, Rork MJ, Volpi SA, Ekstein J, and Rubin BY (2001). Familial dysautonomia is caused by mutations of the IKAP gene. Am J Hum Genet 68, 753–8. [DOI] [PMC free article] [PubMed] [Google Scholar]
- Bao P, Hobartner C, Hartmuth K, and Luhrmann R (2017). Yeast Prp2 liberates the 5´ splice site and the branch site adenosine for catalysis of pre-mRNA splicing. RNA [DOI] [PMC free article] [PubMed]
- Bertram K, Agafonov D, Dybkov O, Haselbach D, Leelaram MN, Will CL, Urlaub H, Kastner B, Luhrmann R, and Stark H (2017). Cryo-EM structure of a pre-catalytic human spliceosome primed for activation. Cell 170, 701–713. [DOI] [PubMed] [Google Scholar]
- Buratti E, and Baralle FE (2004). Influence of RNA secondary structure on the pre-mRNA splicing process. Mol Cell Biol 24, 10505–14. [DOI] [PMC free article] [PubMed] [Google Scholar]
- Buratti E, Chives M, Romano M, Baralle M, Kralovicova J, Barallel F, Krainer A, and Vorechovsky I (2007). Aberrant 5’ splice sites in human disease genes: mutation pattern, nucleotide structure and comparison of computational tools that predict their utilization. Nucleic Acids Res 35, 4250–6. [DOI] [PMC free article] [PubMed] [Google Scholar]
- Burge C and Karlin S (1997). Prediction of complete gene structures in human genome DNA. J Mol Biol 268, 78–94. [DOI] [PubMed] [Google Scholar]
- Burge C (1998). Chapter 8. Modeling dependencies in pre-mRNA splicing signals, in Salzberg SL, Searls DB, and Kasif S, eds., Computational Methods in Molecular Biology, 129–164, Elsevier Science, Amsterdam. [Google Scholar]
- Carmel I, Tal S, Vig I, and Ast G (2004). Comparative analysis detects dependencies among the 5’ splice-site positions. RNA 10, 828–840. [DOI] [PMC free article] [PubMed] [Google Scholar]
- Cartegni L, Chew SL, and Krainer AR (2002). Listening to silence and understanding nonsense: exonic mutations that affect splicing. Nat Rev Genet 3, 285–98. [DOI] [PubMed] [Google Scholar]
- Collins CA, and Guthrie C (2001). Genetic interactions between the 5’ and 3’ splice site consensus sequences and U6 snRNA during the second catalytic step of pre-mRNA splicing. RNA 7, 1845–1854. [PMC free article] [PubMed] [Google Scholar]
- Fica SM, Oubridge C, Galej WP, Wilkinson ME, Bai XC, Newman AJ, and Nagai K (2017). Structure of a spliceosome remodeled for exon ligation. Nature 7641, 377–380. [DOI] [PMC free article] [PubMed] [Google Scholar]
- Finkel RS, Mercuri E, Darras BT, Connolly AM, Kuntz NL, Kirschner J, Chiriboga CA, Saito K, Servais L, Tizzano E, et al. (2017). Nusinersen versus sham control in infantile-onset spinal muscular atrophy. N Engl J Med 377, 1723–1732. [DOI] [PubMed] [Google Scholar]
- Freund M, Hicks MJ, Konermann C, Otte M, Hertel KJ, Schaal H (2005). Extended base pair complementarity between U1 snRNA and the 5´ splice site does not inhibit splicing in higher eukaryotes, but rather increases 5´ splice site recognition. Nucleic Acids Res 33, 5112–5119. [DOI] [PMC free article] [PubMed] [Google Scholar]
- Hartmann L, Theiss S, Niederacher D, Schaal H (2008). Diagnostics of pathogenic splicing mutations: Does bioinformatics cover all bases? Front Biosci 13, 3252–3272. [DOI] [PubMed] [Google Scholar]
- Hastie T, Tibshirani R, Friedman J (2011). The Elements of Statistical Learning 2nd ed. (New York: Springer; ). [Google Scholar]
- Hastings ML, and Krainer AR (2001). Pre-mRNA splicing in the new millennium. Curr Opin Cell Biol 3, 302–9. [DOI] [PubMed] [Google Scholar]
- Hofmann W, Horn D, Huttner C, Classen E, and Scherneck S (2003). The BRCA2 variant 8204G>A is a splicing mutation and results in an in frame deletion of the gene. J Med Genet 40, e23. [DOI] [PMC free article] [PubMed] [Google Scholar]
- Hua Y, Vickers TA, Baker BF, Bennett CF, and Krainer AR (2007). Enhancement of SMN2 exon 7 inclusion by antisense oligonucleotides targeting the exon. PloS Biol 5, e73. [DOI] [PMC free article] [PubMed] [Google Scholar]
- Hua Y, Vickers TA, Okunola HL, Bennett CF, Krainer AR (2008). Antisense masking of an hnRNP A1/A2 intronic splicing silencer corrects SMN2 splicing in transgenic mice. Am J Hum Genet 4, 834–48. [DOI] [PMC free article] [PubMed] [Google Scholar]
- Julien P, Minana B, Baeza-Centurion P, Valcarcel J, Lehner B (2016). The complete local genotype-phenotype landscape for the alternative splicing of a human exon. Nat Comm 7:11558. [DOI] [PMC free article] [PubMed] [Google Scholar]
- Ke S, Anquetil V, Zamalloa J, Maity A, Yang A, Arias MA, Kalachikov S, Russo JJ, Ju J, and Chasin LA (2018). Saturation mutagenesis reveals manifold determinants of exon definition. Genome Research 1:11–24. [DOI] [PMC free article] [PubMed] [Google Scholar]
- Ketterling RP, Drost JB, Scaringe WA, Liao DZ, Liu JZ, Kasper CK, and Sommer SS (1999). Reported in vivo splice-site mutations in the factor IX gene: Severity of splicing defects and a hypothesis for predicting deleterious splice donor mutations. Hum Mutat 13, 221–231. [DOI] [PubMed] [Google Scholar]
- Kondo Y, Oubridge C, van Roon AM, and Nagai K (2015). Crystal structure of human U1 snRNP, a small nuclear ribonucleoprotein particle, reveals the mechanism of 5′ splice site recognition. Elife 4, e04986. [DOI] [PMC free article] [PubMed] [Google Scholar]
- Krawczak M, Reiss J, and Cooper DN (1992). The mutational spectrum of single base-pair substitutions in mRNA splice junctions of human genes: causes and consequences. Human Genetics 90, 41–54. [DOI] [PubMed] [Google Scholar]
- Krawczak M, Ball EV, Fenton I, Stenson PD, Abeysinghe S, Thomas N, and Cooper DN (2000). Human gene mutation database-a biomedical information and research resource. Hum Mutat 1, 45–51. [DOI] [PubMed] [Google Scholar]
- Krogh A, Brown M, Mian I, Sjolander K, and Haussler D (1994). Hidden Markov models in computational biology. Applications to protein modeling. J Mol Biol 235, 1501–1531. [DOI] [PubMed] [Google Scholar]
- Kruger J, and Rehmsmeier M (2006). RNAhybrid: microRNA target prediction easy, fast and flexible. Nucleic Acids Res 34,W451–4. [DOI] [PMC free article] [PubMed] [Google Scholar]
- Kubota T, Roca X, Kimura T, Kokunai Y, Nishino I, Sakoda S, Krainer AR, Takahashi MP (2011). A mutation in a rare type of intron in a sodium-channel gene results in aberrant splicing and causes myotonia. Hum Mutat 7:773–82. [DOI] [PMC free article] [PubMed] [Google Scholar]
- Landrum MJ, Lee JM, Benson M, Brown G, Chao C, Chitipiralla S, Gu B, Hart J, Hoffman D, Hoover J, Jang W, Katz K, Ovetsky M, Riley G, Sethi A, Tully R, Villamarin-Salomon R, Rubinstein W, and Maglott DR (2015). ClinVar: public archive of interpretations of clinically relevant variants. Nucleic Acids Res 44, D862–8. [DOI] [PMC free article] [PubMed] [Google Scholar]
- Lefebvre S, Burglen L, Reboullet S, Clermont O, Burlet P, Viollet L, Benichou B, Cruaud C, Millasseau P, Zeviani M, et al. (1995). Identification and characterization of a spinal muscular atrophy-determining gene. Cell 80, 155–165. [DOI] [PubMed] [Google Scholar]
- Lek M, Karczewski KJ, Minikel EV, Samocha KE, Banks E, Fennell T, O’Donnell-Luria AH, Ware JS, Hill AJ, Cummings BB, et al. (2016). Analysis of protein-coding genetic variation in 60,706 humans. Nature 536, 285–291. [DOI] [PMC free article] [PubMed] [Google Scholar]
- Lerner M, Boyle J, Mount S, Wolin S, and Steitz JA (1980). Are snRNPs involved in splicing? Nature 283, 220–224. [DOI] [PubMed] [Google Scholar]
- Nilsen TW, and Graveley BR (2010). Expansion of the eukaryotic proteome by alternative splicing. Nature 463, 457–463. [DOI] [PMC free article] [PubMed] [Google Scholar]
- Otwinowski J, McCandlish DM, Plotkin J (2018) Inferring the shape of global epistasis. bioRxiv [preprint] 10.1101/278630. [DOI] [PMC free article] [PubMed]
- Palacino J, Swalley SE, Song C, Cheung AK, Shu L, Zhang X, Hoosear MV, Shin Y, Chin DV, Keller CG, et al. (2015). SMN2 splice modulators enhance U1-pre-mRNA association and rescue SMA mice. Nature chemical biology 11, 511–517. [DOI] [PubMed] [Google Scholar]
- Roca X, Olson AJ, Rao AR, Enerly E, Kristensen VN, Borresen-Dale A, Andresen BS, Krainer AR, and Sachidanandam R (2008). Features of 5´-splice-site efficiency derived from disease-causing mutations and comparative genomics. Genome Research 18, 77–87. [DOI] [PMC free article] [PubMed] [Google Scholar]
- Roca X, and Krainer AR (2009). Recognition of atypical 5′ splice sites by shifted base-pairing to U1 snRNA. Nature Structural & Molecular Biology 16, 176–182. [DOI] [PMC free article] [PubMed] [Google Scholar]
- Roca X, Akerman M, Gaus H, Berdeja A, Bennett F, and Krainer AR (2012). Widespread recognition of 5′ splice sites by noncanonical base-pairing to U1 snRNA involving bulged nucleotides. Genes Dev 10, 1098–109. [DOI] [PMC free article] [PubMed] [Google Scholar]
- Rogers J, and Wall R (1980). A mechanism for RNA splicing. Proc Natl Acad Sci U S A 77, 1877–9. [DOI] [PMC free article] [PubMed] [Google Scholar]
- Rosenberg AB, Patwardhan RP, Shendure J, and Seelig G (2015). Learning the sequence determinants of alternative splicing from millions of random sequences. Cell 163, 698–711. [DOI] [PubMed] [Google Scholar]
- Sahashi K, Masuda A, Matsuura T, Shinmi J, Zhang Z, Takeshima Y, Matsuo M, Sobue G, and Ohno K (2007). In vitro and in silico analysis reveals an efficient algorithm to predict the splicing consequences of mutations at the 5′ splice sites. Nucleic Acids Res 18, 5995–6003. [DOI] [PMC free article] [PubMed] [Google Scholar]
- Sheth N, Roca X, Hastings ML, Roeder T, Krainer AR, and Sachidanandam R (2006). Comprehensive splice-site analysis using comparative genomics. Nucleic Acids Research 34, 3955–3967. [DOI] [PMC free article] [PubMed] [Google Scholar]
- Siatecka M, Reyes JL, and Konarska MM (1999). Functional interactions of Prp8 with both splice sites at the spliceosomal analytic center. Genes Dev 13, 1983–1993. [DOI] [PMC free article] [PubMed] [Google Scholar]
- Singh NN, Androphy EJ, and Singh RN (2004). In vivo selection reveals combinatorial controls that define a critical exon in the spinal muscular atrophy genes. RNA 10, 1291–1305. [DOI] [PMC free article] [PubMed] [Google Scholar]
- Singh NN, Del Rio-Malewski JB, Luo D, Ottesen EW, Howell MD, Singh RN (2017). Activation of a cryptic 5′ splice site reverses the impact of pathogenic splice site mutations in the spinal muscular atrophy gene. Nucleic Acids Res 10.1093/nar/gkx824. [DOI] [PMC free article] [PubMed]
- Sivaramakrishnan M, McCarthy KD, Campagne S, Huber S, Meier S, Augustin A, Heckel T, Meistermann H, Hug MN, Birrer P, et al. (2017). Binding to SMN2 pre-mRNA-protein complex elicits specificity for small molecule splicing modifiers. Nat Commun 8, 1476. [DOI] [PMC free article] [PubMed] [Google Scholar]
- Slaugenhaupt SA, Blumenfeld A, Gill SP, Leyne M, Mull J, Cuajungco MP, Liebert CB, Chadwick B, Idelson M, Reznik L, Robbins C, Makalowska I, Browstein M, Krappmann D, Scheidereit C, Maayan C, Axelrod FB, and Gusella JF (2001). Tissue-specific expression of a splicing mutation in the IKBKAP gene causes familial dysautonomia. Am J Hum Genet 68, 598–605. [DOI] [PMC free article] [PubMed] [Google Scholar]
- Soemedi R, Cygan KJ, Rhine CL, Wang J, Bulacan C, Yang J, Bayrak-Toydemir P, McDonald J, and Fairbrother WG (2017). Pathogenic variants that alter protein code often disrupt splicing. Nat Genet 49, 848–855. [DOI] [PMC free article] [PubMed] [Google Scholar]
- Sontheimer EJ, and Steitz JA (1993). The U5 and U6 small nuclear RNAs as active site components of the spliceosome. Science 262, 1989–1996. [DOI] [PubMed] [Google Scholar]
- Srebrow A, and Kornblihtt AR (2006). The connection between splicing and cancer. Journal of Cell Science 119, 2635–2641. [DOI] [PubMed] [Google Scholar]
- Staley JP, and Guthrie C (1999). An RNA switch at the 5′ splice site requires ATP and the DEAD box protein Prp28p. Mol Cell 3, 55–64. [DOI] [PubMed] [Google Scholar]
- Tan J, Ho JX, Zhong Z, Luo S, Chen G, and Roca X (2016). Noncanonical registers and base pairs in human 5’ splice-site selection. Nucleic Acids Res 8:3908–21. [DOI] [PMC free article] [PubMed] [Google Scholar]
- Tarn WY, Yario TA, and Steitz JA (1995). U12 snRNA in vertebrates: evolutionary conservation of 5′ sequences implicated in splicing of pre-mRNAs containing a minor class of introns. RNA 1, 644–656. [PMC free article] [PubMed] [Google Scholar]
- Teng DH, Bogden R, Mitchell J, Baumgard M, Bell R, Berry S, Davis T, Ha PC, Kehrer R, Jammulapati S, Chen Q, Offit K, Skolnick MH, Tavtigian SV, Jhanwar S, Swedlund B, Wong AK, and Kamb A (1996). Low incidence of BRCA2 mutations in breast carcinoma and other cancers. Nat Genet 13, 241–244. [DOI] [PubMed] [Google Scholar]
- University of Utah Department of Pathology and ARUP Laboratories. “BRCA Mutation Databases” 2014. http://arup.utah.edu/database/BRCA/
- Wan R, Yan C, Bai R, Lei J, and Shi Y (2017). Structure of an intron lariat spliceosome from Saccharomyces cerevisiae. Cell 171, 120–132. [DOI] [PubMed] [Google Scholar]
- Wang J, Smith PJ, Krainer AR, and Zhang MQ (2005). Distribution of SR protein exonic splicing enhancer motifs in human protein-coding genes. Nucleic Acids Res 16, 5053–62. [DOI] [PMC free article] [PubMed] [Google Scholar]
- Wang Z, and Burge CB (2008). Splicing regulation: from a part list of regulatory elements to an integrated splicing code. RNA 5, 802–13. [DOI] [PMC free article] [PubMed] [Google Scholar]
- Will CL, and Lührmann R (2011). Spliceosome structure and function. Cold Spring Harb Perspect Biol 3, a003707. [DOI] [PMC free article] [PubMed] [Google Scholar]
- Yeo G, and Burge CB (2004). Maximum entropy modeling of short sequence motifs with applications to RNA splicing signals. J Comput Biol 11, 377–94. [DOI] [PubMed] [Google Scholar]
- Zhuang Y, and Weiner AM (1986). A compensatory base change in U1 snRNA suppresses a 5’ splice site mutation. Cell 6:827–35. [DOI] [PubMed] [Google Scholar]
Associated Data
This section collects any data citations, data availability statements, or supplementary materials included in this article.