. 2018 Oct 10;7:e37059. doi: 10.7554/eLife.37059

Figure 2. Target candidate prioritization and its performance assessment.

(A) The entire literature curated PPI network with co-abundance edges from all three stimulation conditions, providing a global view of the distribution and connectivity of co-abundance edges and drug targets (Figure 2—figure supplement 1 for a quantification of related degree distributions and largest connected component (LCC) sizes). A force-directed layout algorithm was used to visualize the networks. Edge colors follow the same convention as Figure 1. (Inset) Toy network depicting the drug target prioritization scheme: For each candidate protein (green node), the shortest path length to each CVD drug target (blue nodes) is calculated and the proximity score PS(c) is calculated (see Materials and methods). Shortest paths between the candidate and CVD drug targets are denoted with the thicker edges and may consist of both PPI and co-abundance edges. (B) The ROC curves for iCTNet CVD drug targets on PPI network only and PPI network with added co-abundance edges, with AUROCs shown in the legend. (C) Violin plots showing the distribution of percentile ranks of iCTNet CVD drug targets on PPI network only and PPI network with added co-abundance edges. Dashed lines indicate the 2nd quartiles (medians) and dotted lines indicate the 1st and 3rd quartiles. (D) AUROC value comparison between PPI and co-abundance edges (indicated by triangles) and PPI and the same number of randomly added edges as the co-abundance networks (circles with error bars). Randomization was repeated for 20 realizations using degree-preserving randomization (see Materials and methods). All empirical p-values between co-abundance and random case are less than 0.05. The AUROC of the PPI network is indicated by the grey dashed line. (E) ROC curves and prediction percentile rank violin plots for external drug target databases: DrugCentral, TCRD Clinical and TCRD Chemical. Violin plots show the distribution of percentile ranks of CVD drug targets from these databases for each case. Dashed lines indicate the 2nd quartiles (medians) and dotted lines indicate the 1st and 3rd quartiles. (F) ROC curves and prediction percentile rank violin plots for inflammation (Inflammatome), innate immune response (InnateDB) and coronary artery disease (CADGene) signatures. Violin plots show the distribution of percentile ranks of proteins implicated in these datasets for each case. Dashed lines indicate the 2nd quartiles (medians) and dotted lines indicate the 1st and 3rd quartiles.

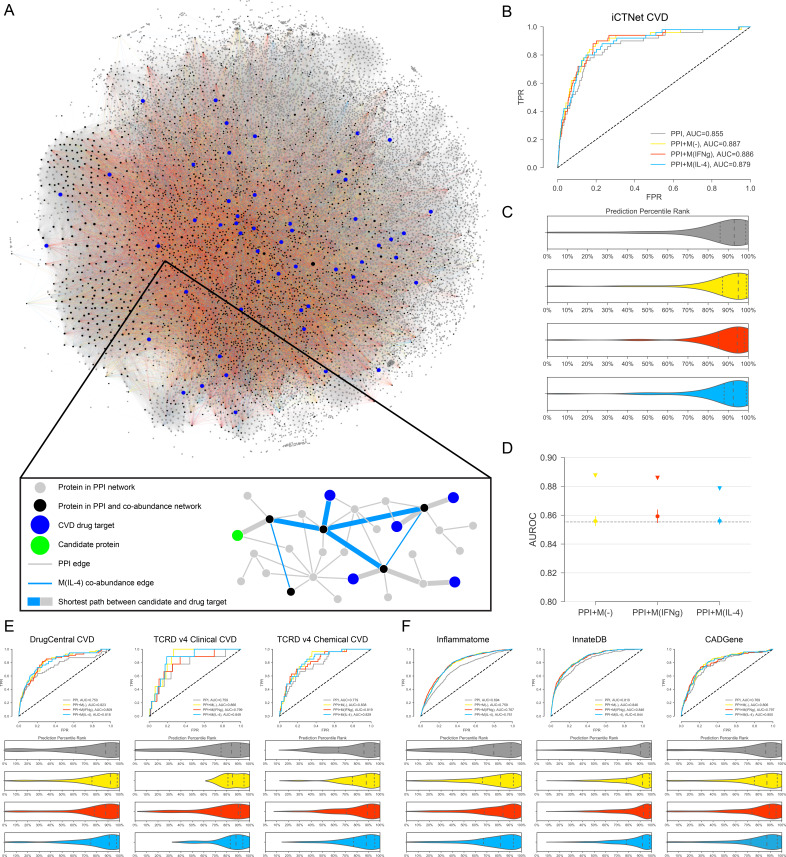
Figure 2.

Figure 2—figure supplement 1.

Figure 2—figure supplement 1.

(A) Significance of the largest connected component (LCC) of CVD drug targets mapped onto the PPI network only and the respective combined networks. Z-scores are calculated based on 10,000 degree-preserving randomizations. (B) Boxplots comparing the degree distributions of CVD drug targets with the degree distributions of other proteins. The comparison was made for the PPI network, M(-) co-abundance network, M(IFNγ) co-abundance network, and M(IL-4) co-abundance network, respectively. The ‘de-noised’ PPI network with the low-throughput and co-complex edges removed was used. Mann-Whitney U test was performed to obtain two-sided p-values. (C) Boxplots comparing the degree distributions of proteins connected by CoA edges (i.e. CoA network nodes) in the PPI network to the degree distributions of other nodes in the PPI network. The comparison was made for the M(-) co-abundance network, M(IFNγ) co-abundance network, and M(IL-4) co-abundance network, respectively. The ‘de-noised’ PPI network with the low-throughput and co-complex edges removed was used. Mann-Whitney U test was performed to obtain two-sided p-values.
Figure 2—figure supplement 2. For the iCTNet CVD drug targets.

Figure 2—figure supplement 2.

(A) The k-fold cross-validated (k = 7) ROC curves for M(-), M(IFNγ), M(IL-4), PPI, PPI + M(-), PPI + M(IFNγ) and PPI + M(IL-4), respectively. Shaded regions represent the standard deviation of the AUROC values from all folds. (B) The AUROC values of each individual fold from the cross-validation for PPI and PPI + M(-), PPI and PPI + M(IFNγ), PPI and PPI + M(IL-4), respectively. Paired t-test was performed to obtain two-sided p-values. (C) Precision-recall curves for PPI, PPI + M(-), PPI + M(IFNγ) and PPI + M(IL-4).
Figure 2—figure supplement 3. For the iCTNet CVD drug targets.

Figure 2—figure supplement 3.

(A) ROC curves for M(-), M(IFNγ), M(IL-4), PPI, PPI + M(-), PPI + M(IFNγ) and PPI + M(IL-4), comparing the original PPI, PPI with low-throughput edges removed, and PPI with low-throughput and co-complex edges removed. (B) ROC curves for PPI, PPI + M(-), PPI + M(IFNγ) and PPI + M(IL-4), comparing the original PPI, PPI with low-throughput edges removed, and PPI with low-throughput and co-complex edges removed. (C) The k-fold cross-validated (k = 7) ROC curves for, PPI + M(-), PPI + M(IFNγ) and PPI + M(IL-4), comparing the original PPI, PPI with low-throughput edges removed, and PPI with low-throughput and co-complex edges removed. (D) The AUROC values of each individual fold from the cross-validation for PPI and PPI + M(-), PPI and PPI + M(IFNγ), PPI and PPI + M(IL-4), comparing the original PPI, PPI with low-throughput edges removed, and PPI with low-throughput and co-complex edges removed. Paired t-test was performed to obtain two-sided p-values.
Figure 2—figure supplement 4.

Figure 2—figure supplement 4.

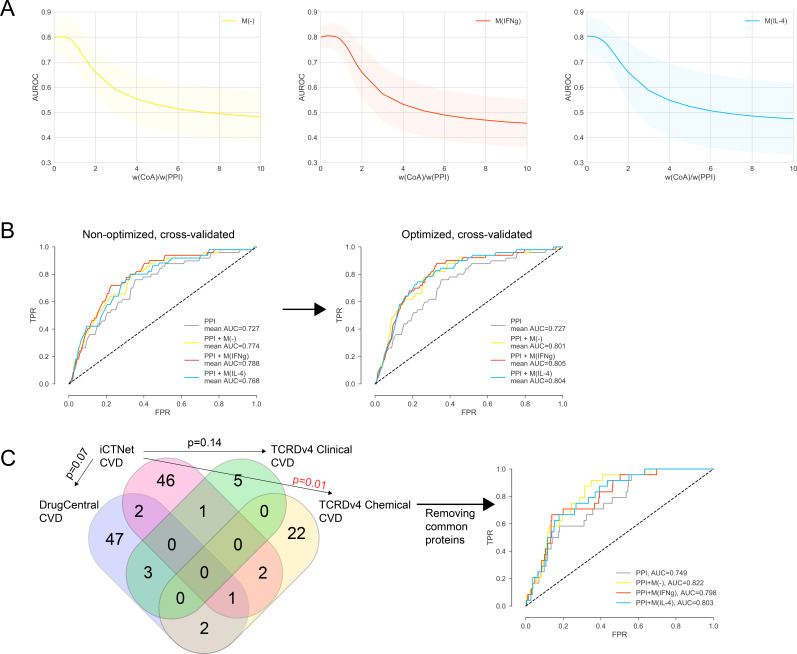
(A) The weight ratio between co-abundance and PPI edges, w(CoA)/w(PPI), as a function of the area under the ROC curve (AUROC) for PPI + M(-), PPI + M(IFNγ) and PPI + M(IL-4), respectively. Shaded regions represent the standard deviation of the AUROC values from all folds. The ‘de-noised’ PPI network with the low-throughput and co-complex edges removed was used. (B) The k-fold cross-validated (k = 7) ROC curves for, PPI + M(-), PPI + M(IFNγ) and PPI + M(IL-4), comparing the non-optimized and optimized case. w(CoA)/w(PPI) was 0.4, 0.4, and 0.1 for PPI + M(-), PPI + M(IFNγ) and PPI + M(IL-4), respectively. (C) Overlap between CVD drug target sets used in the prioritization and external validation. Fisher’s exact test was used and two-sided p-values were reported. In the case of the one significant overlap between iCTNet and TCRDv4 Clinical CVD drug targets, the ROC curve was re-plotted.
Figure 2—figure supplement 5.

Figure 2—figure supplement 5.

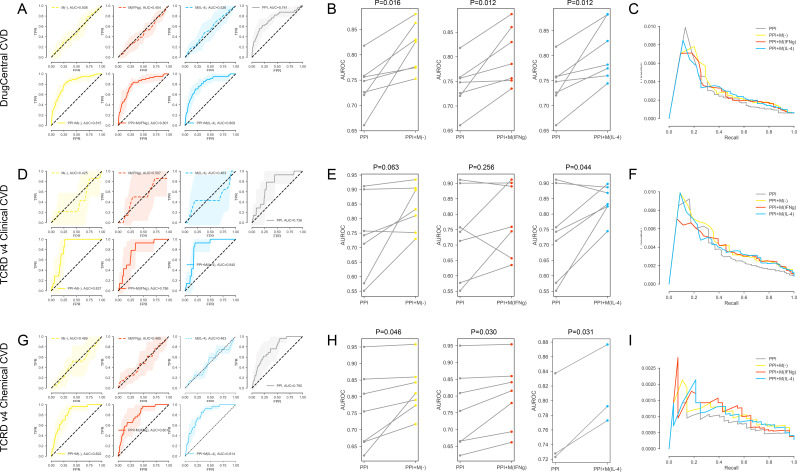
(A-C) For the DrugCentral CVD drug targets. (A) The k-fold cross-validated (k = 7) ROC curves for M(-), M(IFNγ), M(IL-4), PPI, PPI + M(-), PPI + M(IFNγ) and PPI + M(IL-4), respectively.Shaded regions represent the standard deviation of the AUROC values from all folds. (B) The AUROC values of each individual fold from the cross-validation for PPI and PPI + M(-), PPI and PPI + M(IFNγ), PPI and PPI + M(IL-4), respectively. Paired t-test was performed to obtain two-sided p-values. (C) Precision-recall curves for PPI, PPI + M(-), PPI + M(IFNγ) and PPI + M(IL-4). (D–F) For the TCRDv4 Clinical CVD drug targets: (D) The k-fold cross-validated (k = 7) ROC curves for M(-), M(IFNγ), M(IL-4), PPI, PPI + M(-), PPI + M(IFNγ) and PPI + M(IL-4), respectively. Shaded regions represent the standard deviation of the AUROC values from all folds. (E) The AUROC values of each individual fold from the cross-validation for PPI and PPI + M(-), PPI and PPI + M(IFNγ), PPI and PPI + M(IL-4), respectively. Paired t-test was performed to obtain two-sided p-values. (F) Precision-recall curves for PPI, PPI + M(-), PPI + M(IFNγ) and PPI + M(IL-4). (G–I) For the TCRDv4 Chemical CVD drug targets: (G) The k-fold cross-validated (k = 7 for M(-) and M(IFNγ), k = 3 for M(IL-4)) ROC curves for M(-), M(IFNγ), M(IL-4), PPI, PPI + M(-), PPI + M(IFNγ) and PPI + M(IL-4), respectively. Shaded regions represent the standard deviation of the AUROC values from all folds. (H) The AUROC values of each individual fold from the cross-validation for PPI and PPI + M(-), PPI and PPI + M(IFNγ), PPI and PPI + M(IL-4), respectively. Paired t-test was performed to obtain two-sided p-values. (I) Precision-recall curves for PPI, PPI + M(-), PPI + M(IFNγ) and PPI + M(IL-4).
Figure 2—figure supplement 6.

Figure 2—figure supplement 6.

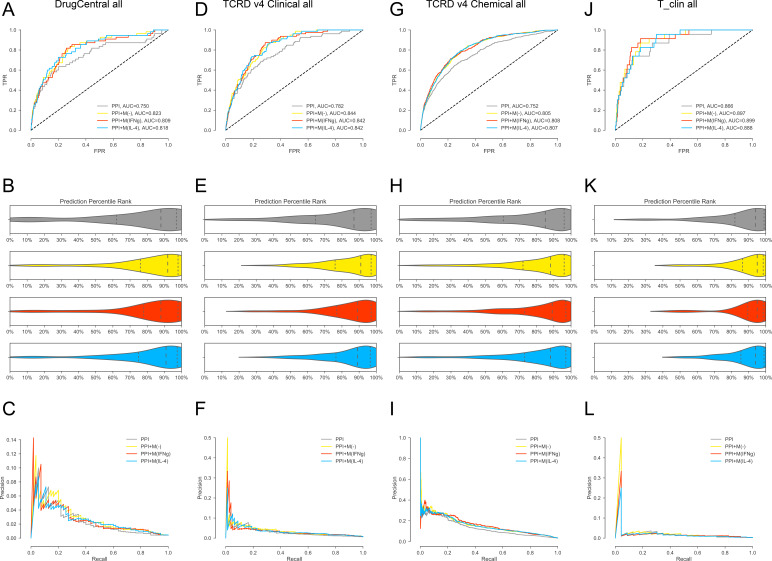
(A-C) For DrugCentral all drug targets. (A) ROC curves for, PPI, PPI + M(-), PPI + M(IFNγ) and PPI + M(IL-4), respectively.(B) Violin plots showing the distribution of percentile ranks of drug targets on PPI network only and PPI network with added co-abundance edges. Dashed lines indicate the 2nd quartiles (medians) and dotted lines indicate the 1st and 3rd quartiles. (C) Precision-recall curves for PPI, PPI + M(-), PPI + M(IFNγ) and PPI + M(IL-4). (D–F) For TCRDv4 clinical all drug targets: (D) ROC curves for, PPI, PPI + M(-), PPI + M(IFNγ) and PPI + M(IL-4), respectively. (E) Violin plots showing the distribution of percentile ranks of drug targets on PPI network only and PPI network with added co-abundance edges. Dashed lines indicate the 2nd quartiles (medians) and dotted lines indicate the 1 st and 3rd quartiles. (F) Precision-recall curves for PPI, PPI + M(-), PPI + M(IFNγ) and PPI + M(IL-4). (G–I:) For TCRDv4 chemical all drug targets: (G) ROC curves for, PPI, PPI + M(-), PPI + M(IFNγ) and PPI + M(IL-4), respectively. (H) Violin plots showing the distribution of percentile ranks of drug targets on PPI network only and PPI network with added co-abundance edges. Dashed lines indicate the 2nd quartiles (medians) and dotted lines indicate the 1st and 3rd quartiles. (I) Precision-recall curves for PPI, PPI + M(-), PPI + M(IFNγ) and PPI + M(IL-4). (J–L) For T_clin all drug targets: (J) ROC curves for, PPI, PPI + M(-), PPI + M(IFNγ) and PPI + M(IL-4), respectively. (K) Violin plots showing the distribution of percentile ranks of drug targets on PPI network only and PPI network with added co-abundance edges. Dashed lines indicate the 2nd quartiles (medians) and dotted lines indicate the 1st and 3rd quartiles. (L) Precision-recall curves for PPI, PPI + M(-), PPI + M(IFNγ) and PPI + M(IL-4).
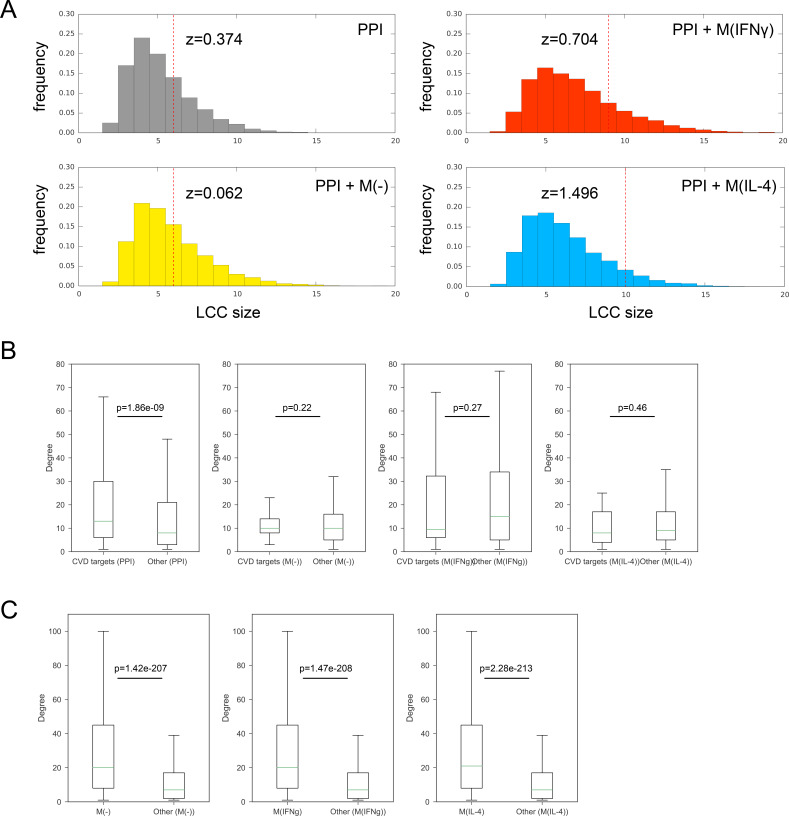
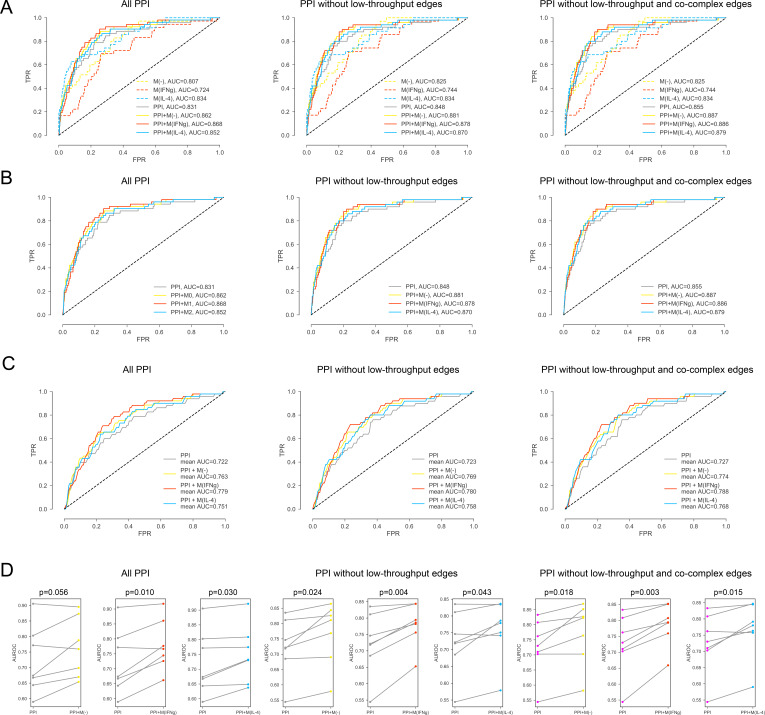
Figure 2—figure supplement 7.

Figure 2—figure supplement 7.

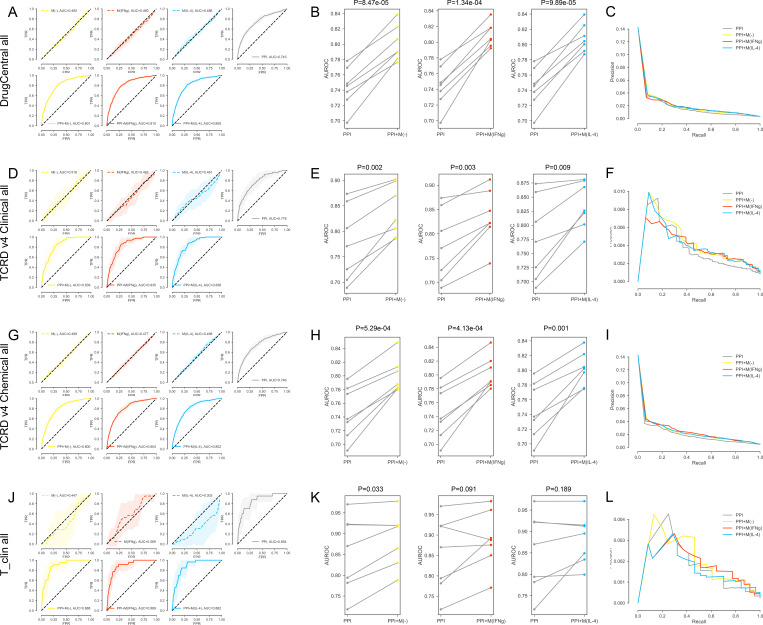
(A-C) For the DrugCentral all drug targets. (A) The k-fold cross-validated (k = 7) ROC curves for M(-), M(IFNγ), M(IL-4), PPI, PPI + M(-), PPI + M(IFNγ) and PPI + M(IL-4), respectively.Shaded regions represent the standard deviation of the AUROC values from all folds.(B) The AUROC values of each individual fold from the cross-validation for PPI and PPI + M(-), PPI and PPI + M(IFNγ), PPI and PPI + M(IL-4), respectively. Paired t-test was performed to obtain two-sided p-values. (C) Precision-recall curves for PPI, PPI + M(-), PPI + M(IFNγ) and PPI + M(IL-4). (D–F) For the TCRDv4 Clinical all drug targets: (D) The k-fold cross-validated (k = 7) ROC curves for M(-), M(IFNγ), M(IL-4), PPI, PPI + M(-), PPI + M(IFNγ) and PPI + M(IL-4), respectively. Shaded regions represent the standard deviation of the AUROC values from all folds. (E) The AUROC values of each individual fold from the cross-validation for PPI and PPI + M(-), PPI and PPI + M(IFNγ), PPI and PPI + M(IL-4), respectively. Paired t-test was performed to obtain two-sided p-values. (F) Precision-recall curves for PPI, PPI + M(-), PPI + M(IFNγ) and PPI + M(IL-4). (G–I) For the TCRDv4 Chemical all drug targets: (G) The k-fold cross-validated (k = 7 for M(-) and M(IFNγ), k = 3 for M(IL-4)) ROC curves for M(-), M(IFNγ), M(IL-4), PPI, PPI + M(-), PPI + M(IFNγ) and PPI + M(IL-4), respectively. Shaded regions represent the standard deviation of the AUROC values from all folds. (H) The AUROC values of each individual fold from the cross-validation for PPI and PPI + M(-), PPI and PPI + M(IFNγ), PPI and PPI + M(IL-4), respectively. Paired t-test was performed to obtain two-sided p-values. (I) Precision-recall curves for PPI, PPI + M(-), PPI + M(IFNγ) and PPI + M(IL-4). (J–L) For the T_clin all drug targets: (J) The k-fold cross-validated (k = 7 for M(-) and M(IFNγ), k = 3 for M(IL-4)) ROC curves for M(-), M(IFNγ), M(IL-4), PPI, PPI + M(-), PPI + M(IFNγ) and PPI + M(IL-4), respectively. Shaded regions represent the standard deviation of the AUROC values from all folds. (K) The AUROC values of each individual fold from the cross-validation for PPI and PPI + M(-), PPI and PPI + M(IFNγ), PPI and PPI + M(IL-4), respectively. Paired t-test was performed to obtain two-sided p-values. (L) Precision-recall curves for PPI, PPI + M(-), PPI + M(IFNγ) and PPI + M(IL-4).
Figure 2—figure supplement 8.

Figure 2—figure supplement 8.

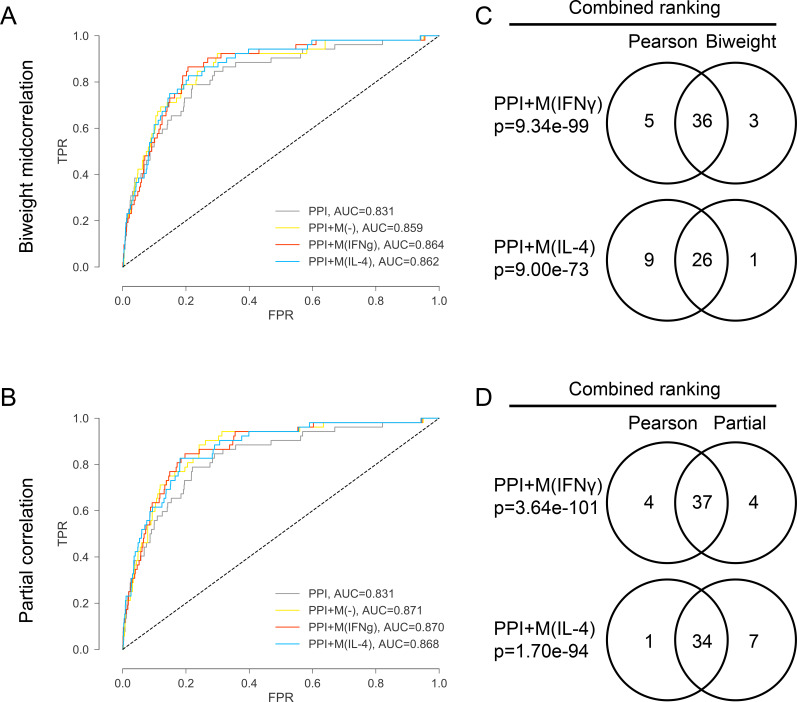
(A) ROC curves for PPI, PPI + M(-), PPI + M(IFNγ) and PPI + M(IL-4) where the co-abundance networks M(-), M(IFNγ) and M(IL-4) were built using biweight midcorrelation as the correlation measure. (B) ROC curves for PPI, PPI + M(-), PPI + M(IFNγ) and PPI + M(IL-4) where the co-abundance networks M(-), M(IFNγ) and M(IL-4) were built using partial correlation as the correlation measure, controlling for baseline abundances M(-). (C) Venn diagrams showing the overlap in terms of the final combined ranking between the two cases where Pearson’s correlation and biweight midcorrelation were used to build the co-abundance networks. Results are shown for the non-optimized case. Fisher’s exact test was used and two-sided p-values were reported. (D) Venn diagrams showing the overlap in terms of the final combined ranking between the two cases where Pearson’s correlation and partial correlation were used to build the co-abundance networks. Results are shown for the non-optimized case. Fisher’s exact test was used and two-sided p-values were reported.
Figure 2—figure supplement 9.

Figure 2—figure supplement 9.

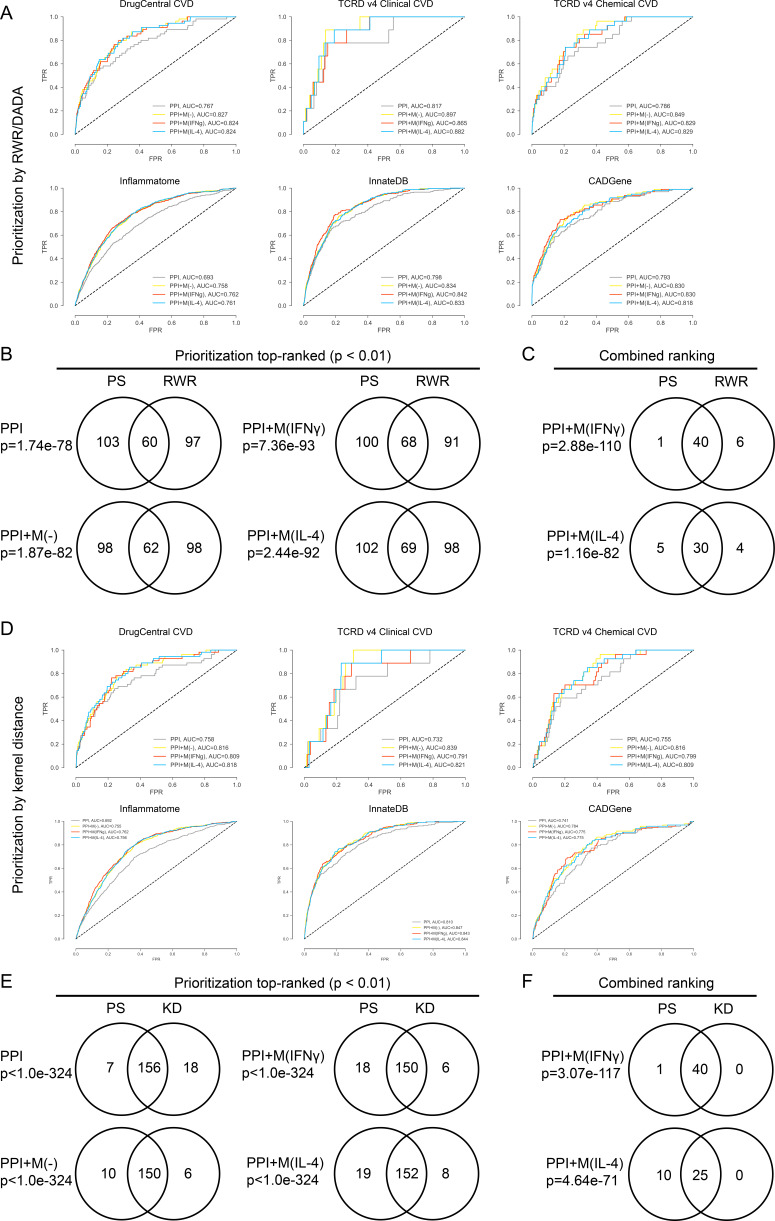
(A) ROC curves for PPI, PPI + M(-), PPI + M(IFNγ) and PPI + M(IL-4) for the validations sets, where random walk with restarts (RWR) was used as the prioritization method. (B) Venn diagrams showing the overlap in terms of the top-ranked candidates between the two cases where RWR and PS (shortest distance based proximity score used in this study) were used as the prioritization method to rank candidates. Results are shown for the non-optimized case. Fisher’s exact test was used and two-sided p-values were reported. (C) Venn diagrams showing the overlap in terms of the final combined ranking between the two cases where RWR and PS were used as the prioritization method to rank candidates. Results are shown for the non-optimized case. Fisher’s exact test was used and two-sided p-values were reported. (D) ROC curves for PPI, PPI + M(-), PPI + M(IFNγ) and PPI + M(IL-4) for the validations sets, where random walk with restarts (RWR) was used as the prioritization method. (E) Venn diagrams showing the overlap in terms of the top-ranked candidates between the two cases where KD (kernel distance) and PS (shortest distance measure used in this study) were used as the prioritization method to rank candidates. Results are shown for the non-optimized case. Fisher’s exact test was used and two-sided p-values were reported. (F) Venn diagrams showing the overlap in terms of the final combined ranking between the two cases where KD and PS were used as the prioritization method to rank candidates. Results are shown for the non-optimized case. Fisher’s exact test was used and two-sided p-values were reported.
Figure 2—figure supplement 10.

Figure 2—figure supplement 10.

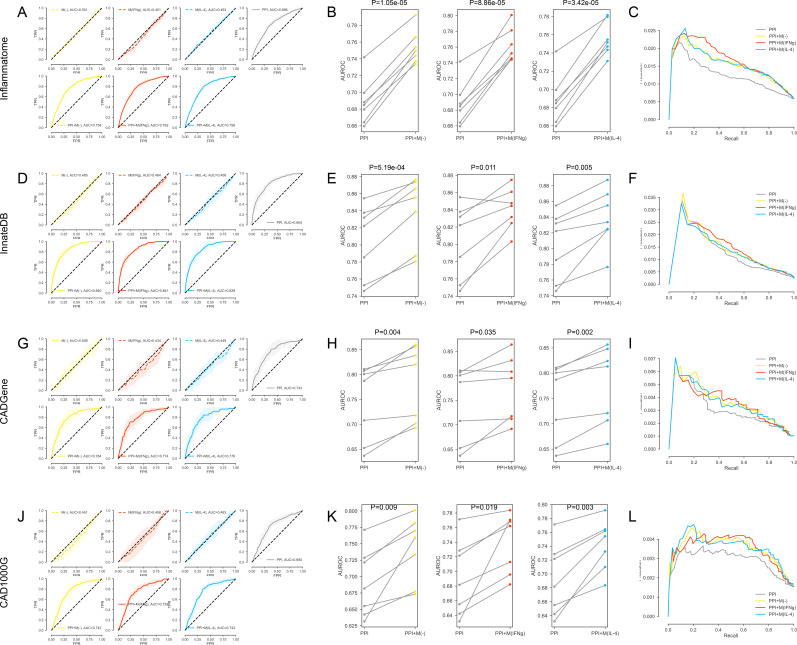
(A-C) For the inflammation (Inflammatome) signatures. (A) The k-fold cross-validated (k = 7) ROC curves for M(-), M(IFNγ), M(IL-4), PPI, PPI + M(-), PPI + M(IFNγ) and PPI + M(IL-4), respectively.Shaded regions represent the standard deviation of the AUROC values from all folds.(B) The AUROC values of each individual fold from the cross-validation for PPI and PPI + M(-), PPI and PPI + M(IFNγ), PPI and PPI + M(IL-4), respectively. Paired t-test was performed to obtain two-sided p-values. (C) Precision-recall curves for PPI, PPI + M(-), PPI + M(IFNγ) and PPI + M(IL-4). (D–F) For the innate immune response (InnateDB) signatures: (D) The k-fold cross-validated (k = 7) ROC curves for M(-), M(IFNγ), M(IL-4), PPI, PPI + M(-), PPI + M(IFNγ) and PPI + M(IL-4), respectively. Shaded regions represent the standard deviation of the AUROC values from all folds. (E) The AUROC values of each individual fold from the cross-validation for PPI and PPI + M(-), PPI and PPI + M(IFNγ), PPI and PPI + M(IL-4), respectively. Paired t-test was performed to obtain two-sided p-values. (F) Precision-recall curves for PPI, PPI + M(-), PPI + M(IFNγ) and PPI + M(IL-4). (G–I) For the coronary artery disease (CADGene) signatures: (G) The k-fold cross-validated (k = 7 for M(-) and M(IFNγ), k = 3 for M(IL-4)) ROC curves for M(-), M(IFNγ), M(IL-4), PPI, PPI + M(-), PPI + M(IFNγ) and PPI + M(IL-4), respectively. Shaded regions represent the standard deviation of the AUROC values from all folds. (H) The AUROC values of each individual fold from the cross-validation for PPI and PPI + M(-), PPI and PPI + M(IFNγ), PPI and PPI + M(IL-4), respectively. Paired t-test was performed to obtain two-sided p-values. (I) Precision-recall curves for PPI, PPI + M(-), PPI + M(IFNγ) and PPI + M(IL-4). (J–L) For the coronary artery disease (CAD1000G Extend) signatures: (J) The k-fold cross-validated (k = 7 for M(-) and M(IFNγ), k = 3 for M(IL-4)) ROC curves for M(-), M(IFNγ), M(IL-4), PPI, PPI + M(-), PPI + M(IFNγ) and PPI + M(IL-4), respectively. Shaded regions represent the standard deviation of the AUROC values from all folds. (K) The AUROC values of each individual fold from the cross-validation for PPI and PPI + M(-), PPI and PPI + M(IFNγ), PPI and PPI + M(IL-4), respectively. Paired t-test was performed to obtain two-sided p-values. (L) Precision-recall curves for PPI, PPI + M(-), PPI + M(IFNγ) and PPI + M(IL-4).