Abstract
Bone strength is a worldwide health concern. Although multiple techniques have been developed to evaluate bone quality, there are still gaps to be filled. Here we report a non-invasive approach for the prediction of bone strength in vivo using spatially offset Raman spectroscopy. Raman spectra were acquired transcutaneously from the tibiae of mice from 4 to 23 weeks old and subsequently on the exposed bones. Partial least squares regression was applied to generate predictions of the areal bone mineral density (aBMD), volumetric bone mineralization density (vBMD), and maximum torque (MT) of each tibia as quantified by dual-energy X-ray absorptiometry, microCT imaging, and biomechanical tests, respectively. Significant correlations were observed between Raman spectral predictions and the reference values in all three categories. To our knowledge, this is the first demonstration of Raman spectroscopy predicting a biomechanical bone parameter (MT) in vivo with an uncertainty much smaller than the spread in the reference values.
1. Introduction
Osteoporosis is a serious disease which affects more than 2 million people in the US [1]. Without appropriate diagnosis and treatment, it usually leads to bone fragility and fracture and the development of osteoporosis can cause further morbidity and even mortality. Bone density testing by dual-energy X-ray absorptiometry (DXA) is the current clinical standard for diagnosis. DXA measures areal bone mineral density (aBMD) and can reveal low bone mass and thus increased risk of fracture [2]. Despite the accuracy and convenience, aBMD measured by DXA can be a poor indicator in some circumstances, e.g. in measurements on early postmenopausal women [3], and requires the use of ionizing radiation. Similarly, X-ray computed tomography (CT) has been developed to scan bones and generate high resolution images of volumetric bone mineralization density (vBMD) [4]. However, CT requires a radiation dose around 100 times higher than DXA [5]. Magnetic resonance imaging (MRI), another non-invasive method commonly used to image the musculoskeletal system, has also been demonstrated to measure the density of bones [6]. MRI is not frequently applied on bones, however, due to its high cost. Recently, a minimally invasive diagnostic technique named reference point indentation (RPI) was also developed for the assessment of bone mechanical quality in vivo [7].
In addition to bone density and mechanical properties, chemical composition is a fundamental parameter related to bone quality. As a traditional non-invasive and label-free method for chemical characterization, Raman spectroscopy (RS) has shown its feasibility in measuring the mineral and organic matrix components in ex vivo bone studies [8–10]. Previous studies have shown RS can be used to measure perturbations to animal bone biochemistry due to disease, age [8,11], or exposure to heavy metals [12,13] or the effects of aging on human bone [14]. Significant correlations between Raman and biomechanical properties of bones have also been observed in these studies [8,11,13] with quantitative metrics suggesting that RS provides more accurate predictions of bone strength than the clinical parameter of aBMD.
In performing in vivo Raman spectroscopy on bones, one major concern is the confounding spectrum of the overlying soft tissue. Because this tissue contains some of the same chemical constituents as bone—most notably Type I collagen—it is desirable to reduce its contribution to the measured spectrum. Near-infrared confocal Raman microscopy is generally not suitable for transcutaneous bone characterization due to the limited penetration depth of approximately 500 microns in tissue [15]. Traditional wide-field illumination/collection from a surface spot several millimeters in diameter allows deeper regions to be probed, but their signal percentage is low compared to shallower regions. Spatially offset Raman spectroscopy (SORS), in contrast, introduces an offset between the illumination and collection regions to increase the percentage of signal from deeper regions, with the tradeoff of lower overall signal strength [16]. Previous studies have used SORS to detect bone beneath soft tissue [17–21]. Schulmerich et al. [17] gathered SORS measurements on 32 live mice and their exposed bones. They successfully detected bone spectra beneath soft tissue, though the performance was affected by system alignment and animal coat color. Buckley et al. [21] demonstrated spectral differences, albeit statistically underpowered, between 6 healthy human and 10 patients with osteoporosis, using in vivo SORS. Our group has also used SORS to detect disease-related differences in murine bones ex vivo [8]. To subtract off the remaining contribution from the soft tissue on top of bones, we also developed a simultaneous, overconstrained, library-based decomposition (SOLD) fitting method to separate the signal of bones from transcutaneously-acquired Raman spectra [18]. Furthermore, by using SORS to measure subcortical bone tissue from a mouse model of genetic osteogenesis imperfecta, we found that SORS was more sensitive to these specific disease-related biochemical changes than conventional Raman spectroscopy [20].
Here, we demonstrate that transcutaneous SORS measurements on live mice enable the prediction of three standard bone-quality metrics. We applied SORS on the right hind tibiae of mice and conducted DXA, microCT, and torsion testing subsequently to measure bone mineral density (aBMD), volumetric bone mineralization density (vBMD), and maximum torque (MT), respectively. Chemometric models were then constructed to predict aBMD, vBMD, and MT. The results indicate for the first time that SORS spectra acquired transcutaneously and in vivo can accurately predict bone mineralization and strength.
2. Material and methods
2.1 Specimens
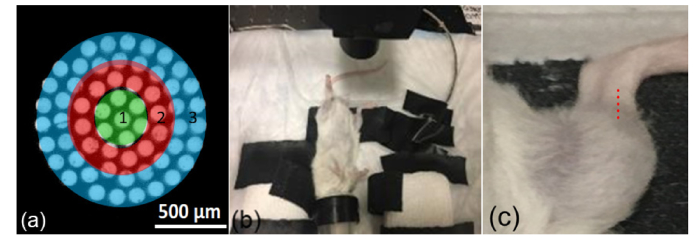
The mice used in this study ranged in age from 4 to 23 weeks and came from two different strains. Four male and four female C57BL/6J (black) mice with ages of 4 weeks and 23 weeks; four male and four female B6(Cg)-Tyrc-2J/J (Albino) mice with ages of 4 weeks, 8 weeks and 12 weeks; which is in total 40 mice, were measured transcutaneously on the right hind tibia with a SORS instrument (see Fig. 1). Following the transcutaneous measurements, mice were sacrificed and tibiae were extracted and evaluated by Raman spectroscopy. The exposed bone specimens were stored in phosphate buffered saline and frozen for less than 24 hours before the subsequent microCT, DXA, and biomechanical testing.
Fig. 1.
(a) Schematic of collection fiber images at the tissue surface, with ring 3 being the outermost zone. (b) Setup for live mouse measurement, with focusing/collecting lens above the right tibia and nose cone for anesthesia. (c) Zoomed in view with Raman sampling locations above the tibia indicated by overlaid red dots.
2.2 Raman spectroscopy
All the Raman data in this study were obtained with a RS system that has been described previously [8,20]. Briefly, the sample was excited with an infrared laser with 830-nm wavelength and 150-mW power in a spot with 230-µm diameter. The Raman scattered light was collected with a numerical aperture (NA) of 0.34 and imaged onto a circular bundle of 61 multimode fibers (0.27 NA, 100/120 µm core/cladding diameters), with the center fiber coregistered with the excitation spot on the sample. Light delivery and collection are both performed in a non-contact manner, with a consistent standoff distance of about 2 cm set by the focal length of the imaging/collecting lens. The other end of the bundle rearranged the fibers linearly at the entrance to a f/1.8 imaging spectrograph (Kaiser HoloSpec), and a charge coupled device (CCD) array enabled acquisition of 40 separate fibers’ spectra (limited by the array height). For the measurements of exposed bone, the laser illumination spot was defocused to a spot 1 mm in diameter overlapping the image of the entire collection fiber bundle to provide a wide field measurement. For each location on the mouse leg, spectra were acquired for five 60-second exposures and averaged.
Fiber spectra were processed as described previously [6], including cosmic ray removal, readout and dark current subtraction, and image aberration correction. For transcutaneous measurements, the 40 spectra were converted into three spectral averages, corresponding to the central region of the circular end (henceforth “Ring 1”) and two concentric rings around it (“Rings 2 and 3”), as illustrated in Fig. 1. These three average spectra corresponded to spatial offsets between illumination and collection from s = 0 to approximately s = 0.5 mm. For the wide-field exposed bone measurements, a single average was computed using all 40 fibers’ spectra. Five measurements along the midshaft of the tibia at 1 mm intervals were averaged to produce a single spectrum per tibia. A continuous wavelet transform background-correction algorithm subtracted a fluorescence estimate from each raw spectrum [22]. The spectra were then smoothed with a Savitzky-Golay filter [23] over a 3 pixel window to match the spectral resolution of the system (approximately 5 cm−1).
2.3 Dual-energy X-ray absorptiometry
aBMD was measured on the right tibia using a PIXImus dual-energy X-ray absorptiometer (GE-Lunar), as described elsewhere [24]. Briefly, the equipment was calibrated daily on a mouse phantom provided by the manufacturer. X-ray absorptiometry data were collected and processed with provided software (Lunar PIXImus 2, Version 2.1, GE-Lunar).
2.4 Microcomputed tomography
The procedures for measuring vBMD using microCT have been described previously [8]. Briefly, a Scanco VivaCT 40 (Scanco Medical AG, Bassersdorf, Switzerland) with 0.5 µm isotropic resolution was used to measure vBMD in the proximal half of the tibia. The value was calculated from three-dimensional reconstructions of microCT scans generated by complete image solution software (Scanco, Medical, Basserdorf, Switzerland).
2.5 Biomechanical testing
Following DXA, microCT, and Raman measurements, tibiae were evaluated in torsion via a biomechanical torsion test described previously [8]. Briefly, tibiae were rehydrated and mounted on an EnduraTec TestBenchTM system (200 N∙mm torque cell; Bose Corporation, Minnetonka, Minnesota), with 4 mm of bone length exposed between the contact points. Bones were gradually loaded in torsion at a rate of 1 °/s until fracture, and the maximum torque (MT) applied prior to fracture was recorded. Due to fragility, two bones from 4-week-old mice and one from an 8-week-old were broken prior to torsion testing (but after DXA and microCT testing), and thus only 37 MT values were obtained.
Torsional testing, the method chosen in this study, explores one mode of loading that commonly leads to long bone fractures in humans. Bending, another common fracture mode, is explored by other tests such as three-point bending, e.g. in a model of skeletal fragility [25].
2.6 Data analysis
Linear models to predict biomechanical properties from Raman spectral data were built using standard partial least squares regression (PLSR) [23] as described previously [8]. A leave one out cross validation (LOOCV) approach was used to generate Raman-based prediction of aBMD for each tibia via PLSR, and the root mean squared error of cross validation (RMSECV) was calculated. In each iteration of the cross-validation, the rank of the PLSR model was selected based on the method published by Haaland and Thomas [26] and required to be smaller than one third of the sample size, in order to prevent overfitting the calibration data [27]. The same processing was done for prediction of vBMD.
To guard against flaws in the biomechanical measurements, MT values more than three median absolute deviations away from the median of their age cohort were excluded as outliers. This criterion rejected two MT measurements, leaving 35 mice for analysis. Two different PLS approaches were used. In the first approach, the entire set of mice was analyzed as a single group, just as for aBMD and vBMD prediction. In the second approach, the spectra from 23-week-old mice were placed in a separate group from the younger ones, and a separate LOOCV PLSR model was developed for each group. The reasoning for this, related to chemical effects at different ages, will be explained in the subsequent section.
3. Results and discussion
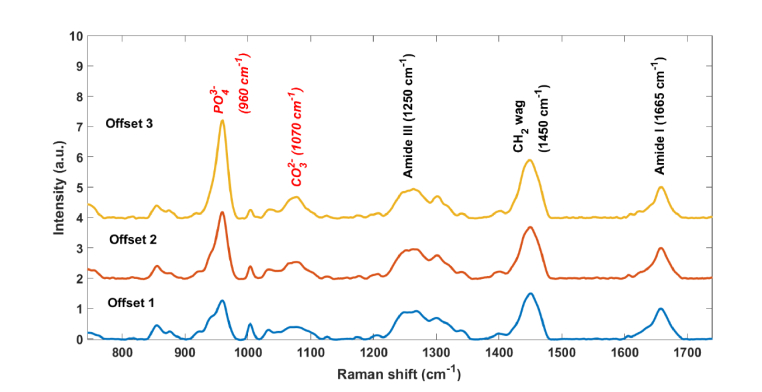
Figure 2 shows representative in vivo Raman spectra acquired over the tibia of a mouse. The three spectra were acquired from different rings (see Fig. 1(a)). The corresponding peaks in all three spectra have similar signal to noise, as the larger number of fibers in ring 3 compensates for the larger per-fiber signal strength in ring 1. Prominent tissue and bone peaks can be found in all spectra, such as CH2 (1450 cm−1), Amide III (1243-1320 cm−1), hydroxyproline (876 cm−1), phosphate (959 cm−1) and carbonate (1070 cm−1) [28]. The relative strength of the mineral peaks increases as the offset increases, as expected from the increased relative contribution from greater depths. The higher bone-to-soft-tissue ratio in ring 3 would be expected to be the most valuable for analysis of bone strength. Most of the subsequent analysis was therefore performed using the spectra from ring 3, although a comparison with ring 1 results will also be discussed.
Fig. 2.
Transcutaneous Raman spectra acquired over one mouse tibia with different source-detector offsets, from 0 (Offset 1) to 0.5 mm (Offset 3), based upon the rings defined in Fig. 1(a). Spectra are normalized to the area under the peak at 1660 cm−1. The relative increase in the phosphate peak from Offset 1 to Offset 3 indicates the stronger relative contribution of bone in Offset 3.
Figures 3(a) and (b) depict the trends of aBMD and MT with age. It can be seen from Fig. 3 that the aBMD keeps increasing across the entire range of ages, whereas the MT value in the 23-week group does not increase. This MT trend is consistent with literature reports [29]. Figure 3(c) shows that the mean carbonate to phosphate band-area ratio in the Raman spectra (normalized to 1 at week 4) increased significantly in the 23-week-old mice (p<0.01 in t tests between 23-week group and any other group) while the groups with ages from 4-week to 16-week are comparable to each other. There are different chemical trends that affect MT in this mouse population as a function of age. As juvenile mice grow from 4 to 20 weeks old, the total mineral content in the tibiae increases, which tends to elevate MT. Once the mice are mature, however, this increase halts, but carbonate substitution (for phosphate) is now observed, which tends to reduce MT. This supports the suggestion made in the Methods section above, that age-range-specific PLSR models might work better in predicting MT due to the different age-related chemical trends.
Fig. 3.
(a) Tibial aBMD as a function of mouse age. (b) Same for MT. (c) Same for carbonate to phosphate peak area ratio (CTPR). CTPR values are normalized to the mean band-area ratio of the 4-week-old group. Error bars represent the standard error of the mean.
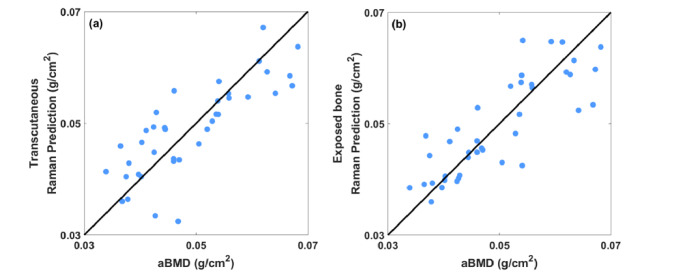
Figure 4 shows predictions of aBMD stemming from regressions of transcutaneous (a) and exposed bone (b) Raman spectra against reference values from DXA. Both plots show significant correlation between the measured and predicted aBMD (p<0.0001 for both, Pearson’s test [30]). The RMSECV of the transcutaneous predictions is about 17% larger than that of exposed bone (0.007 versus 0.006 g/cm2). The accuracy of each prediction is quantified in Table 1. The most common PLS model ranks selected during the LOOCV process are included in Table 2.
Fig. 4.
(a) Correlation between predicted aBMD based on PLSR of Raman spectra measured transcutaneously on live mice and that of the reference obtained by DXA. (b) Correlation between predicted aBMD based on PLSR of Raman spectra measured on exposed bone and that of the reference obtained by DXA.
Table 1. Accuracy of bone quality prediction using Raman spectra as predictor.
| Bone property | Transcutaneous | Exposed | ||||
|---|---|---|---|---|---|---|
| RMSECV | r2 | p | RMSECV | r2 | p | |
| aBMD (g/cm2) | 0.007 | 0.53 | <0.0001 | 0.006 | 0.68 | <0.0001 |
| vBMD (mg HA/ccm) | 35.7 | 0.82 | <0.0001 | 29.7 | 0.87 | <0.0001 |
| MT (N∙mm) | 2.7 | 0.48 | <0.0001 | 3.3 | 0.21 | 0.003 |
Table 2. Typical ranks used in PLSR models for different predictions.
| Bone property | Transcutaneous | Exposed |
|---|---|---|
| aBMD | 5 | 4 |
| vBMD | 7, 8 | 12 |
| MT | 5 | 5 |
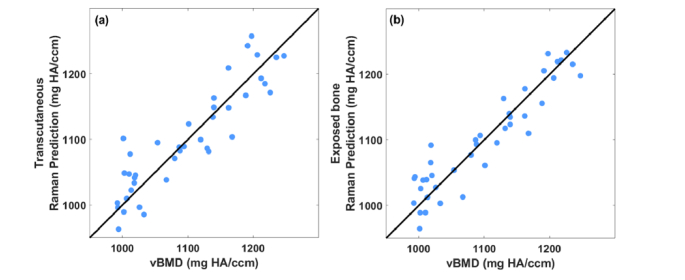
Figure 5 shows corresponding scatter plots for Raman-based prediction of vBMD versus reference values from micro-CT. Again, both plots show significant correlation between the measured and predicted vBMD (p<0.0001). The RMSECV generated from transcutaneous measurement is 20% larger than that of exposed bone (35.7 versus 29.7 mg HA/ccm). The accuracy of each prediction is quantified in Table 1. The typical ranks used in PLSR models are included in Table 2.
Fig. 5.
(a) Correlation between predicted vBMD based on PLSR of Raman spectra measured transcutaneously on live mice and that of the reference obtained by microCT. (b) Correlation between predicted vBMD based on PLSR of Raman spectra measured on exposed bone and that of the reference obtained by microCT.
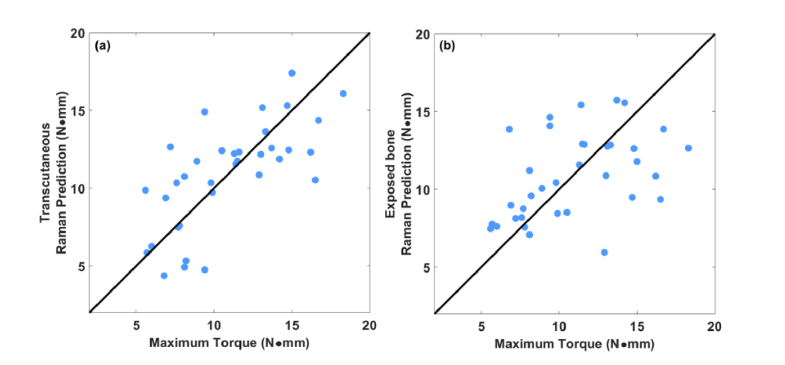
Figure 6 shows the corresponding scatter plots for Raman predictions of MT versus reference values from the torsion test. The transcutaneous and exposed-bone plots both show significant correlation between the measured and predicted MT (p<0.0001). The RMSECV generated from transcutaneous measurement is 18% smaller than that of exposed bone (2.7 versus 3.3 N∙mm). These results are summarized in Table 1. The typical ranks used in PLSR models are included in Table 2. Within Fig. 6, we noticed that the MT predictions for the 23-week-old subgroup showed no significant correlation with reference values. As noted above, this was anticipated based upon chemical effects that only appeared in this age range. When a separate leave-one-out regression was performed that excluded the 23-week-old mice, the RMSECV was lower (2.2 versus 2.7 N∙mm).
Fig. 6.
(a) Correlation between predicted MT based on PLSR of Raman spectra measured transcutaneously on live mice and that of the reference obtained by bone torsion test. (b) Correlation between predicted MT based on PLSR of Raman spectra measured on exposed bone and that of the reference obtained by bone torsion test.
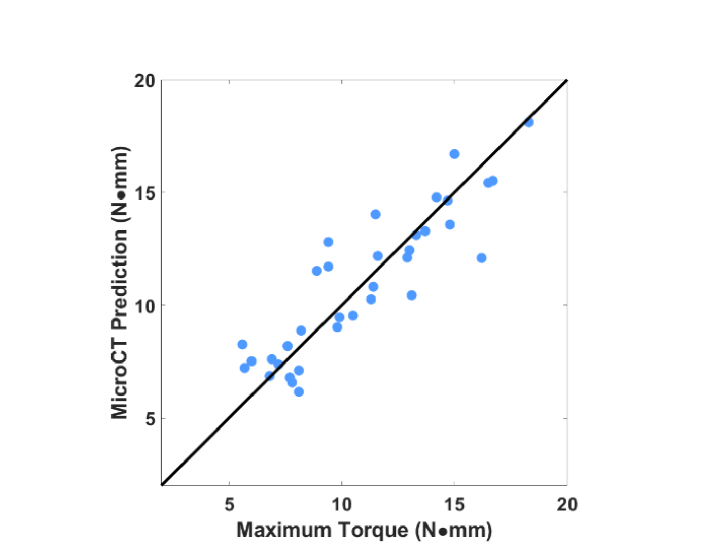
Like Raman spectroscopy, microCT also provides a vector of numbers related to the region of inspection. For comparison with Raman spectroscopy, a separate regression was performed to predict MT using not Raman spectra but instead four parameters derived from the microCT measurement (bone area, tissue area, vBMD, and cortical thickness) [8]. The scatter plot is shown in Fig. 7. The RMSECV is 1.5 N∙mm (r2 = 0.89, p<0.0001), as compared to 2.5 for the transcutaneous Raman spectra. However, different from the Raman case, regression excluding the 23-week group to predict younger mice led to worse performance (RMSECV = 1.8 N∙mm).
Fig. 7.
Correlation between predicted MT based on PLSR of multiple microCT values (bone area, tissue area, vBMD, cortical thickness) and that of the reference obtained by torsion test.
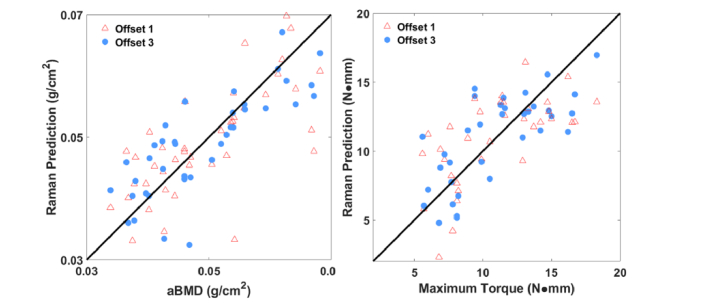
To highlight the influence of the spatial offset, we compared predictions when Raman spectra from ring 1 were used instead of those from ring 3. Figure 8 shows the results. The two rings predicted aBMD values equivalently (r2 = 0.50 for ring 1 versus 0.53 for ring 3), but the correlation with measured MT values was much worse for ring 1 (0.19 versus 0.53).
Fig. 8.
(a) Correlation between predicted aBMD based on PLSR of Raman spectra from ring 1 (marked by red triangles) compared with ring 3 (marked with blue circles) measured transcutaneously on live mice and that of the reference obtained by DXA. Correlation coefficients were similar for the two offsets. (b) Correlation between predicted MT based on PLSR of Raman spectra from ring 1 (marked by red triangles) compared with ring 3 (marked with blue circles) measured transcutaneously on live mice and that of the reference obtained by torsion test. In this case, the correlation was noticeably stronger for the larger offset (r2 = 0.53 versus 0.19).
The goal of this study was to investigate the feasibility of using SORS in vivo for prediction of bone quality. Our results have demonstrated that although the Raman spectra acquired transcutaneously from tibiae in live mice contain signal from overlying soft tissue, the Raman-predicted bone quality metrics of aBMD, vBMD, and MT show strong correlation with DXA, microCT and torsion test measured values. Moreover, in vivo transcutaneous measurements show comparable performance (less than 20% difference in RMSECV for all three parameters) to measurements of exposed bones ex vivo. The results indicate the applicability of SORS for in vivo bone assessment.
In addition, Raman spectroscopy has an advantage over X-ray methods as a noninvasive estimate of bone strength because it is sensitive to chemicals other than minerals. As Fig. 3 indicates, mineral density increased steadily with age across all mice, but the increase of maximum torque halted between 12 and 23 weeks of age. The relationship of maximum torque to bone mineral density therefore has a complicated dependence that changes with age. As Fig. 7 shows, when four micro-CT parameters are used, regressions to predict MT are better than when Raman spectroscopy alone is used (RMSECV of 1.5 vs. 2.5 N∙mm). Since Raman spectroscopy can sense different types of minerals (phosphate versus carbonate) as well as Type I collagen, Raman combined with CT may add extra information about bone quality and could potentially produce the most accurate predictions.
The comparison of spatial offsets in Fig. 8 showed that the greater offset of Ring 3 led to more accurate predictions of MT, but no improvement in aBMD. This discrepancy is probably because the overlying soft tissue’s Raman spectrum is dominated by Type I collagen and contains no phosphate or carbonate peaks. As such, the reduced soft tissue contribution at larger offset should have no influence upon the estimation of aBMD, which is a mineral-specific parameter. Maximum torque, however, depends partly upon the ratio of mineral to matrix in the bone itself. The collagen signal from soft tissue affects the measured ratio of mineral to Type I collagen and thus obscures the true ratio in the bone alone, making MT prediction more difficult. Reducing the soft tissue’s collagen signature in the Ring 3 spectra reduced this obscuration, presumably leading to the more accurate predictions that were observed at this greater offset. Although Ring 3 maximized the signal contribution from bones, spectra from Ring 3 are still a composite of all layers and thus the influence of soft tissue is not eliminated. If spectral contributions from soft tissue were further suppressed by post-processing methods, such as band-targeted entropy minimization [31] or simultaneous overconstrained library-based decomposition [18], potentially the accuracy could be increased further.
Changes in the chemometric modeling might also improve the accuracy of our approach. This is especially true for MT, because it has a more complex dependence upon chemical composition than aBMD and vBMD. As noted above, in this study we explored separate regressions to predict MT for different age groups (4-12 weeks and 23 weeks) because of the changing relationship between MT and relative carbonate concentration at different ages (see Fig. 3). We expected that linear regression methods such as PLS might have trouble building a robust model for direct prediction of MT under those conditions. Indeed, regression using one PLSR model for all the mice resulted in a higher RMSECV (2.7 instead of 2.2 N∙mm). As a result of having to split the mice into two groups, the regression for the 23-week group suffered from the small sample size (eight total mice), leading to uncorrelated predictions within this group. While this could be mitigated by obtaining more data from older mice, a nonlinear regression method might help to generate a more accurate single prediction model in the future.
It is also possible that uncertainties in the reference MT measurement (i.e. the torsion test) are a limiting factor in the Raman prediction accuracy. Although the tibiae were cemented with the same length exposed, the shapes of the tibiae from mice of different ages were different, e.g. the tibiae from older mice were straighter than younger ones. This may influence the consistency of testing among all groups. In future work, the accuracy and reproducibility of the torsion test could be explored using synthetically engineered samples whose properties are nominally identical.
This study is the first to demonstrate the ability of transcutaneous in vivo Raman spectroscopy to predict anatomical and biomechanical bone properties in mice as measured by microCT, DXA, and torsion tests. The data presented here examined mice from a range of ages. Interesting future directions would be applying SORS to monitor bone change during osteoporosis development longitudinally and bone recovery after clinical treatment.
4. Conclusions
To summarize, this study suggests that Raman spectroscopy can be used to non-invasively and accurately predict the strength of mouse bones in vivo. To our knowledge, this is the first report of Raman spectroscopy producing estimates of maximum torque in vivo that correlate significantly with reference measurements. The data in this study support the potential of Raman spectroscopy for the investigation of bone quality.
Acknowledgments
We would like to thank Ms. Emma Gira for her help with harvesting tibiae from mice and Mr. Michael Thullen for his assistance with microCT analysis.
Funding
National Institutes of Health (NIH) (Grant No. R01 AR070613 and R21 AR061285).
Disclosures
The authors declare that there are no conflicts of interest related to this article.
References
- 1.Burge R., Dawson-Hughes B., Solomon D. H., Wong J. B., King A., Tosteson A., “Incidence and economic burden of osteoporosis-related fractures in the United States, 2005-2025,” J. Bone Miner. Res. 22(3), 465–475 (2007). 10.1359/jbmr.061113 [DOI] [PubMed] [Google Scholar]
- 2.Blake G. M., Fogelman I., “The role of DXA bone density scans in the diagnosis and treatment of osteoporosis,” Postgrad. Med. J. 83(982), 509–517 (2007). 10.1136/pgmj.2007.057505 [DOI] [PMC free article] [PubMed] [Google Scholar]
- 3.Trémollieres F. A., Pouillès J.-M., Drewniak N., Laparra J., Ribot C. A., Dargent-Molina P., “Fracture risk prediction using BMD and clinical risk factors in early postmenopausal women: sensitivity of the WHO FRAX tool,” J. Bone Miner. Res. 25(5), 1002–1009 (2010). 10.1002/jbmr.12 [DOI] [PMC free article] [PubMed] [Google Scholar]
- 4.Buie H. R., Campbell G. M., Klinck R. J., MacNeil J. A., Boyd S. K., “Automatic segmentation of cortical and trabecular compartments based on a dual threshold technique for in vivo micro-CT bone analysis,” Bone 41(4), 505–515 (2007). 10.1016/j.bone.2007.07.007 [DOI] [PubMed] [Google Scholar]
- 5.Damilakis J., Adams J. E., Guglielmi G., Link T. M., “Radiation exposure in X-ray-based imaging techniques used in osteoporosis,” Eur. Radiol. 20(11), 2707–2714 (2010). 10.1007/s00330-010-1845-0 [DOI] [PMC free article] [PubMed] [Google Scholar]
- 6.Hong J., Hipp J. A., Mulkern R. V., Jaramillo D., Snyder B. D., “Magnetic Resonance Imaging Measurements of Bone Density and Cross-Sectional Geometry,” Calcif. Tissue Int. 66(1), 74–78 (2000). 10.1007/s002230050015 [DOI] [PubMed] [Google Scholar]
- 7.Gallant M. A., Brown D. M., Organ J. M., Allen M. R., Burr D. B., “Reference-point indentation correlates with bone toughness assessed using whole-bone traditional mechanical testing,” Bone 53(1), 301–305 (2013). 10.1016/j.bone.2012.12.015 [DOI] [PMC free article] [PubMed] [Google Scholar]
- 8.Maher J. R., Takahata M., Awad H. A., Berger A. J., “Raman spectroscopy detects deterioration in biomechanical properties of bone in a glucocorticoid-treated mouse model of rheumatoid arthritis,” J. Biomed. Opt. 16(8), 087012 (2011). 10.1117/1.3613933 [DOI] [PMC free article] [PubMed] [Google Scholar]
- 9.Morris M. D., Mandair G. S., “Raman assessment of bone quality,” Clin. Orthop. Relat. Res. 469(8), 2160–2169 (2011). 10.1007/s11999-010-1692-y [DOI] [PMC free article] [PubMed] [Google Scholar]
- 10.Makowski A. J., Granke M., Ayala O. D., Uppuganti S., Mahadevan-Jansen A., Nyman J. S., “Applying Full Spectrum Analysis to a Raman Spectroscopic Assessment of Fracture Toughness of Human Cortical Bone,” Appl. Spectrosc. 71(10), 2385–2394 (2017). 10.1177/0003702817718149 [DOI] [PMC free article] [PubMed] [Google Scholar]
- 11.Inzana J. A., Maher J. R., Takahata M., Schwarz E. M., Berger A. J., Awad H. A., “Bone fragility beyond strength and mineral density: Raman spectroscopy predicts femoral fracture toughness in a murine model of rheumatoid arthritis,” J. Biomech. 46(4), 723–730 (2013). 10.1016/j.jbiomech.2012.11.039 [DOI] [PMC free article] [PubMed] [Google Scholar]
- 12.Raghavan M., Sahar N. D., Kohn D. H., Morris M. D., “Age-specific profiles of tissue-level composition and mechanical properties in murine cortical bone,” Bone 50(4), 942–953 (2012). 10.1016/j.bone.2011.12.026 [DOI] [PMC free article] [PubMed] [Google Scholar]
- 13.Beier E. E., Maher J. R., Sheu T.-J., Cory-Slechta D. A., Berger A. J., Zuscik M. J., Puzas J. E., “Heavy metal lead exposure, osteoporotic-like phenotype in an animal model, and depression of WNT signaling,” Environ. Health Perspect. 121(1), 97–104 (2013). [DOI] [PMC free article] [PubMed] [Google Scholar]
- 14.Ager J. W., Nalla R. K., Breeden K. L., Ritchie R. O., “Deep-ultraviolet Raman spectroscopy study of the effect of aging on human cortical bone,” J. Biomed. Opt. 10(3), 034012 (2005). 10.1117/1.1924668 [DOI] [PubMed] [Google Scholar]
- 15.Firbank M., Hiraoka M., Essenpreis M., Delpy D. T., “Measurement of the optical properties of the skull in the wavelength range 650-950 nm,” Phys. Med. Biol. 38(4), 503–510 (1993). 10.1088/0031-9155/38/4/002 [DOI] [PubMed] [Google Scholar]
- 16.Matousek P., Clark I. P., Draper E. R. C., Morris M. D., Goodship A. E., Everall N., Towrie M., Finney W. F., Parker A. W., “Subsurface probing in diffusely scattering media using spatially offset Raman spectroscopy,” Appl. Spectrosc. 59(4), 393–400 (2005). 10.1366/0003702053641450 [DOI] [PubMed] [Google Scholar]
- 17.Schulmerich M. V., Cole J. H., Kreider J. M., Esmonde-White F., Dooley K. A., Goldstein S. A., Morris M. D., “Transcutaneous Raman spectroscopy of murine bone in vivo,” Appl. Spectrosc. 63(3), 286–295 (2009). 10.1366/000370209787599013 [DOI] [PMC free article] [PubMed] [Google Scholar]
- 18.Maher J. R., Inzana J. A., Awad H. A., Berger A. J., “Overconstrained library-based fitting method reveals age- and disease-related differences in transcutaneous Raman spectra of murine bones,” J. Biomed. Opt. 18(7), 077001 (2013). 10.1117/1.JBO.18.7.077001 [DOI] [PMC free article] [PubMed] [Google Scholar]
- 19.Sowoidnich K., Churchwell J. H., Buckley K., Goodship A. E., Parker A. W., Matousek P., “Spatially offset Raman spectroscopy for photon migration studies in bones with different mineralization levels,” Analyst (Lond.) 142(17), 3219–3226 (2017). 10.1039/C7AN00408G [DOI] [PubMed] [Google Scholar]
- 20.Feng G., Ochoa M., Maher J. R., Awad H. A., Berger A. J., “Sensitivity of spatially offset Raman spectroscopy (SORS) to subcortical bone tissue,” J. Biophotonics 10(8), 990–996 (2017). 10.1002/jbio.201600317 [DOI] [PMC free article] [PubMed] [Google Scholar]
- 21.Buckley K., Kerns J. G., Vinton J., Gikas P. D., Smith C., Parker A. W., Matousek P., Goodship A. E., “Towards the in vivo prediction of fragility fractures with Raman spectroscopy,” J. Raman Spectrosc. 46(7), 610–618 (2015). 10.1002/jrs.4706 [DOI] [PMC free article] [PubMed] [Google Scholar]
- 22.Zhang Z.-M., Chen S., Liang Y.-Z., Liu Z.-X., Zhang Q.-M., Ding L.-X., Ye F., Zhou H., “An intelligent background-correction algorithm for highly fluorescent samples in Raman spectroscopy,” J. Raman Spectrosc. 41(6), 659–669 (2010). 10.1002/jrs.2500 [DOI] [Google Scholar]
- 23.Savitzky A., Golay M. J. E., “Smoothing and differentiation of data by simplified least squares procedures,” Anal. Chem. 36(8), 1627–1639 (1964). 10.1021/ac60214a047 [DOI] [Google Scholar]
- 24.Beamer W. G., Shultz K. L., Coombs H. F., 3rd, DeMambro V. E., Reinholdt L. G., Ackert-Bicknell C. L., Canalis E., Rosen C. J., Donahue L. R., “BMD regulation on mouse distal chromosome 1, candidate genes, and response to ovariectomy or dietary fat,” J. Bone Miner. Res. 26(1), 88–99 (2011). 10.1002/jbmr.200 [DOI] [PMC free article] [PubMed] [Google Scholar]
- 25.Silva M. J., Brodt M. D., Wopenka B., Thomopoulos S., Williams D., Wassen M. H., Ko M., Kusano N., Bank R. A., “Decreased collagen organization and content are associated with reduced strength of demineralized and intact bone in the SAMP6 Mouse,” J. Bone Miner. Res. 21(1), 78–88 (2006). 10.1359/JBMR.050909 [DOI] [PubMed] [Google Scholar]
- 26.Haaland D. M., Thomas E. V., “Partial least-squares methods for spectral analyses. 1. Relation to other quantitative calibration methods and the extraction of qualitative information,” Anal. Chem. 60(11), 1193–1202 (1988). 10.1021/ac00162a020 [DOI] [Google Scholar]
- 27.Qi D., Berger A. J., “Chemical concentration measurement in blood serum and urine samples using liquid-core optical fiber Raman spectroscopy,” Appl. Opt. 46(10), 1726–1734 (2007). 10.1364/AO.46.001726 [DOI] [PubMed] [Google Scholar]
- 28.Penel G., Delfosse C., Descamps M., Leroy G., “Composition of bone and apatitic biomaterials as revealed by intravital Raman microspectroscopy,” Bone 36(5), 893–901 (2005). 10.1016/j.bone.2005.02.012 [DOI] [PubMed] [Google Scholar]
- 29.Brodt M. D., Ellis C. B., Silva M. J., “Growing C57Bl/6 mice increase whole bone mechanical properties by increasing geometric and material properties,” J. Bone Miner. Res. 14(12), 2159–2166 (1999). 10.1359/jbmr.1999.14.12.2159 [DOI] [PubMed] [Google Scholar]
- 30.Pearson K., “X. On the criterion that a given system of deviations from the probable in the case of a correlated system of variables is such that it can be reasonably supposed to have arisen from random sampling,” Lond. Edinb. Dubl. Phil. Mag. 50(302), 157–175 (1900). 10.1080/14786440009463897 [DOI] [Google Scholar]
- 31.Chew W., Widjaja E., Garland M., “Band-Target Entropy Minimization (BTEM): an advanced method for recovering unknown pure component spectra. application to the ftir spectra of unstable organometallic mixtures,” Organometallics 21(9), 1982–1990 (2002). 10.1021/om0108752 [DOI] [Google Scholar]


