Abstract
To achieve full-depth spectral domain optical coherence tomography in the case of strong environmental disturbance, the iterative phase-shifting (IPS) method and modified dispersion-coded (MDC) method are proposed in this work. In IPS, the precise amount of phase shift is retrieved by iteration, and the direction of the phase shift is determined by dispersion compensation. Conjugate mirror items and noise can be simultaneously eliminated by two captured interferograms, whereas only one of them can be removed in the traditional phase-shift method with two interferograms. In MDC, they are removed through dispersion compensation and signal extraction with a single interferogram. Full-depth images of a glass slide, an onion, and a live fish eye are obtained by the two methods. The advantages and disadvantages of each method are analyzed and compared. IPS is found to be more effective for removing conjugate artifacts, whereas MDC is more conducive to real-time imaging. For a 2 mm × 3.6 mm image of a fish eye (200 depth scans and 1200 spectral sampling points per depth scan), the mirror image artifact is reduced by 28.55 dB in MDC and 41.53 dB in IPS. Processing times are 5.1 seconds (20 iterations) for the IPS method and 0.91 seconds for MDC.
1. Introduction
Spectral domain-optical coherence tomography (SD-OCT) is capable of high-resolution, real-time, three-dimensional (3-D) imaging of the internal structures of biological tissues, and is currently an important tool for biological tissue imaging [1,2]. However, only half of the available depth range can be used for imaging in standard SD-OCT systems, otherwise complex conjugate mirror items overlap with sample structures. To overcome this problem, several full-range techniques have been proposed, which follow two categories: phase modulation methods [3–5] and dispersion-coded methods [6–8].
At present, there are primarily two categories of phase modulation methods: (1) the iterative approach based on neighboring A-scans [3,9–11] and (2) using a Fourier transform along the transversal scan direction [5,12,13]. For approach (1), Wojtkowski proposed the application of five-step phase-shifting theory to SD-OCT and obtained full-depth eye images with high signal-to-noise ratio (SNR) [3], which laid the foundation for other groups to achieve full-depth imaging; however, this method greatly increases the imaging time. Therefore, the arbitrary three-step phase-shifting algorithm [10] and two-step phase-shifting method [11] are used to reduce the imaging time. To reduce imaging time further, some of the techniques obtain interferograms with different phase shifts simultaneously by other methods, such as the use of a 3 × 3 coupler [14,15], or using a dual-channel spectrometer [16], or via optical polarization demodulation [17]. However, such methods increase the complexity of the system.
In approach (2), a certain parameter is modulated to achieve modulation of the phase, and finally to remove the conjugate signal by two Fourier transforms. The linear B-M-mode scanning method proposed by Yasuno is commonly used [5]. This method requires only a single A-scan for each single transversal position to obtain a full-range image. Although this method decreases the imaging time, it limits the scanning range. Because in the B-M method, the lateral sampling step needs to be much smaller than the beam size to suppress the conjugate term, and the best phase shift step is π/2 [18]. Therefore, when the transverse scanning range is large, a large cumulative optical path difference between the reference arm and the sample arm will result in a decrease in SNR of the image along the transverse scanning direction. To solve this problem, other modulation methods such as sinusoidal phase modulation are used [12]. However, the B-M method requires two Fourier transforms, which increases the amount of calculation; therefore, a convolution method is proposed to reduce the computational cost [13]. Based on principles of approach (2), several other methods have been proposed successively, such as increasing the beam offset at the beam-scanning mirror [18,19], moving the grating, acousto-optic modulation [20], and electro-optic modulation [21], etc.
The dispersion-coded method is an iterative reconstruction method that utilizes the dispersive spreading of mirror terms to suppress complex conjugate terms in individual depth scans [7,22]. This technique is inherently phase-stable, whereas phase modulation methods require the phase to be stable. However, the computational complexity of the dispersion-coded method is higher. To solve the computational burden, Witte et al. proposed removing signal peaks at one time by increasing the system dispersion, finally removing the conjugate signals. However, it was not easy to correctly determine the position of all signals [23].
In this study, we mainly focus on situations with strong environmental disturbance. Under such conditions, the phase is unstable, so the traditional phase modulation methods cannot be used. Consequently, we propose the iterative phase-shifting (IPS) method and modified dispersion-coded (MDC) method to achieve full-depth SD-OCT in situations of large environmental disturbance. In the IPS method, the amount of phase-shift is accurately obtained by iteration, which can eliminate the effect of inaccurate phase-shift. In the IPS, conjugate mirror items and noise are simultaneously removed with two interferograms. In addition, this work also analyzes the MDC method, and the advantages and disadvantages of the two methods are analyzed and compared. The findings demonstrate that IPS more accurately removes conjugate artifacts, whereas the MDC method provides a shorter processing time. Full-depth images of a glass slide, an onion, and a live fish eye are obtained via these two methods.
2. Theories and methods
2.1 Iterative phase-shifting method
In SD-OCT, when the system dispersion can be ignored, the interference signal of the lateral position x can be expressed as [24]
| (1) |
where is the power spectrum function of the light source, is the amplitude of the reflected light from the reference arm, is the amplitude of scattered light from the sample at depth z, k is the wave number, and n is the average refractive index of the sample. After the background signal is removed [6], the spectral signal is
| (2) |
To eliminate the conjugate term, in the traditional phase-shifting method, the phase of the interferogram is shifted by moving the reference mirror over a distance, i.e.
| (3) |
Then the unwanted items of Eq. (2) can be excluded by performing a subtraction operation:
| (4) |
However, in cases of strong environmental fluctuation, the actual phase-shift is not equal to the expected phase-shift, and thus the conjugate signal cannot be eliminated. To solve this problem, we use iteration to obtain the actual phase-shift. Because of the periodicity of the cosine function, the iteration range only needs to be [0, 2π]. According to Eq. (4), different A-scans have different phase-shifts , resulting in different amplitude variations for different A-scan signals. Therefore, Eq. (4) needs to be divided by a compensation factor .
Since the cosine function is an even function, when , iteration often erroneously removes the real structure signal rather than its conjugated item. For example, if , the desired value of phase-shift after iteration is to eliminate conjugate item. However, the phase-shift value following iteration is usually , which eliminates the real structure signal. To resolve this problem, we use dispersion compensation to avoid eliminating real structure signals. Considering dispersion, the interferogram expressed as Eq. (2) becomes
| (5) |
where is the phase associated with dispersion. After compensating for dispersion, we obtain
| (6) |
The phase correction to compensate for dispersion can be expressed as [7]
| (7) |
where is the wave angle frequency, is the central angle frequency, the coefficient is adjusted to cancel the group velocity dispersion imbalance (second-order term), and is adjusted to cancel the third-order dispersion imbalance (third-order term). Considering dispersion, based on the principle of the phase-shifting method introduced above, if the phase-shift after iteration is , Eq. (4) becomes
| (8) |
and conjugate item is eliminated. However, if the phase-shift after iteration is , Eq. (4) becomes
| (9) |
and real signal is removed, which is undesirable and can be avoided. After applying the inverse Fourier transform for Eq. (8) and Eq. (9), the conjugate signal is broadened due to the dispersion relative to the real signal. In other words, the Q value of the real signal peak is larger than that of the conjugated signal peak, where the Q value is defined as , and i represents the pixel where the peak is located. Therefore, the proposed method avoids removing the real structure signal by checking the Q value of the removed peak during the iteration. That is to say, the direction of the phase-shift can be determined.
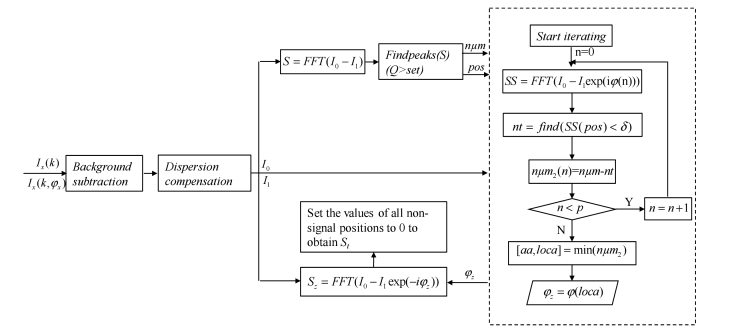
The specific process for implementing the IPS method is shown in Fig. 1. Prior to iteration, background subtraction and dispersion compensation operations are applied to and . After applying the Fourier transform, all signal peaks with Q value greater than the set value set are first found. The number and positions of these peaks are represented by num and pos, respectively. The number num2 of the remaining signal peaks with Q value greater than set is calculated for each during the iteration. After the iteration, the real signal peaks in are completely removed, where corresponds to the minimum num2. In Sz shown in Fig. 1, is used to replace in , such that the conjugate signals are completely removed in Sz. Moreover, all real signal positions can be determined according to the change between the signals S and ; then, the noise is finally removed by setting the values of all non-signal positions to zero, and thus St is eventually obtained.
Fig. 1.
Flowchart showing the IPS procedure. δ is the set threshold, which represents the extent to which the signal peaks can be eliminated, and nt is the number of signals that satisfy condition SS(pos)<δ; n is the iteration variable, and p is the set total number of iterations; aa and loca are the value and position of the minimum value in num2, respectively.
According to the iterative method above, when the values of some signal peaks become minimum, the corresponding phase-shift is . Obviously, through iteration, can be obtained with only a single real signal peak; in other words, can be accurately retrieved as long as . Consequently, the IPS method is effective in most biological tissues, because the signal from the boundary of the tissue often presents a strong signal peak.
2.2 Modified dispersion-coded method
The dispersion-coded method in this work uses the technology described in [23], with some modifications. The specific implementation process of the MDC is shown in Fig. 2.
Fig. 2.
Flowchart showing the MDC procedure; set is the preset threshold. I0 is the signal corresponding to Eq. (6).
According to Eq. (6), after numerical dispersion compensation and Fourier transform, the signal peaks of Sb will be free of phase errors, while the mirror image artifact will be broadened. Strong suppression of the mirror image artifact can be achieved by implementing a large dispersion imbalance. In this case, the real signal peak corresponding to an individual scatterer is localized in a few pixels in z-space, while its mirror image is distributed over a large part of the z-axis. That is, the Q value of the real signal peak is relatively large. Through identifying this narrow peak and setting these few z-pixels to zero, the real signal peak is effectively removed, leaving only its broad mirror image and noise [23]. In this process, the real signal peak is determined using its Q value, and the peak whose Q value is greater than the preset threshold set is considered to be the real signal peak. Then, the inverse Fourier transform is not operated as described in [23], but signal Sa, whose narrow signal peaks are removed, is directly subtracted from the signal Sb to obtain the final signal S without noise and conjugate terms.
3. Simulation
To demonstrate the two algorithms, we explore a simple simulated sample consisting of two reflective sites, e.g., originating from a glass plate.
In the simulation, the discrete wave number is , number of sampling points is 800, and dispersion coefficients are and . With two pulses, positioned at depth of 1000 μm, and positioned at depth of −600 μm. The detected interference spectrum can be expressed as:
where w is zero-mean white Gaussian noise corresponding to a noise floor of −20dB and pu is a Gaussian window with expected value of 2π/0.79 and variance of 0.0289. The full width at half maximum (FWHM) of this Gaussian distribution corresponds to the light source with 40 nm FWHM.
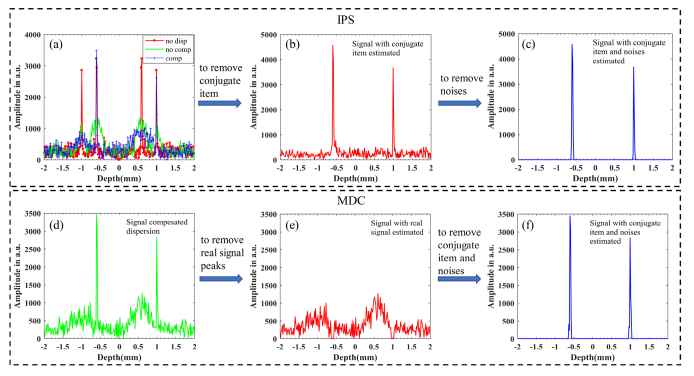
For the IPS, the phase-shift between the two interferograms is . The iteration range is [0, 2π] with an interval of 0.01π. The simulation results are shown in Fig. 3. The red line in Fig. 3(a) is the structure signal without dispersion, the width of which is determined by the bandwidth of the light source and there is no broadening; The green line in Fig. 3(a) is the structure signal broadened due to uncompensated dispersion; The blue line in Fig. 3(a) is the signal that has been compensated for dispersion. The results in Fig. 3(a) show that the real structure signal is enhanced and not broadened. On the contrary, the conjugate signal is broadened and suppressed; however the conjugate signal is not completely removed. The results in Fig. 3(b) and Fig. 3(c) are obtained using the IPS method, and the iterative solution of phase-shift is 0.50π. The signal in Fig. 3(b) corresponds to Sz introduced in Fig. 1, where conjugated items are removed, while noise still exists. The signal in Fig. 3(c) corresponds to St, in which the conjugated item and noise are removed simultaneously. The results in Figs. 3(d–f) are obtained by the MDC method. The green line in Fig. 3(d) is the same as the blue line in Fig. 3(a), and the red line in Fig. 3(e) is the signal with the real signal peaks removed. The blue line in Fig. 3(f) is the result of subtracting the two signals in Fig. 3(d) and Fig. 3(e), in which both the conjugated signal and the noise are removed.
Fig. 3.
Simulated results for IPS and MDC methods. The red, green, and blue lines in panel (a) are signals without dispersion, with dispersion, and compensated dispersion, respectively; Panel (b) shows the signal corresponding to Sz; (c) is the signal corresponding to St; The signals in (d–f) correspond to Sa, Sb, and S, respectively, in Fig. 2.
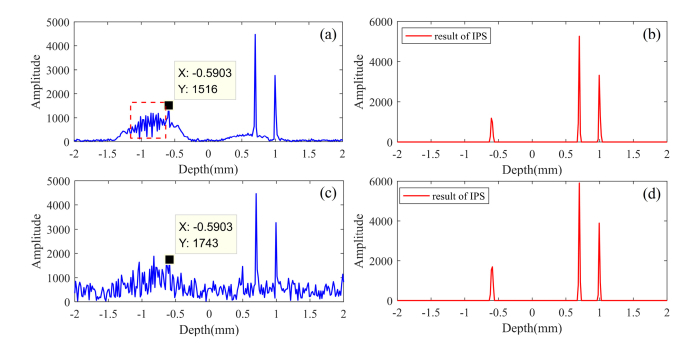
The above results indicate that the MDC method is easier to implement than IPS. However, the signal peaks are directly removed in MDC, so their positions must be determined exactly in order to avoid misjudgment, which is difficult. We perform the other two simulations to verify that IPS is more effective than MDC for removing conjugate signals and noise. Three pulses, positioned at a depth of 1000 μm, positioned at a depth of 700 μm, and positioned at a depth of −600 μm, are used in the simulations. The zero-mean white Gaussian noise w in the two simulations corresponds to noise floors of −5 dB and −25 dB, respectively. The results are shown in Fig. 4.
Fig. 4.
Panels (a) and (c) show signals that have been compensated for dispersion with noise floors of −5 dB and −25 dB, respectively; (b) and (d) are the results of the IPS method in these two situations.
Figure 4(a) and Fig. 4(b) show simulation results with noise floors of −5 dB, and Figs. 4(c) and (d) show results with noise floor of −25 dB. The blue line in Fig. 4(a) is the signal that has been compensated for dispersion, and the generation of these interference peaks in the red-dotted box is due to the interference between the two conjugate items with dispersion of the two pulses g1 and g2. It is obvious that these peaks can be recognized as real structure signals in the MDC method, whereas this misjudgment does not exist in the IPS method. Because the phase-shift in IPS can be determined by the real signal peaks g1 and g2 based on the principle of IPS introduced above. The result of IPS is shown in Fig. 4(b), showing accurate removal of conjugate signals and noise. In Fig. 4(c), the noise floor is almost at the same level as the signal peak g3; therefore, the signal peak g3 is difficult to identify directly in the MDC method. In contrast, the IPS method can find the position of signals well, as shown in Fig. 4(d). In Fig. 4, the results of MDC are not given because it is obvious that misjudgment will exist.
The analysis and simulation results above show that although IPS requires iteration, it is more effective than MDC. By contrast, because MDC does not require iteration, the imaging process is faster.
4. Experimental system
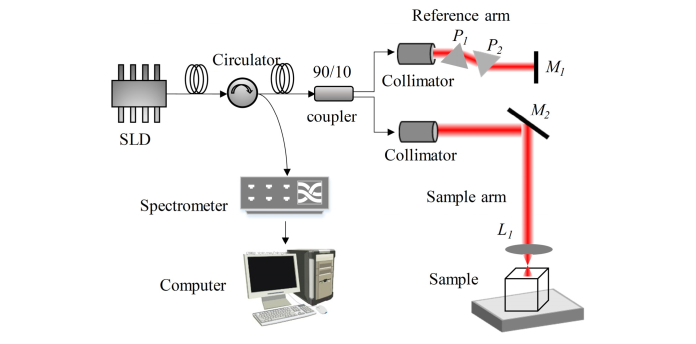
The experimental SD-OCT system is shown in the schematic in Fig. 5. A super-luminescent diode (SLD-331, Superlum Ltd, Russia) is used as the illumination light source. The center wavelength of the light source is 790 nm and the bandwidth is approximately 45 nm. The output light is divided by a fiber coupler into the reference beam and the sample beam. The reference light is reflected from the surface of a mirror. A pair of prisms (H-ZF13) is placed in the reference arm to increase the dispersion of the system. The sample light is finally reflected from the sample through a lens (f = 30 mm). The reflected reference light and the reflected sample light are recombined in the fiber coupler, and then the interference fringes are detected by a spectrometer (Maya 2000 Pro, Ocean Optics) with spectral resolution of 0.05 nm. The depth resolution and lateral resolution of the system are 9 μm and 10 μm, respectively. In this work, the phase shift is achieved by moving the mirror M1 of the reference arm. The mirror M1 is placed on a high-precision nano-positioning stage (P752, PI, Germany) with a resolution of 0.1 nm.
Fig. 5.
Schematic of the SD-OCT system. P1 and P2: a pair of prisms; L1: achromatic lens (f = 30 mm); M1 and M2: mirrors.
5. Results and discussion
Experiments were conducted on a non-isolated platform and in a non-clean lab, which is consistent with the environment of most practical applications. Environmental disturbance is very serious in this case, as shown in Fig. 6.
Fig. 6.
Spectral signal of plane mirror (a) and fluctuation of light intensity at specific k (b).
The red line in Fig. 6(a) is the interference signal when the sample is a plane mirror. The blue line in Fig. 6(b) is the light intensity of the measured signal at the position k = 7.933 μm−1 indicated in Fig. 6(a). The number of measurements is 2000, and interval time of each measurement is 8 ms. The results show that the environmental perturbations cause the interference signal to have a large phase-drift, but the amplitude of the signal does not change significantly. Therefore, exploring full-depth SD-OCT technology that is insensitive to phase disturbance is necessary and meaningful.
5.1 Experiment results for a glass slide
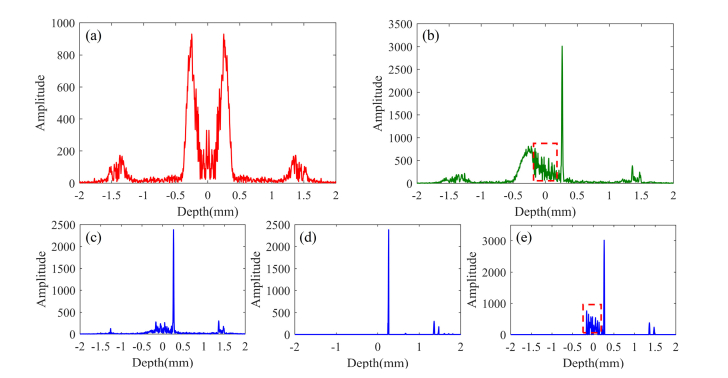
To validate the IPS and MDC algorithms, imaging data for a glass slide are acquired by the SD-OCT system, and the results are shown in Fig. 7. The effect of dispersion on the width of the signal is shown in Fig. 7(a), where no numerical dispersion compensation is performed, and dispersion is clearly seen to increase the width of the peaks. By the iteration method [6], the dispersion compensation coefficients are obtained:. The signal following numerical dispersion compensation is shown in Fig. 7(b). This procedure retrieves a real signal peak with an axial width limited by the light source bandwidth. The mirror image artifact is seen to broaden. Figure 7(c) and Fig. 7(d) are results for the IPS method. Figure 7(c) is the signal corresponding to Sz, in which the conjugate term is removed. Figure 7(d) is the signal corresponding to St, where the noise is removed. The line seen in Fig. 7(e) is the result of the MDC method, which shows that the peaks in the red-dashed box in Fig. 7(b) are mistaken as signal peaks. However, there is no such misjudgment in the IPS method.
Fig. 7.
Experiment results for a glass slide. (a) Signal without dispersion compensation; (b) Signal with dispersion compensation; (c) Signal corresponding to Sz in IPS; (d) Signal corresponding to St in IPS; (e) Result of MDC.
5.2 Experiment results for an onion
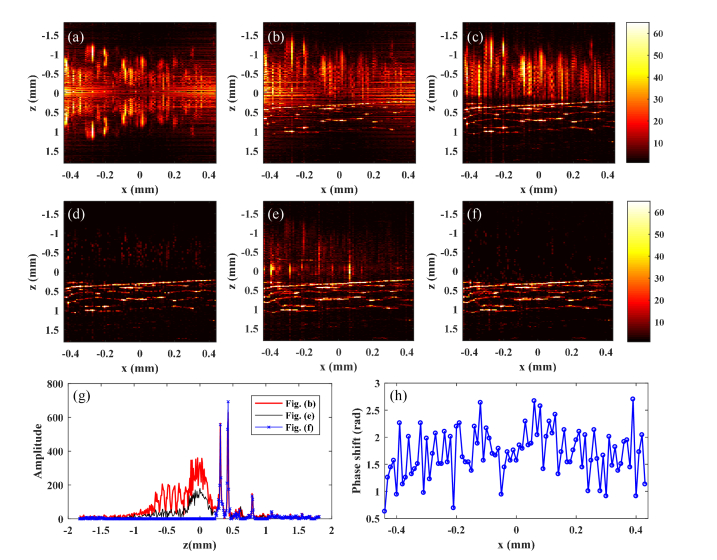
The applicability to tissue imaging is investigated by using an onion and a fish eye. Onion tissue is composed of many strongly reflective surfaces, so its structural signal is composed of many sparse peaks, whereas only the surface of fish eye has a clear signal peak. Therefore, they represent the structural characteristics of most tissues. The results of an onion are as illustrated in Fig. 8. In order to make the effect of each step of the IPS and MDC methods clearer, the position of zero optical path difference is placed outside the onion tissue.
Fig. 8.
Experiment results using an onion. (a) Image without dispersion compensation; (b) Image with dispersion compensation; (c) Image following subtraction applied to the two captured interferograms; (d) Results of MDC corresponding to (c); (e) Image corresponding to Sz in IPS; (f) Image corresponding to St in IPS; (g) Signals at x = 160 μm in (b), (e), and (f); (h) Iterative phase shift value of each x point in IPS.
The dispersion compensation coefficients are obtained:. Figure 8(a) and Fig. 8(b) are the images before and after dispersion compensation respectively. The two figures are the results after removing the background signal; however, background removal is not ideal, which introduces difficulties for the MDC algorithms to accurately determine the positions of the signal peaks. Figure 8(c) is the inverted result after the subtraction applied to the two captured interferograms (), in which the background noise is well removed. The result of MDC applied to the interferogram corresponding to Fig. 8(c) is as shown in Fig. 8(d). Figure 8(e) and Fig. 8(f) are the results for IPS, corresponding to signals Sz and St, respectively, introduced in Fig. 1. In Fig. 8(e), the conjugation item is removed, and the noise is further removed in Fig. 8(f). Figure 8(g) shows the processing steps of IPS. The red, black, and blue lines are the signals at x = 160 μm in Figs. 8(b), (e), and (f), respectively. The theorical phase-shift is , and Fig. 8(h) is the iterative phase-shift value of each x point in the IPS method. It can be observed that the interference of the environment on the phase-shift is severe, making IPS necessary and meaningful.
Comparing Fig. 8(d) and Fig. 8(f), we find that the IPS method is more reliable and effective for removing noise and conjugate terms. However, the MDC method does not involve iteration, and so achieves faster processing than the IPS method. The mirror image artifact is reduced by 33.4 dB in the MDC method and by 40.96 dB in IPS, and remaining mirror artifact is −1.4 dB in the MDC method and −8.96 dB in IPS. The duration of standard processing (dispersion compensation) is 0.2 seconds (90 depth scans and 1200 spectral sampling points per depth scan). The processing time for the IPS method is 2.4 seconds (20 iterations), while that of the MDC method is 0.3 seconds.
5.3 Experimental results for a fisheye in vivo
The results of a fish eye are as illustrated in Fig. 9. During the experiment, the goldfish was kept alive by wrapping in wet facial tissue (except for the eye). Drops of fresh water were applied to the fish eye every minute to prevent its dehydration. The dispersion compensation coefficients are obtained: .
Fig. 9.
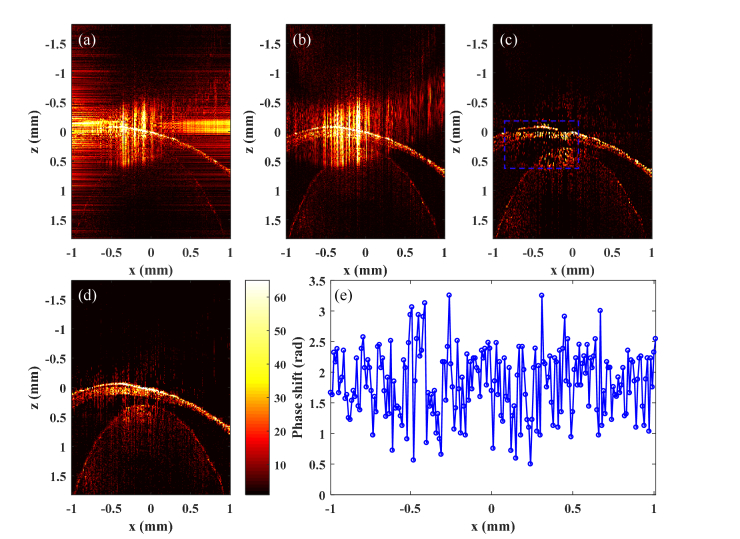
Experimental results using a fish eye in vivo. (a) Image with dispersion compensation; (b) Image following subtraction applied to the two captured interferograms; (c) Results of MDC corresponding to (b); (d) Results of IPS; (e) Iterative phase shift value of each x point in IPS.
To demonstrate the true full-range SD-OCT, we shift the z = 0 position to a plane inside the sample, leading to an overlap between the real image and complex conjugate. The images obtained after applying dispersion compensation with one or two interferograms are shown in Fig. 9(a) and Fig. 9(b), respectively. The results show that background removal is ineffective here, so the MDC method is applied to Fig. 9(b). Figure 9(c) and Fig. 9(d) show images from the MDC and IPS methods, respectively. A strong improvement in image contrast can be observed, which results from the strongly suppressed complex conjugate background. The results in Fig. 9 also indicate that IPS is more reliable for removing conjugate signals and noise, whereas many real signal peaks in Fig. 9(c) are erroneously removed in the MDC method, as shown in the blue-dotted box. The mirror image artifact is reduced by 28.55 dB in the MDC method, and by 41.53 dB in IPS, and remaining mirror artifact is −2.93 dB in the MDC method and −15.58 dB in IPS. The processing time for the IPS method is 5.1 seconds (20 iterations), compared with 0.91 seconds for the MDC method. Figure 9(e) is the iterative phase-shift value of each x point in the IPS method, which also show that the interference of the environment on the phase shift is very serious.
6. Conclusion
The iterative phase-shifting method and modified dispersion-coded method are proposed to achieve full-depth SD-OCT in scenarios with large environmental disturbances. For the IPS method, iteration is used to retrieve actual phase-shift. We determine the direction of phase-shift by dispersion compensation, and then remove conjugate mirror items and noise through correct determination of the signal positions. For the MDC method, conjugate mirror items and noise are removed through dispersion compensation and signal extraction by one interferogram. After processing OCT images using the IPS and MDC algorithms, although the noise and conjugate terms are not completely removed, the images of the glass slide, onion, and fish eye in vivo are clearer with greater detail. The results demonstrate that the IPS method provides more accurate removal of conjugate artifacts, while the MDC method provides shorter processing time. For a 2 mm × 3.6 mm image of a fish eye (200 depth scans and 1200 spectral sampling points per depth scan), the mirror image artifact is reduced by 28.55 dB in the MDC method and by 41.53 dB in IPS. The processing time using the IPS method is 5.1 seconds (20 iterations), compared with 0.91 seconds for the MDC method. Theoretically, the MDC method requires only one interferogram, but in the case of strong noise it is better to remove the main background with two interferograms before using MDC. The IPS method has more advantages for imaging complex biological samples with low scattering coefficient. MDC is more suitable for dynamic imaging, but the resulting signal may include some misjudgments.
Disclosures
The authors declare that there are no conflicts of interest related to this article.
References
- 1.Huang D., Swanson E. A., Lin C. P., Schuman J. S., Stinson W. G., Chang W., Hee M. R., Flotte T., Gregory K., Puliafito C. A., “Optical coherence tomography,” Science 254(5035), 1178–1181 (1991). [DOI] [PMC free article] [PubMed] [Google Scholar]
- 2.Chong S. P., Merkle C. W., Leahy C., Radhakrishnan H., Srinivasan V. J., “Quantitative microvascular hemoglobin mapping using visible light spectroscopic Optical Coherence Tomography,” Biomed. Opt. Express 6(4), 1429–1450 (2015). [DOI] [PMC free article] [PubMed] [Google Scholar]
- 3.Wojtkowski M., Kowalczyk A., Leitgeb R., Fercher A. F., “Full range complex spectral optical coherence tomography technique in eye imaging,” Opt. Lett. 27(16), 1415–1417 (2002). [DOI] [PubMed] [Google Scholar]
- 4.Fercher A. F., Leitgeb R., Hitzenberger C. K., Wojtkowski M., “Complex spectral interferometry OCT,” Proc. SPIE 3564, 173–178 (1998). [Google Scholar]
- 5.Yasuno Y., Makita S., Endo T., Aoki G., Itoh M., Yatagai T., “Simultaneous B-M-mode scanning method for real-time full-range Fourier domain optical coherence tomography,” Appl. Opt. 45(8), 1861–1865 (2006). [DOI] [PubMed] [Google Scholar]
- 6.Hofer B., Považay B., Unterhuber A., Wang L., Hermann B., Rey S., Matz G., Drexler W., “Fast dispersion encoded full range optical coherence tomography for retinal imaging at 800 nm and 1060 nm,” Opt. Express 18(5), 4898–4919 (2010). [DOI] [PubMed] [Google Scholar]
- 7.Wojtkowski M., Srinivasan V., Ko T., Fujimoto J., Kowalczyk A., Duker J., “Ultrahigh-resolution, high-speed, Fourier domain optical coherence tomography and methods for dispersion compensation,” Opt. Express 12(11), 2404–2422 (2004). [DOI] [PubMed] [Google Scholar]
- 8.Pan L., Wang X., Li Z., Zhang X., Bu Y., Nan N., Chen Y., Wang X., Dai F., “Depth-dependent dispersion compensation for full-depth OCT image,” Opt. Express 25(9), 10345–10354 (2017). [DOI] [PubMed] [Google Scholar]
- 9.Leitgeb R. A., Hitzenberger C. K., Fercher A. F., Bajraszewski T., “Phase-shifting algorithm to achieve high-speed long-depth-range probing by frequency-domain optical coherence tomography,” Opt. Lett. 28(22), 2201–2203 (2003). [DOI] [PubMed] [Google Scholar]
- 10.Ma Z. H., Wang R. K., Zhang F., Yao Q. J., “Arbitrary three-phase shifting algorithm for achieving full range spectral optical coherence tomography,” Chin. Phys. Lett. 23(2), 366–369 (2006). [Google Scholar]
- 11.Wu C. T., Chi T. T., Kiang Y. W., Yang C. C., “Computation time-saving mirror image suppression method in Fourier-domain optical coherence tomography,” Opt. Express 20(8), 8270–8283 (2012). [DOI] [PubMed] [Google Scholar]
- 12.Wang K., Ding Z., Zeng Y., Meng J., Chen M., “Sinusoidal B-M method based spectral domain optical coherence tomography for the elimination of complex-conjugate artifact,” Opt. Express 17(19), 16820–16833 (2009). [DOI] [PubMed] [Google Scholar]
- 13.Zhang M., Ma L., Yu P., “Spatial convolution for mirror image suppression in Fourier domain optical coherence tomography,” Opt. Lett. 42(3), 506–509 (2017). [DOI] [PubMed] [Google Scholar]
- 14.Sarunic M., Choma M. A., Yang C., Izatt J. A., “Instantaneous complex conjugate resolved spectral domain and swept-source OCT using 3x3 fiber couplers,” Opt. Express 13(3), 957–967 (2005). [DOI] [PubMed] [Google Scholar]
- 15.Sarunic M. V., Applegate B. E., Izatt J. A., “Real-time quadrature projection complex conjugate resolved Fourier domain optical coherence tomography,” Opt. Lett. 31(16), 2426–2428 (2006). [DOI] [PubMed] [Google Scholar]
- 16.Bo E., Chen S., Cui D., Chen S., Yu X., Luo Y., Liu L., “Single-camera full-range high-resolution spectral domain optical coherence tomography,” Appl. Opt. 56(3), 470–475 (2017). [DOI] [PubMed] [Google Scholar]
- 17.Vakoc B. J., Yun S. H., Tearney G. J., Bouma B. E., “Elimination of depth degeneracy in optical frequency-domain imaging through polarization-based optical demodulation,” Opt. Lett. 31(3), 362–364 (2006). [DOI] [PMC free article] [PubMed] [Google Scholar]
- 18.Leitgeb R. A., Michaely R., Lasser T., Sekhar S. C., “Complex ambiguity-free Fourier domain optical coherence tomography through transverse scanning,” Opt. Lett. 32(23), 3453–3455 (2007). [DOI] [PubMed] [Google Scholar]
- 19.An L., Wang R. K., “Use of a scanner to modulate spatial interferograms for in vivo full-range Fourier-domain optical coherence tomography,” Opt. Lett. 32(23), 3423–3425 (2007). [DOI] [PubMed] [Google Scholar]
- 20.Bachmann A., Leitgeb R., Lasser T., “Heterodyne Fourier domain optical coherence tomography for full range probing with high axial resolution,” Opt. Express 14(4), 1487–1496 (2006). [DOI] [PubMed] [Google Scholar]
- 21.Zhang J., Nelson J. S., Chen Z., “Removal of a mirror image and enhancement of the signal-to-noise ratio in Fourier-domain optical coherence tomography using an electro-optic phase modulator,” Opt. Lett. 30(2), 147–149 (2005). [DOI] [PubMed] [Google Scholar]
- 22.Köttig F., Cimalla P., Gärtner M., Koch E., “An advanced algorithm for dispersion encoded full range frequency domain optical coherence tomography,” Opt. Express 20(22), 24925–24948 (2012). [DOI] [PubMed] [Google Scholar]
- 23.Witte S., Baclayon M., Peterman E. J., Toonen R. F., Mansvelder H. D., Groot M. L., “Single-shot two-dimensional full-range optical coherence tomography achieved by dispersion control,” Opt. Express 17(14), 11335–11349 (2009). [DOI] [PubMed] [Google Scholar]
- 24.Yi L., Sun L., Ding W., “Multifocal spectral-domain optical coherence tomography based on Bessel beam for extended imaging depth,” J. Biomed. Opt. 22(10), 1–8 (2017). [DOI] [PubMed] [Google Scholar]


