Abstract
Background
Cardiac rupture often occurs after acute myocardial infarction due to complex and unclear pathogenesis. This study investigated whether metformin increases the incidence of cardiac rupture after myocardial infarction through the AMPK-MTOR/PGC-1α signaling pathway.
Material/Methods
An acute myocardial infarction (MI) mouse model was established. A series of experiments involving RT-qPCR, Western blot, TUNEL staining, and Masson staining were performed in this study.
Results
Myocardial infarction occurred, resulting in the cardiac rupture, and the expression level of PGC-1α increased in the cardiac myocardium. Meanwhile, the proportion of myocardial NT-PGC-1α/PGC-1α decreased. The expression level of myocardial PGC-1α in MI mice with cardiac rupture after MI was significantly higher than that in the mice without cardiac rupture, and the ratio of myocardial NT-PGC-1α/PGC-1α was low. In addition, increasing the dose of metformin significantly increased the incidence of cardiac rupture after myocardial infarction in MI mice. High-dose metformin caused cardiac rupture in MI mice. Moreover, high-dose metformin (Met 2.0 nM) reduces the proportion of NT-PGC-1α/PGC-1α in primary cardiomyocytes of SD mice (SD-NRVCs [Neonatal rat ventricular cardiomyocytes]), and its effect was inhibited by Compound C (AMPK inhibitor). Further, after 3 days of treatment with high-dose metformin in MI mice, myocardial fibrin synthesis decreased and fibrosis was significantly inhibited. Meanwhile, cardiomyocyte apoptosis increased significantly. With the increase in metformin concentration, the expression level of myocardial LC3b gradually increased in MI mice, suggesting that metformin enhances the autophagy of cardiomyocytes.
Conclusions
These results suggest that metformin increases cardiac rupture after myocardial infarction through the AMPK-MTOR/PGC-1α signaling pathway.
MeSH Keywords: Heart Rupture, Metformin, Myocardial Infarction
Background
Cardiac rupture is a catastrophic complication occurring after acute myocardial infarction (MI) [1] with complex pathogenesis. Existing studies [2] have shown that its occurrence may be related to: (1) Reduced myocardial tensile strength after MI; (2) Over-activation of inflammatory response, over-expression of inflammatory factors, MMPs, or increased activity; (3) Death of cardiomyocytes (e.g., apoptosis, autophagy, and necrosis); and (4) Gene susceptibility. Recent research shows that new pathogenesis is associated with the occurrence of cardiac rupture [3–6].
Peroxisome proliferator-activated receptor gamma coactivator-1α, PGC-1α, is a nuclear receptor-assisted activator mainly found in tissues containing mitochondria and has high energy requirements related to functioning of tissues such as the heart, skeletal muscle, brown adipose tissue, and brain cells, and it works together with nuclear receptor PPARγ to promote cell energy metabolism and cell oxidative phosphorylation as well as improving cell energy utilization and increasing mitochondrial proliferation [7–9]. Studies reported that there is a large difference in serum PGC-1α levels between heart failure patients and healthy volunteers, suggesting that PGC-1α levels may be one of the markers of energy metabolism status in patients with heart failure, as well as in those with other cardiovascular diseases. NT-PGC-1α is the N-terminal isoform of PGC-1α and contains only 270 amino acids of the N-terminus of PGC-1α [10,11], thus losing the key region and some of the transcription-factor-binding regions; however, NT-PGC -1α still performs most of the physiological functions of PGC-1α.
A large number of studies [12,13] have confirmed that the production of mitochondria in cells is related to AMPK activation, and PGC-1α is the most important downstream target of AMPK-regulated mitochondrial biosynthesis. Its mechanism mainly involves AMPK’s cascade regulation for PGC-1α signaling. AMPK is a heterotrimeric complex composed of an alpha catalytic subunit and a regulatory beta and gamma protein subunit. The AMP/ATP ratio in the body raises under pathological conditions such as hypoxia, ischemia, heat shock, and glucose denudation, which activates the AMPK signaling pathway. Among them, AMPK-a activity directly increases the protein content of PGC-1α and improves the stability of PGC-1α complex by translational modification. In addition, ectopic expression of PGC-1α also stimulates the expression of GLUT4 and oxidative metabolism in mitochondria [14] while stimulating mitochondrial biosynthesis and functional regulation by enhancing mitochondrial respiratory processes, regulating beta oxidation of fatty acids, maintaining the Krebs cycle, and enhancing the activity of oxidatively phosphorylated enzymes [15]. AMPK stimulates PGC-1α; hence, the expression of PGC-1α at gene and protein levels is stronger, resulting in the activation of NRF-1/2 and mtTFA. mtTFA then activates encoding of nuclear genes of mitochondrial proteins and increases the expression of PGC-1α at mitochondrial genes, and thus enhances mitochondrial biogenesis. However, studies have reported that the sustained high expression of cardiac PGC-1α in mice leads to abnormal proliferation of mitochondria with structural and functional abnormalities, termed mitochondrial proliferation disorder [16]. Therefore, in order to maintain the stability and functional normality of the mouse heart, it is necessary to modulate the quantity of mitochondria and function of cardiomyocytes in mice.
In recent years, it has been demonstrated that metformin has cardioprotective, anti-inflammatory, anti-oxidative, anti-fibrotic, and various other protective effects, which can reduce the risk of myocardial infarction in patients with coronary heart disease, and inhibit mitochondrial function during myocardial reperfusion [17,18]. The pharmacological effects of metformin are mainly achieved through the activation of adenosine-activated protein kinase (AMPK) [19]. Therefore, we can make the following conjecture: After the occurrence of MI, sufficient or large doses of metformin [20,21] should be given to attain better cardiovascular protection. The mechanism may involve the AMPK- and mTOR-related signaling pathways, which regulate the level of PGC-1α in myocardium and improve the energy metabolism in cardiomyocytes, thereby reducing the occurrence of cardiac rupture after myocardial infarction.
In this study, we established an MI model in mouse by using an intraperitoneal injection of metformin to produce cardiomyocyte stimulation, and other methods with the aim to observe the effect of high-dose metformin on cardiac rupture, and to estimate the expression of myocardial PGC-1α levels after inducing myocardial infarction in mice. We aimed to evaluate the possible mechanism of AMPK-, mTOR-, and PGC-1α-related signaling pathways, to investigate the relationship between cardiac rupture and myocardial PGC-1α levels after myocardial infarction in MI mice, and to study the interaction between high-dose metformin and signaling pathway inhibitors.
Material and Methods
Experimental animals
We used wild-type C57BL/6 adult male mice (N=162) weighing approximately 20–25 g and SD neonatal mice (N=12) (age: 1–2 d). Both types of mice were provided by the Experimental Animal Center of Southern Medical University.
Main reagents
Reagents used were pentobarbital sodium (SIGMA, Japan); metformin (purity ≥95%) (SIGMA, Japan); Trizol RNA extraction kit (Invitrogen, USA); RT-PCR two-step kit (TaKaRa, Japan); PCR primers: Synthesized by Shenggong Bio Co. (Guangzhou, China); anti-mouse PGC-1α antibody (Abcam, USA); anti-mouse β-actin antibody (Bioscience, USA); BCA protein quantification kit (Ding Chang Guotai, China); ECL chemiluminescence liquid (Fode, China); HRP-labeled anti-rabbit secondary antibody (Boosen, USA); Masson Staining Kit (Bogu, China); and TUNEL Staining Kit (Roche, Switzerland).
The establishment of mouse acute myocardial infarction model
Surgical instrument preparation was performed using 8-0 non-injury needles, 5-0 suture needles, (small animals) curved scissors, (small animals) straight shears, (small animal) curved tweezers, (small animals) needle holders, homemade spatula, 1 ml syringe, medical gauze, cotton ball, cotton swab, 75% alcohol, and sterile gloves. C57BL/6 adult male mice (N=162, weight: 20–25 g) were weighed and anesthetized with intraperitoneal injection of sodium pentobarbital (50 mg/kg). After direct-vision orotracheal intubation, the respirator was inserted to assist in breathing (tidal volume: 1.0 ml, respiratory rate: 140 times/min). The incision was made at the fourth intercostal space on the left side of the sternum, the subcutaneous muscles were bluntly dissected, and the heart was exposed. The left coronary artery was ligated with 8-0 nylon thread passing through the 2/3rd of the myocardium at the inferior border of the left auricular appendage. During the course of the experiment, real-time monitoring with the electrocardiogram was performed, and the continuous elevation of the ST segment was observed (>1/2 R wave) as a single-peak curve, which served as a sign of successful modeling in the mice. The sternal closure was performed layer-by-layer, and the trachea cannula was pulled out. After the operation, the mice were nursed and observed until waking. The mice were divided into a Sham group (N=8) and am MI group (N=154) after awaking at 2 h after anesthetization. The MI group was further divided randomly into the Control group (N=46) and the Metformin group (N=108) (50 mg/kg/d, 100 mg/kg/d, 200 mg/kg/d, 400 mg/kg/d) (Animal Experimental Protocol – Part 1, Part 2). The first batch of mice with MI was closely observed for 1 week. The condition of the mice and the cause of death were recorded in detail. After observing for 1 week, the mice were weighed and then killed by over-anesthetization with intraperitoneal injection of 150 mg/kg of pentobarbital sodium. When the probability of cardiac rupture after myocardial infarction in the remaining batches of MI model in mice reached the highest point (D1 in Met – 400 mg/kg/d group, and D3 in the remaining group), the mice were weighed and over-anesthetized (intraperitoneal injection 150 mg/kg pentobarbital sodium). After taking blood from the apex cordis, the heart was removed and rinsed with PBS. After the recording of heart weight, lung weight, and body weight, the hearts were randomly selected among the experimental group and placed in 4% paraformaldehyde for soaking and fixation, and the rest of the hearts were stored in liquid nitrogen for fast cooling at −80°C and preserved (extract RNA or protein). Whole blood obtained from the apex cordis was centrifuged (4°C, 2500 rpm, 15 min). The supernatant serum was absorbed and stored frozen at −80°C for later use.
Total RNA extraction (Trizol method)
Some RNA samples were used for reverse transcription synthesis of cDNA, while the remaining RNA samples were stored frozen at −80°C. The RT-PCR reverse transcription steps were followed as written in the instruction manual of the TaKaRa PrimeScript II 1st Strand cDNA Synthesis Kit. Real-Time PCR Data Analysis Bio-Rad CFX Manager Software 1.6 assorted by Bio-Rad CFX96 Real-Time PCR was used to perform data analysis using the 2−ΔΔCt method. The Real-Time PCR reaction parameters were set according to the TaKaRa SYBR Premix Ex Taq II (Perfect Real-Time) kit instructions. The amplification curve and melting curve of Real-Time PCR were applied according to the operation method of the Bio-Rad CFX96 Real-Time PCR System. The sequence of RT-PCR primers is shown in Table 1.
Table 1.
Sequence of RT-PCR primers.
| Target gene | Upstream primer | Downstream primer |
|---|---|---|
| PGC-1α (mouse) | GGCCGCGTTCTTCCATTTGTGTACT | TGGAGATGTCAGCCTCCTCAAAACT |
| NT-PGC-1α (mouse) | TGCCATTGTTAAGACCGAG | GGTCACTGGAAGATATGGC |
| β-actin (mouse) | TGGACAGTGAGGCAGGATAG | TACTGCCCGGCTCCTAGCA |
TUNEL staining
The tissue was embedded and cleanly sliced. It was then washed under running water for 8 h. For dehydration, the block was placed in 70% ethanol overnight after washing. The next day, the block was soaked in 80%, 90%, 100% A, and 100% B ethanol for 1 h each. Acetone, xylene A, and xylene B were then used for soaking for 30 min each until the tissue block appeared brownish or dark red, and transparent. For wax dipping, the block was placed into water-bath paraffin tanks A, B, and C for 1 h each (60°C). For embedding, the block was placed in an embedding mold and embedded using an embedding instrument. The tissue was sliced to a thickness of 4 μm, the cut sections were placed in an oven at 45°C overnight. Paraffin sections were dewaxed to water. For enzyme repair antigen, 20 mg/ml of proteinase K was diluted with 10 mM Tris-HCl (pH 7.4–7.8) to prepare 10–20 μg/ml solution, proteinase K dilution was added dropwise to the sample, and then it was covered by a membrane and incubated at 37°C for 20 min. The sample was then washed twice with PBS for 5 min. For the enzyme solution, the solution was labeled as 1: 9 preparation, mixed, and placed on ice for later use. The prepared TUNEL reaction mixture was then dropped on the slide, covered with the membrane, and incubated for 60 min at 37°C. It was then washed 3 times with PBS for 5 min each time. After drying, fluorescence decay Fluoromount-G was mounted and photographed under a fluorescence microscope at an excitation wavelength of 550 nm.
Masson staining
The tissue was embedded and sliced cleanly. It was then washed under running water for 8 h. For dehydration, the embedded block was placed in 70% ethanol overnight after washing. On the next day, the block was soaked in 80%, 90%, 100% A, and 100% B ethanol for 1 h each. Acetone, xylene A, and xylene B were then used for soaking each for 30 min until the tissue block appeared brownish or dark red and transparent. For wax dipping, the block was placed into water-bath paraffin tanks A, B, and C for 1 h each (60°C). For embedding, the block was placed in an embedding mold and embedded using an embedding instrument. The tissue was sliced to a thickness of 4 μm, and the cut sections were placed in an oven at 45°C overnight. For dewaxing, paraffin sections were placed in a staining chamber and deparaffinized with xylene A and B for 10 min each. Gradient alcohol was used for dehydrating the sample.
The tissue was soaked in 100%, 95%, 90%, 85%, and 70% for 5 min each for dehydrating and washed twice with distilled water every minute. The nucleus was stained with hematoxylin for 10 min and washed under running water for 1 min. It was then placed in still water for 5 min. The fully washed sample was then overstained with 0.5% hydrochloric acid alcohol. It was dip-dyed with Ponceau’s Acidic Erythromycin for 7 min and then rinsed with 2% glacial acetic acid aqueous solution for 5 s. To differentiate, it was placed in 1% phosphomolybdic acid aqueous solution for 10 min. The sample was then directly stained with an aqueous solution of aniline blue for 5 min without washing with water and then was rinsed with 2% aqueous glacial acetic acid for 5 s.
The slices were placed on a fume hood to dry. For sealing, the air-dried tissue sections were mounted with neutral gum. For imaging, the destination area was selected under the light microscope to take pictures.
Statistical analysis
All experimental data are expressed as mean ±SD, using SPSS 16.0 software for statistical analysis. The difference in the level of inspection is set to P<0.05 (bilateral). The following procedures were performed: 1) The measured data are compared using the independent-samples t test, Levene homogeneity test of variance, and the Satterthwaite approximation t test under conditions of homogeneity test of variance (P<0.05); 2) The enumeration data were compared between the 2 groups using the chi-square test, one-way ANOVA analysis of variance was used for comparison among groups, and Bonferroni (homogeneity of variance) or Dunnett’s T3 (variance of variance) were used for multiple comparisons.
Results
Relationship between PGC-1α expression level and cardiac rupture
In this experiment, the cardiac muscle tissue of mice with cardiac rupture was collected in the following way: When mice were found to have convulsions and agitation, they were suspected to have a cardiac rupture. They were immediately dissected and it was observed that that there was a large blood clot in the pericardial cavity and a breakaway gap. It was determined to be cardiac rupture. On the other hand, at the corresponding time point, excessive pentobarbital anesthesia was given to the non-cardiac-rupture group mice, and the chest was opened up, the blood was collected, and the heart was taken out.
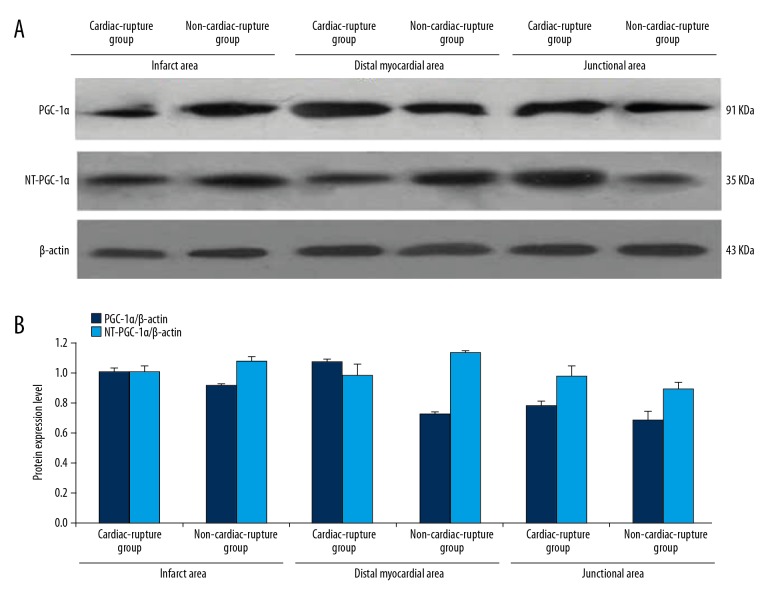
On the third day after the establishment of the MI model in mice, the expression levels of PGC-1α/NT-PGC-1α in the infarcted, junctional, and distant myocardial areas were estimated in the cardiac rupture group and the non-cardiac-rupture group. As shown in Figure 1A and 1B, the expression of PGC-1α in the infarct, junctional, and distal myocardial regions in the mice with cardiac rupture after myocardial infarction was higher than that in the MI mice without cardiac rupture; however, the ratio of NT- PGC-1α/PGC-1α in the infarcted myocardial regions in the mice with cardiac rupture was lower than that in MI mice without cardiac rupture (Figure 2).
Figure 1.
The relation between PGC-1α NT-PGC-1αexpression and the location of Myocardial area. (A) The protein expression level of PGC-1α in infarcted, junctional, and distant myocardial areas of the non-cardiac rupture and MI groups. (B) The quantity of protein expression level of PGC-1α in infarcted, junctional, and distant myocardial areas of non-cardiac rupture and MI groups, which was higher in the MI group than in the Non-MI group, and the difference among the levels in the junctional area was the most significant. The expression level of NT-PGC-1α in the junctional area of the MI group was higher than that in the Non-MI group, while it was lower than that in the infarcted and distant myocardial areas of Non-MI.
Figure 2.
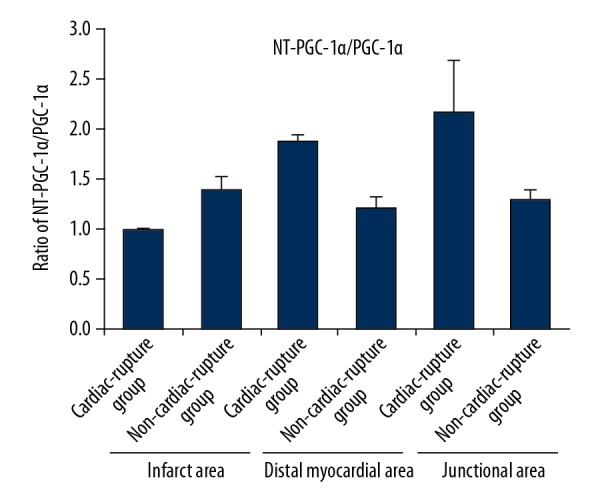
Ratio of NT- PGC-1α/PGC-1α. The proportion of myocardial NT-PGC-1α/PGC-1α in the infarcted area of the MI group was lower than that in the Non-MI group, while the proportion of myocardial NT-PGC-1α/PGC-1α in the junctional and distant myocardial areas was higher than that in the Non-MI group.
The relationship between metformin dose and incidence of cardiac rupture after myocardial infarction in mice
Survival analysis was performed in MI mice after intraperitoneal injection of different doses of metformin for 1 week. The results showed that when metformin (50–200 mg/kg/d) was injected intraperitoneally, the incidence and mortality in MI mice tended to increase with increasing dose of metformin. Intraperitoneal injection of metformin (400 mg/kg/d) was toxic for MI mice. In this experiment, we mainly studied the mechanism of high-dose metformin in increasing the cardiac rupture. For this, we selected administration of metformin (200 mg/kg/d) by an intraperitoneal injection to define the action of high-dose metformin on MI mice. The pathogenesis of cardiac rupture after myocardial infarction in MI mice requires further research.
After 1 week of intraperitoneal injection of 50 mg/kg/d of metformin in the MI group, the mortality rate was 40% (8/20, means 8 mice died in the Met (50) group), and the incidence of cardiac rupture was 25% (5/20), which were lower than that in the control group [mortality was 50.0% (23/46), and the incidence of cardiac rupture was 28.2% (13/46)]; however, the difference was not significant. Among them, the mortality rate for 100 mg/kg/d of metformin in the MI group mice was 61.6% (16/26), and the incidence of cardiac rupture was 38.5% (10/26). After the intraperitoneal injection of 200 mg/kg/d of metformin for 1 week, the mortality rate was 83.4% (26/31) and the incidence of cardiac rupture was 45.2% (16/31). Importantly, after the intraperitoneal injection of 400 mg/kg/d of metformin, the mortality rate reached 87.1% (27/31) after the first dose of the drug within 24 h, and the rate of cardiac rupture was 6.5% (2/31) (Figure 3).
Figure 3.
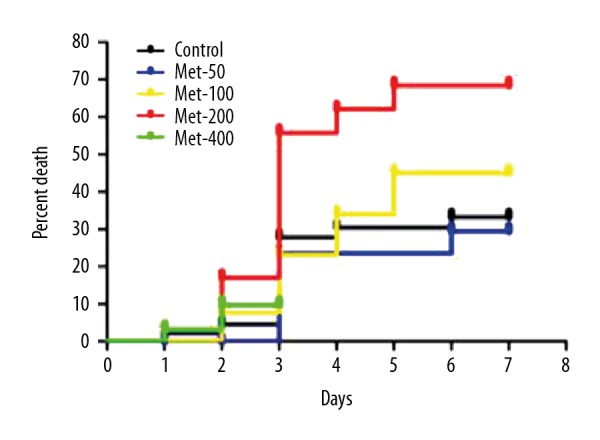
The relationship between the death percentage and the doses of metformin for MI mice. When metformin (50–200 mg/kg/d) was injected intraperitoneally, the incidence and mortality in MI mice tended to increase with increasing doses of metformin. Intraperitoneal injection of metformin (400 mg/kg/d) was toxic for MI mice.
The relationship between metformin dose and expression level of PGC-1 in mice after myocardial infarction
The mice were treated with different doses of metformin for 3 days. The expression levels of PGC-1α and NT-PGC-1α in mice were detected by RT-PCR and Western Blot techniques. The results showed that, after the intraperitoneal injection of metformin (50–200 mg/kg/d) into the MI mice, the expression level of PGC-1α protein and the ratio of NT-PGC-1α/PGC-1α tended to decrease with the increasing doses of metformin (Figure 4A, 4B).
Figure 4.
The relationship between the protein expression levels of PGC-1α and NT-PGC-1α and the doses of metformin in mice after MI. (A) The protein expression level of PGC-1α and NT-PGC-1α treated with different doses of metformin (50–200 mg/kg/d) in the MI mice. (B) The quantity of protein expression level of PGC-1α and NT-PGC-1α treated with different doses of metformin (50–200 mg/kg/d) in the MI mice.
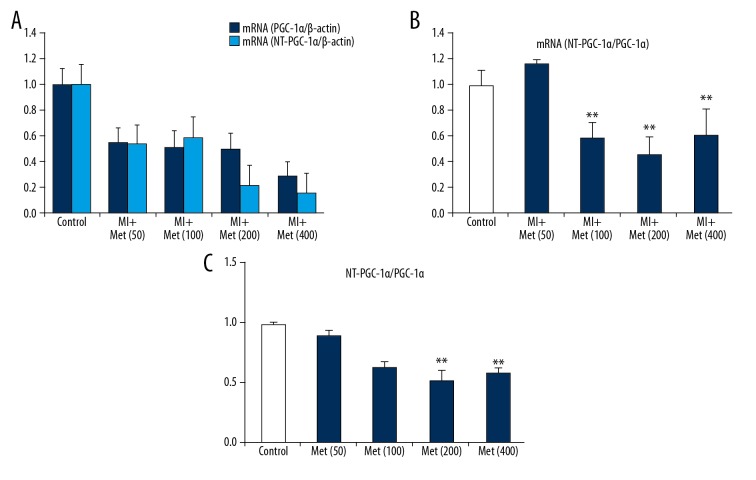
For myocardial PGC-1α levels, except for a slight rise noted in the Met (50) group, the expression levels of myocardial PGC-1α were lower in the MI group mice than that in the control group before reaching the toxic dose of 400 mg/kg/d of metformin; however, these levels tended to decrease with increasing dose of metformin (MI group vs. Control group, P<0.05). Moreover, gene expression levels were also lower in the MI group than that in the control group (MI group vs. Control group, P<0.05), while the ratio of PGC1α/NT-PGC-1α as well as the mRNA(PGC1α/NT-PGC-1α) were lower in the Met (100), Met (200), and Met (400) groups than in the control group, which did not show obviously change with the dose of metformin (Figure 5A–5C).
Figure 5.
The relationship between the mRNA levels of PGC-1α and NT-PGC-1α and the doses of metformin in mice after MI. (A) The results of RT-PCR mRNA level of NT-PGC-1α and PGC-1α after being treated different doses of metformin. (B) The ratio of myocardial NT-PGC-1α/PGC-1α after being treated different doses of metformin. (C) The ratio of control group NT-PGC-1α/PGC-1α after being treated different doses of metformin. ** P<0.05, compared with the control group.
Effect of different doses of metformin on the AMPK-mTORC/PGC-1α signaling pathway
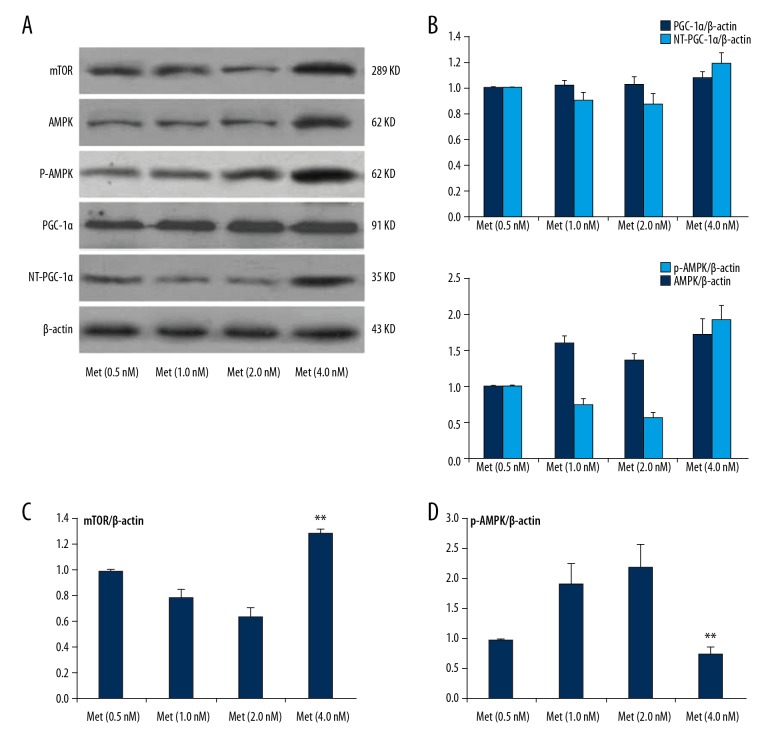
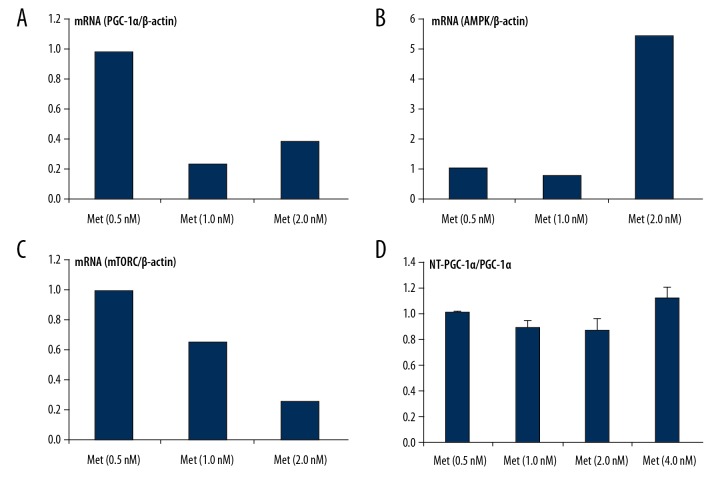
After separating NRVCs, to detect the related molecular expression of AMPK-mTORC/PGC-1α signaling pathway, the tissue samples with different concentrations of metformin were incubated for 24 h under the same conditions. The results showed that metformin activated the AMPK signaling pathway and regulated the related molecular expression of AMPK-mTORC/PGC-1α signaling pathway. At the same time, with the increasing concentration of metformin (0.5–2.0 nmol/L), the expression level of PGC-1α also increased mildly. The ratio of NT-PGC-1α/PGC-1α gradually decreased, which showed that metformin (4 nmol/L) might have caused dose-related cytotoxic damage to NRVCs. Western Blot analysis was used to detect the related molecular expression of the AMPK-mTORC/PGC-1α signaling pathway. When metformin (4 nmol/L) was given to stimulate NRVCs, the protein expression of AMPK, p-AMPK, and mTOR were higher than that in the Met (0.5 nM) group; however, the p-AMPK/AMPK ratio and the AMPK activation level decreased (Figure 6A–6D). With the increase in the metformin concentration (0.5–2.0 nmol/L), the ratio of p-AMPK/AMPK (i.e., the phosphorylation of AMPK) gradually increased. The expression level of PGC-1α slightly increased, but without any significant difference. The expression of mTOR and NT-PGC-1α also decreased. After analyzing the ratio of NT-PGC-1α/PGC-1α, it was noted that the ratio of NT-PGC-1α/PGC-1α gradually decreased with increasing metformin concentrations (0.5–2.0 nmol/L) (Figure 7A–D).
Figure 6.
The protein expression of metformin on AMPK-mTORC/PGC-1α signaling pathway in SD- NRVCs. (A) Western blot analysis was used to detect the related gene expression levels of the AMPK-mTORC/PGC-1α signaling pathway. Expression levels of NT-PGC-1α/PGC-1α, mTOR, and AMPK p-AMPK protein level after treatment with different doses of metformin. (B) The quantity of protein expression level of NT-PGC-1α/PGC-1α, and AMPK p-AMPK protein level after treatment with different doses of metformin. (C) The quantity of protein expression level of mTOR protein level after treatment with different doses of metformin. (D) The ratio of p-AMPK/AMPK protein level after being treated with different doses of metformin. Data are presented as mean ±SD from 3 independent experiments. ** P<0.05, compared with the Met (0.5 nM) group.
Figure 7.
The mRNA level of metformin on AMPK-mTORC/PGC-1α signaling pathway in SD-NRVCs. (A–D) RT-PCR was used to detect the related gene expression levels of AMPK-mTORC/PGC-1α signaling pathway. Expression levels of NT-PGC-1α/PGC-1α, mTOR, and mRNA after treatment with different doses of metformin.
Cardiac structural and morphological changes in MI mice induced by high-dose metformin
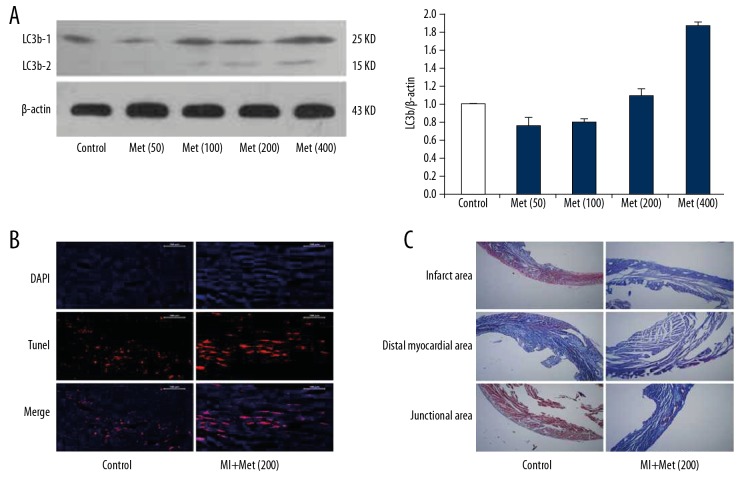
After intraperitoneal injection of different doses of metformin for 3 days in MI mice, the expression level of LC3b was detected in the myocardium using Western blotting. The results showed that the expression level of myocardial LC3b level in the MI mice gradually increased with increasing doses of metformin before reaching a toxic dose (400 mg/Kg/d) (Figure 8A). In addition, after treating the mice with metformin intraperitoneally for 3 days, cardiomyocyte apoptosis was detected in the mouse hearts using TUNEL staining. TUNEL staining results showed that, as compared to the control group, the cardiomyocyte apoptosis was significantly higher in the hearts of the MI mice treated with high-dose metformin (200 mg/kg/d) (Figure 8B). After treating the mice with metformin intraperitoneally for 3 days, myocardial fibrosis was detected in the MI mice using Masson staining. The results showed that, as compared to the control group, high-dose metformin (200 mg/kg/d) treatment significantly decreased fibrin synthesis in the hearts of MI mice, and myocardial fibrosis was significantly inhibited after 3 days (Figure 8C). These results indicate that metformin enhances the autophagy and apoptosis of cardiomyocytes, while inhibiting myocardial fibrosis.
Figure 8.
Cardiac structural and morphological changes in MI mice induced by high-dose metformin. (A) The expression levels of LC3b-1 and LC3b-2 were detected in the myocardium after treatment with different doses of metformin using Western blot analysis. (B) After high-dose metformin (200 mg/kg/d) treatment for 3 days, cardiomyocyte apoptosis was detected in the mouse hearts using TUNEL staining. (C) After high-dose metformin (200 mg/kg/d) treatment for 3 days, myocardial fibrosis was detected in the MI mice using Masson staining.
Discussion
MI is an increasingly common, severe, acute cardiovascular disease. Cardiac rupture after MI includes 3 types of rupture, among which, rupture of the left free ventricular wall is the most common [3]. The mortality rate is high, accounting for 12.1–58% of the total hospital mortality rate in patients with MI [22]. Even if rescued promptly, the prognosis of patients is extremely poor [23].
In many large-sample clinical studies [5,24,25] it has been demonstrated that the risk factors for early cardiac rupture after myocardial infarction are being elderly and female. At the same time, the thrombolytic therapy is still controversial in the treatment of MI [26]. Patients with MI who cannot obtain timely coronary interventions and cannot achieve timely reperfusion must be managed with drugs or treatments that reduce the occurrence of complications such as cardiac rupture and help in improving the prognosis and quality of life. Therefore, it is important to establish an MI mouse model to study the mechanism of cardiac rupture after myocardial infarction, and thereby to determine the diagnostic markers and actively seek effective preventive measures associated with cardiac rupture after myocardial infarction [27,28]. In this study, we found that high-dose metformin in MI mice inhibited myocardial fibrosis and increased the autophagy and apoptosis of cardiomyocytes. Our results suggest that metformin increases cardiac rupture after myocardial infarction through the AMPK-MTOR/PGC-1α signaling pathway.
The pathogenesis of cardiac rupture after myocardial infarction is very complicated. Existing studies have shown [2,29] that reduced myocardial tensile strength, excessive activation of inflammatory response, and over-expression or increased activity of inflammatory factors and MMPs only play a limited certain role in the pathophysiological process. With the advances in research, involvement of new pathogenesis has been reported. Recently, some scholars [3,30] have discovered that myocardial energy metabolism disorder is also involved in the pathophysiological process of heart failure after myocardial infarction and plays an important role in disease prognosis and development of MI [31]. PGC-1α is a nuclear receptor-assisted activator mainly found in tissues containing mitochondria and with high energy requirements such as the myocardium, skeletal muscle, and brown adipose tissue [32,33], and works together with nuclear receptor PPARγ to promote cell energy metabolism and cell oxidative phosphorylation, thereby improving cell energy utilization [34] and regulating mitochondrial function [35]. It is one of the key factors of myocardial energy metabolism. NT-PGC-1α contains only 270 amino acids of the N-terminus of PGC-1α but still performs most of the physiological functions of PGC-1α [36]. In this study, we observed that the expression level of PGC-1α in the total ventricular area, infracted area, junctional area, and distant area in the MI mice with cardiac rupture was higher than that in the MI mice without cardiac rupture. We also found that the proportion of myocardial NT- PGC-1α/PGC-1α was significantly reduced after cardiac rupture, suggesting that PGC-1α is involved in the pathogenesis of cardiac rupture; however, it may also occur secondary to cardiac rupture. The significant decrease in the myocardial NT-PGC-1α/PGC-1α ratio after cardiac rupture also suggests that the expression level of myocardial PGC-1α increased rapidly after cardiac rupture. It is generally believed [3] that any drug or treatment that can regulate the state of myocardial energy metabolism after the occurrence of MI may become potential target or method for prevention of cardiac rupture after myocardial infarction. Therefore, we speculated that monitoring the ratio of NT-PGC-1α/PGC-1α and expression level of PGC-1α can better reflect the myocardial energy metabolism after myocardial infarction in MI mice, and that timely regulation of PGC-1α levels will help to reduce the occurrence of cardiac rupture after myocardial infarction in the MI mice.
Metformin is the most widely used biguanide in clinical practice for the treatment of type 2 diabetes, and its hypoglycemic effect is dose-dependent [37]. Many scholars [19] believe that metformin has a cardioprotective effect and enhances myocardial function. When myocardial infarction, heart failure, and other cardiovascular diseases occur, a full dose or high dose of metformin should be administered as soon as possible to ensure better cardiovascular protection. In this study, we found that high-dose metformin (≥100 mg/kg/d) caused a significant increase in the mortality of the MI mice. Before reaching the toxic dose of 400 mg/kg/d of metformin, the incidence of cardiac rupture in MI mice also increased with increasing doses of metformin. This result is clearly contradictory to the view that “metformin has a protective effect on the heart”, which is supported by many scholars [38]. In recent years, it has been reported that metformin treatment does not improve cardiac function in non-diabetic patients or in those with acute ST segment elevation myocardial infarction (STEMI) undergoing direct PCI [39]. Treating young patients who have hyperglycemia with increasing dose of metformin is not effective. In addition, a surprising and shocking study on statins [40,41] has showed that high-intensity/high-dose statin therapy accelerates and aggravates coronary calcification in patients. For patients with coronary heart disease, calcification of coronary atherosclerosis is an important indicator of the disease burden [42]. Therefore, we hypothesized that high-dose metformin stimulates certain unknown signaling pathways or mechanisms, resulting in an increased incidence of cardiac rupture in MI mice after MI.
It has been shown that the pharmacological effects of metformin are mainly achieved through the AMP-activated protein kinase (AMPK) pathway. PGC-1α is an important downstream effector molecule of AMPK [41]. Our results showed that after the continuous intraperitoneal injection of metformin in the MI mice, on the third day (D3) after the establishment of an MI model, the incidence of cardiac rupture after myocardial infarction in mice was the highest. After MI mice were intraperitoneally injected, the expression level of PGC-1α in myocardium decreased with increasing metformin dose, but before reaching the toxic dose of metformin (400 mg/kg/d). The expression of PGC-1α also decreased. We found that the pharmacological effects of metformin are mainly achieved through AMP-activated protein kinase pathway and PGC-1α is an important downstream effector molecule of AMPK; however, the activity of AMPK directly increases PGC-1α protein content and enhances the stability of PGC-1α protein through post-translational modification-phosphorylation. NT-PGC-1α may also play a role in MI and cardiac rupture after myocardial infarction in mice. NT-PGC-1α/PGC-1α can better reflect the rapid deterioration of myocardial energy metabolism in mice when myocardial infarction and subsequent cardiac rupture occur.
It has been reported that regulation of energy metabolism is mediated and regulated by multiple signaling pathways associated with it. The mammalian target of rapamycin (mTOR) is also a marker of cellular energy state and regulates the cellular metabolism by adjusting its downstream signaling pathways [43]. The AMPK-PGC-1α signaling pathway and the AMPK-mTOR signaling pathway interact to regulate the energy balance in cells, and form a switch comprising intracellular anabolic and catabolic processes [44]. mTOR, as a phosphatidylinositol 3-kinase-related kinase (PIKK), is a central regulator of cell growth and proliferation. In the present study, after 3 days of high-dose metformin treatment in MI mice, we found that morphological and structural changes that were significantly related to cardiac rupture. Autophagy and cardiomyocytes apoptosis were significantly enhanced and myocardial fibrosis was significantly inhibited.
Conclusions
In summary, our results showed that the expression level of PGC-1α in myocardium increases after myocardial infarction. When the metformin dose increased, cardiac rupture occurred, and the expression level of PGC-1α decreased, which may be related to the following: (1) For cardiac rupture after myocardial infarction, the expression level of PGC-1α in the mice may be a secondary change of abnormal energy metabolism after cardiac rupture; (2) Myocardial NT-PGC-1α may also play a role in myocardial infarction and subsequent cardiac rupture in the mice; and (3) Apart from leading to myocardial energy metabolism disorder and to many other pathophysiological changes closely related to cardiac rupture, high-dose metformin may also activate and initiate the signal pathways mediated by AMPK-mTOR and those associated with cardiomyocyte autophagy, and apoptosis.
Footnotes
Source of support: This work was supported by the National Natural Science Foundation of China (81273320), NT-PGC-1α in the development of heart failure and its mechanism
Conflict of interests
None.
References
- 1.Roberts WC. Cardiac rupture during acute myocardial infarction diagnosed clinically. Coron Artery Dis. 2018;29:95–96. doi: 10.1097/MCA.0000000000000586. [DOI] [PubMed] [Google Scholar]
- 2.Thygesen K, Alpert JS, Jaffe AS, et al. Third universal definition of myocardial infarction. Eur Heart J. 2012;33:2551–67. doi: 10.1093/eurheartj/ehs184. [DOI] [PubMed] [Google Scholar]
- 3.Becker RC, Gore JM, Lambrew C, et al. A composite view of cardiac rupture in the United States National Registry of Myocardial Infarction. J Am Coll Cardiol. 1996;27:1321–26. doi: 10.1016/0735-1097(96)00008-3. [DOI] [PubMed] [Google Scholar]
- 4.Roberts WC, Burks KH, Ko JM, et al. Commonalities of cardiac rupture (left ventricular free wall or ventricular septum or papillary muscle) during acute myocardial infarction secondary to atherosclerotic coronary artery disease. Am J Cardiol. 2015;115:125–40. doi: 10.1016/j.amjcard.2014.10.004. [DOI] [PubMed] [Google Scholar]
- 5.Honan MB, Harrell FE, Jr, Reimer KA, et al. Cardiac rupture, mortality and the timing of thrombolytic therapy: a meta-analysis. J Am Coll Cardiol. 1990;16:359–67. doi: 10.1016/0735-1097(90)90586-e. [DOI] [PubMed] [Google Scholar]
- 6.Bates RJ, Beutler S, Resnekov L, et al. Cardiac rupture – challenge in diagnosis and management. J Am Coll Cardiol. 1977;40:429–37. doi: 10.1016/0002-9149(77)90167-9. [DOI] [PubMed] [Google Scholar]
- 7.Arany Z, He H, Lin J, et al. Transcriptional coactivator PGC-1α controls the energy state and contractile function of cardiac muscle. Cell Metab. 2005;1:259–71. doi: 10.1016/j.cmet.2005.03.002. [DOI] [PubMed] [Google Scholar]
- 8.Norheim F, Langleite TM, Hjorth M, et al. The effects of acute and chronic exercise on PGC-1α, irisin and browning of subcutaneous adipose tissue in humans. FEBS J. 2014;281:739–49. doi: 10.1111/febs.12619. [DOI] [PubMed] [Google Scholar]
- 9.Perjés Á, Kilpiö T, Ulvila J, et al. Characterization of apela, a novel endogenous ligand of apelin receptor, in the adult heart. Basic Res Cardiol. 2016;111:2. doi: 10.1007/s00395-015-0521-6. [DOI] [PubMed] [Google Scholar]
- 10.Fernandez-Marcos PJ, Auwerx J. Regulation of PGC-1α, a nodal regulator of mitochondrial biogenesis. Am J Clin Nutr. 2011;93:884S–90S. doi: 10.3945/ajcn.110.001917. [DOI] [PMC free article] [PubMed] [Google Scholar]
- 11.Chang JS, Fernand V, Zhang Y, et al. NT-PGC-1α protein is sufficient to link β3-adrenergic receptor activation to transcriptional and physiological components of adaptive thermogenesis. J Biol Chem. 2012;287:9100–11. doi: 10.1074/jbc.M111.320200. [DOI] [PMC free article] [PubMed] [Google Scholar]
- 12.Cantó C, Auwerx J. PGC-1alpha, SIRT1 and AMPK, an energy sensing network that controls energy expenditure. Curr Opin Lipidol. 2009;20:98. doi: 10.1097/MOL.0b013e328328d0a4. [DOI] [PMC free article] [PubMed] [Google Scholar]
- 13.Chen CY, Tsai YL, Kao CL, et al. Effect of mild intermittent hypoxia on glucose tolerance, muscle morphology and AMPK-PGC-1alpha signaling. Chin J Physiol. 2010;53:62–71. doi: 10.4077/cjp.2010.amk078. [DOI] [PubMed] [Google Scholar]
- 14.Mihaylova MM, Shaw RJ. The AMPK signalling pathway coordinates cell growth, autophagy and metabolism. Nat Cell Biol. 2011;13:1016–23. doi: 10.1038/ncb2329. [DOI] [PMC free article] [PubMed] [Google Scholar]
- 15.Mitsuhashi K, Senmaru T, Fukuda T, et al. Erratum to: Testosterone stimulates glucose uptake and GLUT4 translocation through LKB1/AMPK signaling in 3T3-L1 adipocytes. Endocrine. 2016;52:402–3. doi: 10.1007/s12020-016-0864-2. [DOI] [PubMed] [Google Scholar]
- 16.Sajan M, Hansen B, Ivey R, et al. Brain insulin signaling is increased in insulin-resistant states and decreases in FOXOs and PGC-1α and increases in Aβ1–40/42 and Phospho-Tau May Abet Alzheimer development. Diabetes. 2016;65:1892–903. doi: 10.2337/db15-1428. [DOI] [PMC free article] [PubMed] [Google Scholar]
- 17.Calvert JW, Gundewar S, Jha S, et al. Acute metformin therapy confers cardioprotection against myocardial infarction via AMPK-eNOS – mediated signaling. Diabetes. 2008;57:696–705. doi: 10.2337/db07-1098. [DOI] [PubMed] [Google Scholar]
- 18.Lexis CP, van der Horst IC, Lipsic E, et al. Effect of metformin on left ventricular function after acute myocardial infarction in patients without diabetes: The GIPS-III randomized clinical trial. JAMA. 2014;311:1526–35. doi: 10.1001/jama.2014.3315. [DOI] [PubMed] [Google Scholar]
- 19.Suwa M, Egashira T, Nakano H, et al. Metformin increases the PGC-1α protein and oxidative enzyme activities possibly via AMPK phosphorylation in skeletal muscle in vivo. J Appl Physiol (1985) 2006;101:1685–92. doi: 10.1152/japplphysiol.00255.2006. [DOI] [PubMed] [Google Scholar]
- 20.Pierce SA, Chung AH, Black KK. Evaluation of vitamin B12 monitoring in a veteran population on long-term, high-dose metformin therapy. Ann Pharmacother. 2012;46:1470–76. doi: 10.1345/aph.1R223. [DOI] [PubMed] [Google Scholar]
- 21.Yin M, van der Horst IC, van Melle JP, et al. Metformin improves cardiac function in a nondiabetic rat model of post-MI heart failure. Am J Physiol Heart Circ Physiol. 2011;301:H459–68. doi: 10.1152/ajpheart.00054.2011. [DOI] [PubMed] [Google Scholar]
- 22.Yam N, Au TWK, Cheng LC. Post-infarction ventricular septal defect: Surgical outcomes in the last decade. Asian Cardiovasc Thorac Ann. 2013;21:539–45. doi: 10.1177/0218492312462041. [DOI] [PubMed] [Google Scholar]
- 23.Herzog CA, Ma JZ, Collins AJ. Poor long-term survival after acute myocardial infarction among patients on long-term dialysis. N Engl J Med. 1998;339:799–805. doi: 10.1056/NEJM199809173391203. [DOI] [PubMed] [Google Scholar]
- 24.Shamshad F, Kenchaiah S, Finn PV, et al. Fatal myocardial rupture after acute myocardial infarction complicated by heart failure, left ventricular dysfunction, or both: The VALsartan In Acute myocardial iNfarcTion Trial (VALIANT) Am Heart J. 2010;160:145–51. doi: 10.1016/j.ahj.2010.02.037. [DOI] [PubMed] [Google Scholar]
- 25.Huang SM, Huang SC, Wang CH, et al. Risk factors and outcome analysis after surgical management of ventricular septal rupture complicating acute myocardial infarction: A retrospective analysis. J Cardiothorac Surg. 2015;10:66. doi: 10.1186/s13019-015-0265-2. [DOI] [PMC free article] [PubMed] [Google Scholar]
- 26.Becker RC, Charlesworth A, Wilcox RG, et al. Cardiac rupture associated with thrombolytic therapy: impact of time to treatment in the Late Assessment of Thrombolytic Efficacy (LATE) study. J Am Coll Cardiol. 1995;25:1063–68. doi: 10.1016/0735-1097(94)00524-t. [DOI] [PubMed] [Google Scholar]
- 27.Chiariello M, Ambrosio G, Cappelli-Bigazzi M, et al. A biochemical method for the quantitation of myocardial scarring after experimental coronary artery occlusion. J Mol Cell Cardiol. 1986;18:283–90. doi: 10.1016/s0022-2828(86)80410-2. [DOI] [PubMed] [Google Scholar]
- 28.Riberio LG, Hillis LD, Louie EK, et al. A method for demonstrating the efficacy of interventions designed to limit infarct size following coronary occlusion: Beneficial effect of hyaluronidase. Cardiovasc Res. 1978;12:334–40. doi: 10.1093/cvr/12.6.334. [DOI] [PubMed] [Google Scholar]
- 29.Schaper W, Hofmann M, Müller KD, et al. Experimental occlusion of two small coronary arteries in the same heart. A new validation method for infarct size. Basic Res Cardiol. 1979;74:224–29. doi: 10.1007/BF01907822. [DOI] [PubMed] [Google Scholar]
- 30.Jones BM, Kapadia SR, Smedira NG, et al. Ventricular septal rupture complicating acute myocardial infarction: a contemporary review. Eur Heart J. 2014;35:2060–68. doi: 10.1093/eurheartj/ehu248. [DOI] [PubMed] [Google Scholar]
- 31.Tao L, Bei Y, Lin S, et al. Exercise training protects against acute myocardial infarction via improving myocardial energy metabolism and mitochondrial biogenesis. Cell Physiol Biochem. 2015;37:162–75. doi: 10.1159/000430342. [DOI] [PubMed] [Google Scholar]
- 32.Ciszewski A, Sosnowski C, Bęćkowski M, et al. Occlusion of the left anterior descending coronary artery following a negative fractional flow reserve study. Failure or limit of a “gold standard” method? Kardiol Pol. 2016;74:83. doi: 10.5603/KP.2016.0010. [DOI] [PubMed] [Google Scholar]
- 33.Agudelo LZ, Femenía T, Orhan F, et al. Skeletal muscle PGC-1α1 modulates kynurenine metabolism and mediates resilience to stress-induced depression. Cell. 2014;159:33–45. doi: 10.1016/j.cell.2014.07.051. [DOI] [PubMed] [Google Scholar]
- 34.Lerin C, Rodgers JT, Kalume DE, et al. GCN5 acetyltransferase complex controls glucose metabolism through transcriptional repression of PGC-1α. Cell Metab. 2006;3:429–38. doi: 10.1016/j.cmet.2006.04.013. [DOI] [PubMed] [Google Scholar]
- 35.Granata C, Oliveira RS, Little JP, et al. Training intensity modulates changes in PGC-1α and p53 protein content and mitochondrial respiration, but not markers of mitochondrial content in human skeletal muscle. FEBS J. 2016;30:959–70. doi: 10.1096/fj.15-276907. [DOI] [PubMed] [Google Scholar]
- 36.Gao X-M, White DA, Dart AM, et al. Post-infarct cardiac rupture: Recent insights on pathogenesis and therapeutic interventions. Pharmacol Ther. 2012;134:156–79. doi: 10.1016/j.pharmthera.2011.12.010. [DOI] [PubMed] [Google Scholar]
- 37.Zamilpa R, Zhang J, Chiao YA, et al. Cardiac wound healing post-myocardial infarction: A novel method to target extracellular matrix remodeling in the left ventricle. Methods Mol Biol. 2013;1037:313–24. doi: 10.1007/978-1-62703-505-7_18. [DOI] [PMC free article] [PubMed] [Google Scholar]
- 38.Nesti L, Natali A. Metformin effects on the heart and the cardiovascular system: A review of experimental and clinical data. Nutr Metab Cardiovasc Dis. 2017;27:657–69. doi: 10.1016/j.numecd.2017.04.009. [DOI] [PubMed] [Google Scholar]
- 39.Lee KY, Kim JR, Choi HC. Genistein-induced LKB1-AMPK activation inhibits senescence of VSMC through autophagy induction. Vascul Pharmacol. 2016;81:75–82. doi: 10.1016/j.vph.2016.02.007. [DOI] [PubMed] [Google Scholar]
- 40.Sambandam N, Lopaschuk GD. AMP-activated protein kinase (AMPK) control of fatty acid and glucose metabolism in the ischemic heart. Prog Lipid Res. 2003;42:238–56. doi: 10.1016/s0163-7827(02)00065-6. [DOI] [PubMed] [Google Scholar]
- 41.Rameshrad M, Soraya H, Maleki-Dizaji N, et al. A-769662, a direct AMPK activator, attenuates lipopolysaccharide-induced acute heart and lung inflammation in rats. Mol Med Rep. 2016;13:2843–49. doi: 10.3892/mmr.2016.4821. [DOI] [PubMed] [Google Scholar]
- 42.Ma L, Ma S, He H, et al. Perivascular fat-mediated vascular dysfunction and remodeling through the AMPK/mTOR pathway in high-fat diet-induced obese rats. Hypertens Res. 2010;33:446–53. doi: 10.1038/hr.2010.11. [DOI] [PubMed] [Google Scholar]
- 43.Liu N, Li Y, Dong C, et al. Inositol-requiring enzyme 1-dependent activation of AMPK promotes Brucella abortus intracellular growth. J Bacteriol. 2016;198:986–93. doi: 10.1128/JB.00868-15. [DOI] [PMC free article] [PubMed] [Google Scholar]
- 44.Marinangeli C, Didier S, Vingtdeux V. AMPK in neurodegenerative diseases: Implications and therapeutic perspectives. Curr Drug Targets. 2016;17:890–907. doi: 10.2174/1389450117666160201105645. [DOI] [PubMed] [Google Scholar]


