

Abstract
Background
Effects of liver dysfunction on target-controlled infusion (TCI) with Marsh parameters of propofol remain poorly documented. The purpose of this study was to evaluate the performance of propofol TCI in a cohort of Chinese patients with severe hepatic insufficiency.
Material/Methods
We assigned 32 patients who underwent liver transplantation to 3 groups according to Child-Turcotte-Pugh (CTP) score. Anesthesia, preceding liver transplantation, was induced and maintained with TCI of 3 μg/mL propofol. Plasma propofol concentration was assessed. Propofol TCI system performance was analyzed in terms of error size, bias, and divergence. Data on plasma propofol concentrations were analyzed, and population pharmacokinetic parameters of propofol were fitted by NONMEM software.
Results
In the CTP C group, measured concentrations of propofol were much higher than those of predictive concentrations, with significantly higher overshoots compared to CTP A patients. Overall, TCI system performance was significantly lower in CTP C patients. Linear regression equations of Cm vs. Cp and a regression model of pharmacokinetics were obtained.
Conclusions
Propofol TCI device performance with Marsh parameters was clinically acceptable in CTP A patients but may not be suitable for patients with severe hepatic impairment.
MeSH Keywords: Drug Delivery Systems, Liver Diseases, Pharmacokinetics, Propofol
Background
Hepatic impairment is a serious global public health problem. China is one of the most highly endemic areas [1]. Therefore, millions of Chinese patients with hepatic dysfunction undergo surgeries annually. Consequently, it is common in clinical practice in China to encounter patients with varying degrees of hepatic insufficiency [2,3]. Since the liver is the major site of drug metabolism, hepatic insufficiency is largely associated with important pharmacokinetic and pharmacodynamic changes in anesthetic drugs.
Propofol is one of the most widely-used intravenous anesthetics in clinical practice and is highly suitable for induction and maintenance of anesthesia, largely due to its rapid onset of action, large volume of distribution, and high clearance rate [4–8]. Propofol was proved to be safe in patients with mild cirrhosis [9,10]. Khamaysi et al. [11] concluded that sedation with propofol did not exacerbate subclinical hepatic encephalopathy in patients with compensated cirrhosis.
To the best of our knowledge, no studies have specifically addressed this issue for cirrhotic patients with severe hepatic failure corresponding to CTP C.
Target-controlled infusion (TCI) is a system that is highly dependent on pharmacokinetics and pharmacodynamics of drugs [12], and can provide, with relative accuracy, concentrations in plasma or even at the target site [10,13–15]. Therefore, TCI makes it possible to achieve a relatively stable induction and a good depth of anesthesia. Due to its pharmacokinetic characteristics, propofol is especially suited to TCI; therefore, propofol TCI has become an important anesthesia procedure.
Marsh parameters incorporated into the Diprifusor TCI system are based on patients with normal organ function and provide a stable blood-drug concentration for induction and maintenance of anesthesia [16–19]. However, the accuracy of this system, when propofol is applied to patients with hepatic impairment, remains largely unknown. This lack of knowledge can cause potentially severe complications related to either a too light or too deep level of anesthesia.
The primary purpose of our study was to assess the predictive performance of the Diprifusor TCI system for propofol infusion in patients with hepatic insufficiency and who were anesthetized for liver transplantation.
Material and Methods
The study was approved by the Research Ethics Committee of the Third Affiliated Hospital of Sun Yat-sen University (Trial registration number ChiCTR-OCH-12002255). The study of pharmacodynamics with the same Trial registration number was conducted at the same time but in different patients [20].
Study population
After obtaining written informed consent from the study participants, patients scheduled for elective liver transplantation were investigated in this prospective observational study. The study inclusion criteria were: American Society of Anesthesiology physical status classification (ASA) II~IV, age 18–65 years old, and undergoing liver transplantation between May 2014 and March 2016. Exclusion criteria were: patients with serious impairment of the respiratory system (chronic obstructive pulmonary disease, asthma, tuberculosis), cardiovascular system (arrhythmia, coronary artery disease, valvulopathy), renal system (renal insufficiency, kidney stones), and/or central nervous system (infection, cerebral infarction, long-term mental or neurological drugs), cancer or major organ surgery, and allergy to the drugs used in this study.
Study protocol
In this observational study, all patients received the same induction protocols. For patient safety during surgery, the anesthesiologists in charge were not blinded to patient liver function, but the patients and analysts were not identified.
No premedication was provided. Heart rate (HR), peripheral arterial oxygen saturation (SpO2), and invasive arterial and central venous pressures (CVP) were continuously monitored (MP60, Philips, Germany).
Anesthesia
Before induction, patients were intravenously administered Plasma-Lyte A in order to maintain a steady state from induction to the time just prior to starting surgery. General anesthesia was induced and maintained with propofol (batch No. CR766, AstraZeneca, Italy) TCI by using a Diprifusor TCI pump (P6003, Alaris, USA). Propofol plasma concentrations were set at 3 μg/mL, which were documented in numerous studies, to provide good conditions for intubation, appropriate depth of anesthesia, and stable hemodynamics [21–23]. After loss of consciousness (LOC), tracheal intubation was facilitated with cisatracurium (0.2 mg/kg) and fentanyl (4.0 μg/kg). Lungs were mechanically ventilated with 50% oxygen to maintain the partial pressure of carbon dioxide at 30–35 mmHg. Propofol infusion was discontinued 30 min after initiation. Thereafter, anesthesia was maintained with sevoflurane inhalation. A bolus dose of cisatracurium (5 mg) and fentanyl (50 μg) were administered when necessary. The time of interest for the study was terminated 30 min after stopping propofol infusion, and the surgery was then allowed to proceed.
When necessary, bolus doses of either 2 mg dopamine or 5 mg urapidil were administered to avoid a 30% decrease in mean arterial pressure (MAP). Atropine was administered at doses of 0.25 mg to maintain HR ≥50 bpm, with doses repeated as necessary. If there were intraoperative drug-related serious adverse events (e.g., allergy or severe hemodynamic events which were out of control), the anesthesiologist would terminate infusion of the related drugs immediately and take the necessary measures.
Blood sampling and analysis
To measure blood propofol concentration, 2-ml samples of arterial blood were collected at 1, 2, 5, 10, 20, and 30 min during propofol infusion, and at the same interval immediately after the 30-min infusion. Blood samples were collected in heparinized tubes and immediately centrifuged. Plasma was transferred to polypropylene tubes and stored at −70ºC until analysis. Propofol concentration was measured by reversed-phase high-performance liquid chromatography with fluorescence detection [24,25]. Laboratory assay was conducted by 2 persons who were not involved in clinical practice.
Data analysis for systemic errors
The size of the error, bias, divergence, and wobble were used to evaluate the performance of the Diprifusor TCI system.
Measured concentrations (Cm) and target concentrations (Cp) were evaluated by examining the performance error (PE), which was calculated during the 30-min infusion according to Formula 1.
| 1 |
Intra-subject bias and system inaccuracy were assessed by determining the median performance error (MDPE) and the median absolute performance error (MDAPE), respectively [19]. Bias represents the degree of deviation between Cm and Cp. Precision (MDAPE) is often used to indicate the proximity of Cm and Cp according to Formulas 2 and 3.
| 2 |
| 3 |
Divergence is defined as the slope of the linear regression of absolute PE value against time and is expressed in units of percentage divergence per hour. A positive value indicates a progressive widening of the gap between Cp and Cm, while a negative value indicates Cm converge on Cp [26–28]. Divergence was calculated according to Formula 4.
| 4 |
Wobble is a measure of the total intra-individual PE variability and is directly related to the ability to achieve stable drug concentration with the computer-controlled infusion pump. Wobble was calculated according to Formula 5.
| 5 |
Pharmacokinetics
According to a previous study [29], we calculated the regression formula of propofol population pharmacokinetic parameters. With NONMEM software (Version V, Level 1.1, Double precision), measured plasma concentration data in the second part of the study were analyzed, fitting the population pharmacokinetic parameters of propofol by using the bootstrap method validation with Wings for NONMEM software.
NONMEM is based on the minimum of objective function value (OFV min) equal to minus twice the maximum of the logarithm likelihood to test the hypothesis. This means that putting the various covariates into the model one by one, the difference between the objective function of the 2 models −2logLmax follow F distribution, similar to χ2 distribution. We confirmed the fixed-effects covariates according to changes in the value of the objective function.
First, referring to the relevant literature, we considered the physiological significance and influences of the pharmacokinetics and focused on the fixed effects (i.e., covariates) that might affect the pharmacokinetic parameters; initially, we screened out the covariates that significantly affected the pharmacokinetic parameters of propofol.
Then, by forward inclusion, we put the covariates which affected significantly the pharmacokinetic parameters of propofol into the base model in the order ΔOFV descending sequentially. According to ΔOFV, we defined the significance level of α=0.01, degree of freedom=1, and established a full regression model.
Then, by using backward elimination, we got rid of, one by one, the false-positive covariates that might exist in the full regression model. According to ΔOFV values, we defined the significance level as α=0.01 and degrees of freedom=1. If ΔOFV >6.64, the covariates had significant effects on the parameters, which should be retained in the model to obtain the final regression model.
Statistical analysis
Data are expressed as mean ± standard deviation, unless stated otherwise, and were analyzed using SPSS v12.0 software package (SPSS, Inc., Chicago, IL, USA). General information was analyzed with either analysis of variance (ANOVA) or Fisher’s exact test. Cm and Cp in every group were compared by using the t test. Statistical significance was defined by P<0.05.
Results
We screened 97 patients between July 2014 and October 2015: 64 were excluded, and 32 were finally enrolled (Figure 1). The patients were assigned to 3 groups on the basis of their Child-Turcotte-Pugh (CTP) score [30,31]: Group CTP A for Child-Turcotte-Pugh A, Group CTP B for Child-Turcotte-Pugh B, and Group CTP C for Child-Turcotte-Pugh C.
Figure 1.

Patient enrollment: 94 patients were screened, 64 were exclude, involving 38 patients over 65 years old, 8 patients with serious impairment of respiratory function receiving preoperative intubation, 8 with arrhythmia or coronary artery disease, 6 with liver-kidney transplantation, and 2 with ASA V. Finally, 32 patients were enrolled and assigned to 3 groups according to their Child-Turcotte-Pugh (CTP) score.
Patients’ characteristics are described in Table 1 and were comparable among all groups.
Table 1.
Characteristics of the patients.
| Characteristic | CTP A n=11 (34.4%) |
CTP B n=10 (31.2%) |
CTP C n=11 (34.4%) |
|---|---|---|---|
| Age (yr) | 43.7±7.4 | 48.3±8.5 | 46.4±8.7 |
| Sex (Male/Female) | 8/3 | 9/1 | 10/1 |
| Weight (kg) | 58.6±11.2 | 66.1±16.4 | 63.1±8.4 |
| Types of diseases | |||
| Cirrhosis | 6 (54.5%) | 5 (50.0%) | 7 (63.6%) |
| Hepatic carcinoma | 5 (45.5%) | 5 (50.0%) | 4 (36.4%) |
CTP A –Child-Turcotte-Pugh A; CTP B – Child-Turcotte-Pugh B, CTP C – Child-Turcotte-Pugh C. Data expressed as mean ± standard deviation, or n (%). All variables were comparable in all groups (all P>0.05).
Propofol plasma concentration at the same TCI propofol target concentration
As blank controls, we collected 416 blood samples (13 per patient) before propofol administration.
There were overshoots in all groups during TCI (Figures 2, 3). After discontinuation of propofol, there were significant differences between CTP C patients Cm and Cp (P<0.05) versus CTP A and B patients, but not between the latter 2 groups (P>0.05). At 10, 20, and 30 min after the start of TCI and at 1, 2, and 5 min after discontinuation, CTP C patients’ Cm were significantly higher than those of CTP A patients (P<0.05). These results suggest that, while set at the same targeted plasma concentrations, more severe liver dysfunction was associated with higher measured plasma concentrations.
Figure 2.

Measured concentrations (Cm) for all groups during the whole observation period (1 h from the start of induction). Cm of Group CTP A were significantly higher than those of propofol predictive concentrations (Cp) in the first 20 min, but not at 30 min. Cm of Group CTP B and C were always higher than those of Cp during TCI (first 30 min), corresponding to overshoot (P<0.05). There were significant differences between Cm and Cp after discontinuation of TCI (later 30 min) (P<0.05) in Group CTP C, but not in Groups CTP A and B (P>0.05). Cm of Group CTP C were significantly higher than those of Group CTP A at 10, 20, and 30 min after the start of the TCI and at 1, 2, and 5 min after discontinuation (P<0.05).
Figure 3.
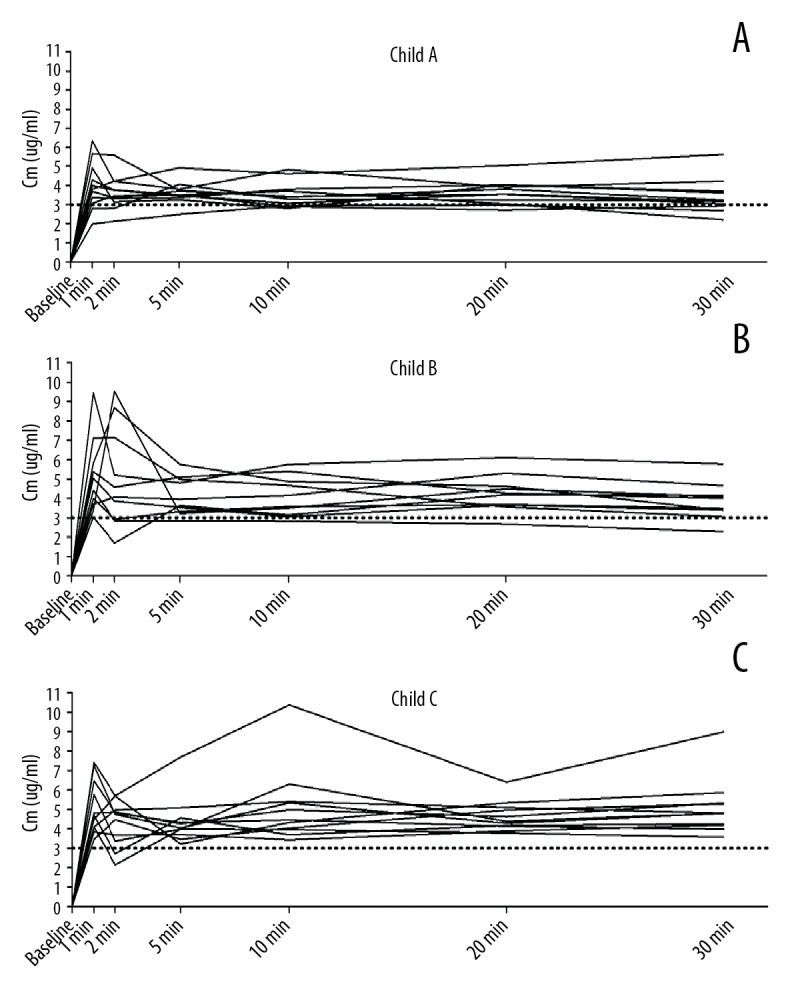
(A–C) The time course of Cm during TCI (first 30 min) for each patient in Group CTP A, Group CTP B, and Group CTP C. There were overshoots (which means much higher Cm than Cp in a short time) in all groups, except in Group CTP A at 30 min.
Linear regression formulas of Cm versus Cp were calculated and shown as follows:
The relationship between liver dysfunction and measured propofol plasma concentrations during TCI targeted for a plasma concentration of propofol
First, we calculated and analyzed MDPE, MDAPE, wobble, and divergence of CTP A, B, and C patients during the whole 60 min (Figure 4). We also analyzed these data separately (during and after TCI, first 30 min, and the last 30 min). These results demonstrated that the accuracy of TCI in CTP B and C patients was reduced, and that this reduction was statistically significant in CTP C patients compared to that of the other 2 groups.
Figure 4.

MDPE (A), MDAPE (B), wobble (C), and divergence (D) for the 3 groups. Biases were 8.0%, 21.8%, and 45.5%, precisions were 23.3%, 33.2%, and 50.7%, wobbles were 13.4%, 17.3%, and 16.7%, and divergences were 2.7%/h, −19.6%/h, and −8.8%/h, all for Groups CTP A, B, and C, respectively.
Analysis of pharmacokinetics
With reference to methods reported by Rui [29], we obtained the following final regression model:
BW corresponded to body weight (kg) and CTP to liver function and Child-Turcotte-Pugh score (5–14 points introduced into the regression model). CL and Q corresponded to the elimination clearance of central and peripheral compartment; V1 and V2 corresponded to volumes of distribution of the central and peripheral compartments, respectively. θCL, θV1, θQ, and θV2 acted as typical population values of CL, V1, Q, and V2, respectively; θBW as the parameter that BW impacted on CL; θCTP as the effects that CTP score had on the volume of distribution of peripheral compartment. Corresponding parameter values were: 0.737 L/min for θCL, 9.94 L for θV1, 1.2 L/min for θQ, 52.9 L for θV2, 0.0163 for θBW, and −0.848 for θCTP.
Discussion
In this prospective observational study, we analyzed the performance of propofol TCI with Marsh parameters in patients with liver dysfunction. Although set to the same plasma concentration, measured plasma concentrations were quite different from Cp, overshoots were common, and CTP C was associated with highest measured plasma concentrations. Analysis of MDPE, MDAPE, wobble, and divergence showed that the accuracy of TCI in CTP B and C patients was not satisfactory, and CTP C was more serious. Overall, TCI system performance was significantly lower in CTP C patients. Linear regression formulas of Cm vs. Cp and regression model of pharmacokinetics were obtained.
The liver is deeply involved in pharmacodynamics and pharmacokinetics of many anesthetics [32–34]. It synthesizes proteins and metabolizes drugs, and therefore exerts a key role in drug binding and drug distribution. The Child-Turcotte-Pugh (CTP) score has been considered as a standard assessment of hepatic insufficiency severity, which is calculated from total bilirubin, serum albumin, prothrombin time, and the severity of ascites and hepatic encephalopathy [13]. Unfortunately, many disorders co-exist with hepatic dysfunction (especially liver failure), which can affect drug effects, such as fluid volume, inflammation, and other individual differences. All of these factors can alter the effects of drugs and made them more complex.
In order to explore the accuracy evaluation of TCI propofol under these circumstances, we selected patients with various degrees of liver dysfunction, and analyzed differences between the propofol Cm and Cp. We determined that, when targeting the same plasma propofol concentration, more severe liver dysfunction was associated with a higher measured plasma concentration.
Propofol metabolism is complex. As reported, UDP-glucuronosyltransferase (UGT), which mostly exists in the liver, is one of the key enzymes in propofol metabolism. This means that propofol metabolism may be affected during either liver failure or liver transplantation.
The TCI system is one of the frequently-used devices in daily clinical practice in China. Marsh parameters incorporated into the Diprifusor TCI system have been derived from patients with normal liver function [5,35]. A previous study [36] found that during intravenous infusion of propofol, compared with the control group, total body clearance and terminal elimination half-life were not significantly different in moderately severe (CTP B patients) cirrhosis. However, pharmacokinetic parameters may not be similar in patients with hepatic insufficiency [37].
Many studies [22,23] have indicated that better intubating conditions, a more appropriate depth of anesthesia, and more stable hemodynamics would be obtained if propofol target concentration is set to 3.0 μg/mL. TCI is set according to pharmacokinetic parameters of the system and required patient information (e.g., age, weight, and preset target concentration). It gives the loading dose (bolus), then a slower infusion-matching combination of the transfer of drug from the central compartment to the peripheral compartment and elimination clearance, but the drug in the body cannot be uniformly and rapidly mixed. In this case, overshoot cannot be completely avoided. Moreover, the difference between Cm and Cp depends on TCI system performance. Since these parameters have been calibrated from normal persons without organ dysfunction, whether they remain suitable for patients with liver dysfunction has not yet been clearly established. Our study shows that Cm in CTP A patients tended to achieve Cp over time, and that overshoot was not problematic. In contrast, in CTP B and C patients, performance error (PE) remained significant even after 30 min of infusion, with a significantly higher number. These results suggest that, under the same target plasma concentration, worse liver function is associated with higher propofol plasma concentrations. Therefore, propofol TCI for this category of patients should be decreased appropriately.
Our results demonstrate that, when targeting the same plasma concentration of propofol, TCI device with Marsh parameters were influenced by the degree of liver dysfunction. This, however, did not mean that propofol TCI should be abandoned. These findings rather illustrate that, in clinical practice, the targeted concentration of propofol should be adjusted according to the severity of liver failure. The currently used TCI pump contains an inherent mode that does not allow changing the speed. When a slow flow pump becomes available and titration can be adjusted based on clinical judgment with processed electroencephalogram monitoring, the procedure should become more appropriate.
TCI system performance is clinically acceptable if the MDPE (bias) is ≤15% and MDAPE (inaccuracy) is ≤30% [38]. In our study, MDAPE and MDPE of CTP B and C patients were over these percentages, thus contrasting with results of CTP A patients. As there are inevitable pharmacokinetic differences among individuals, it is impossible that Cm exactly achieves Cp during TCI. However, if they evolve in parallel, it is possible to adjust Cp proportionally according to clinical needs. The stability of the system in CTP A patients was shown by appropriate divergence (<10%/h) and wobble (13.4%). Plasma propofol concentrations remained fairly constant after reaching the target concentration, because CTP A patients had relatively normal liver function. Therefore, TCI could be applied to CTP A patients. However, divergence and wobble remained high in CTP B and C patients. This was likely due to the pathophysiological disturbance in these patients. Therefore, it appears necessary to regulate the Cp according to the monitoring of depth of anesthesia and clinical experience, in order to overcome the larger systematic errors when Marsh pharmacokinetic parameters embedded in Diprifusor TCI system are applied to CTP B and C patients.
As already mentioned, the mechanisms whereby liver dysfunction influences pharmacokinetics are complex. Patients with either cirrhosis or hepatic insufficiency typically exhibit high cardiac output and low peripheral vascular resistance with shunting of portal blood flow through collateral circulation. This leads to a later tissue distribution from the central compartment than that indicated by TCI prediction. The blood returns to the central compartment with little drug removed, and hence little decrease in drug concentration. Therefore, these patients showed a more significant and lasting higher propofol concentration than targeted. There are varying degrees of abnormal distribution of body fluids, hypoalbuminemia, endotoxemia, and hemodynamic disorders in severe liver dysfunction patients, with marked interindividual variations. This can significantly affect propofol kinetics, and, therefore, contribute to generating the results we observed.
We developed the regression formulas of propofol population pharmacokinetics by using NONMEN software, including the CTP score, which indicated that liver function affected population pharmacokinetic parameters of propofol. This explains the important deviation of TCI between CTP B and C patients.
This study has some limitations. First, pharmacodynamics such as hemodynamic changes were not studied at the same time, mainly due to the limitation of observation time, blood testing, and lack of manpower. Further studies determining the relationship between pharmacokinetic and pharmacodynamic parameters of propofol and liver dysfunction are needed. Secondly, the study time period in our investigation was limited to the period between anesthesia induction and start of surgery. We nevertheless believe that pharmacokinetic data within a short period of time have significant implications for clinical practice.
Conclusions
Performance of the TCI device with Marsh parameter appears to be clinically acceptable when applied to CTP A patients. Propofol blood concentration will remain stable because of more accurate prediction and less bias in the system. However, this device may not be suitable for patients with advanced hepatic impairment.
Footnotes
Source of support: Departmental sources
Conflicts of interest
None.
References
- 1.Wang J. Clinical utility of entecavir for chronic hepatitis B in Chinese patients. Drug Des Devel Ther. 2014;8:13–24. doi: 10.2147/DDDT.S41423. [DOI] [PMC free article] [PubMed] [Google Scholar]
- 2.Zhou YH, Wu C, Zhuang H. Vaccination against hepatitis B: The Chinese experience. Chin Med J. 2009;122(1):98–102. [PubMed] [Google Scholar]
- 3.Yao G. Entecavir is a potent anti-HBV drug superior to lamivudine: Experience from clinical trials in China. J Antimicrob Chemother. 2007;60(2):201–5. doi: 10.1093/jac/dkm175. [DOI] [PubMed] [Google Scholar]
- 4.Servin F, Desmonts JM, Haberer JP, et al. Pharmacokinetics and protein binding of propofol in patients with cirrhosis. Anesthesiology. 1988;69(6):887–91. doi: 10.1097/00000542-198812000-00014. [DOI] [PubMed] [Google Scholar]
- 5.Schywalsky M, Ihmsen H, Knoll R, Schwilden H. Binding of propofol to human serum albumin. Arzneimittelforschung. 2005;55(6):303–6. doi: 10.1055/s-0031-1296863. [DOI] [PubMed] [Google Scholar]
- 6.Kanto J, Gepts E. Pharmacokinetic implications for the clinical use of propofol. Clin Pharmacokin. 1989;17(5):308–26. doi: 10.2165/00003088-198917050-00002. [DOI] [PubMed] [Google Scholar]
- 7.De Cosmo G, Congedo E, Clemente A, Aceto P. Sedation in PACU: The role of propofol. Curr Drug Targets. 2005;6(7):741–44. doi: 10.2174/138945005774574425. [DOI] [PubMed] [Google Scholar]
- 8.Vanlersberghe C, Camu F. Propofol. Handb Exp Pharmacol. 2008;(182):227–52. doi: 10.1007/978-3-540-74806-9_11. [DOI] [PubMed] [Google Scholar]
- 9.Sharma P, Singh S, Sharma BC, et al. Propofol sedation during endoscopy in patients with cirrhosis, and utility of psychometric tests and critical flicker frequency in assessment of recovery from sedation. Endoscopy. 2011;43(5):400–5. doi: 10.1055/s-0030-1256182. [DOI] [PubMed] [Google Scholar]
- 10.Eriksson O, Josephsson R, Langstrom B, Bergstrom M. Positron emission tomography and target-controlled infusion for precise modulation of brain drug concentration. Nucl Med Biol. 2008;35(3):299–303. doi: 10.1016/j.nucmedbio.2007.12.003. [DOI] [PubMed] [Google Scholar]
- 11.Khamaysi I, William N, Olga A, et al. Sub-clinical hepatic encephalopathy in cirrhotic patients is not aggravated by sedation with propofol compared to midazolam: A randomized controlled study. J Hepatol. 2011;54(1):72–77. doi: 10.1016/j.jhep.2010.06.023. [DOI] [PubMed] [Google Scholar]
- 12.Guarracino F, Lapolla F, Cariello C, et al. Target controlled infusion: TCI. Minerva Anestesiol. 2005;71(6):335–37. [PubMed] [Google Scholar]
- 13.Absalom AR, Kenny GN. Closed-loop control of propofol anaesthesia using bispectral index: Performance assessment in patients receiving computer-controlled propofol and manually controlled remifentanil infusions for minor surgery. Br J Anaesth. 2003;90(6):737–41. doi: 10.1093/bja/aeg137. [DOI] [PubMed] [Google Scholar]
- 14.Fanti L, Agostoni M, Arcidiacono PG, et al. Target-controlled infusion during monitored anesthesia care in patients undergoing EUS: Propofol alone versus midazolam plus propofol. A prospective double-blind randomised controlled trial. Dig Liver Dis. 2007;39(1):81–86. doi: 10.1016/j.dld.2006.09.004. [DOI] [PubMed] [Google Scholar]
- 15.Glen JB. The development of ‘Diprifusor’: A TCI system for propofol. Anaesthesia. 1998;53(Suppl 1):13–21. doi: 10.1111/j.1365-2044.1998.53s115.x. [DOI] [PubMed] [Google Scholar]
- 16.Marsh B, White M, Morton N, Kenny GN. Pharmacokinetic model driven infusion of propofol in children. Br J Anaesth. 1991;67(1):41–48. doi: 10.1093/bja/67.1.41. [DOI] [PubMed] [Google Scholar]
- 17.Gepts E, Camu F, Cockshott ID, Douglas EJ. Disposition of propofol administered as constant rate intravenous infusions in humans. Anesth Analg. 1987;66(12):1256–63. [PubMed] [Google Scholar]
- 18.Coetzee JF, Glen JB, Wium CA, Boshoff L. Pharmacokinetic model selection for target controlled infusions of propofol. Assessment of three parameter sets. Anesthesiology. 1995;82(6):1328–45. doi: 10.1097/00000542-199506000-00003. [DOI] [PubMed] [Google Scholar]
- 19.Short TG, Lim TA, Tam YH. Prospective evaluation of pharmacokinetic model-controlled infusion of propofol in adult patients. Br J Anaesth. 1996;76(2):313–15. doi: 10.1093/bja/76.2.313. [DOI] [PubMed] [Google Scholar]
- 20.Pan JR, Cai J, Zhou SL, et al. Pharmacodynamic analysis of target-controlled infusion of propofol in patients with hepatic insufficiency. Biomed Rep. 2016;5(6):693–98. doi: 10.3892/br.2016.786. [DOI] [PMC free article] [PubMed] [Google Scholar]
- 21.Tarantino G, Citro V, Esposito P, et al. Blood ammonia levels in liver cirrhosis: A clue for the presence of portosystemic collateral veins. BMC Gastroenterol. 2009;9:21. doi: 10.1186/1471-230X-9-21. [DOI] [PMC free article] [PubMed] [Google Scholar]
- 22.Munoz HR, Cortinez LI, Ibacache ME, Leon PJ. Effect site concentrations of propofol producing hypnosis in children and adults: Comparison using the bispectral index. Acta Anaesthesiol Scand. 2006;50(7):882–87. doi: 10.1111/j.1399-6576.2006.01062.x. [DOI] [PubMed] [Google Scholar]
- 23.Vuyk J, Mertens MJ, Olofsen E, et al. Propofol anesthesia and rational opioid selection: determination of optimal EC50-EC95 propofol-opioid concentrations that assure adequate anesthesia and a rapid return of consciousness. Anesthesiology. 1997;87(6):1549–62. doi: 10.1097/00000542-199712000-00033. [DOI] [PubMed] [Google Scholar]
- 24.Fan YY, Xu LX, Wen AD, et al. [Determination of propofol in human serum by improved reversed phase high-performance liquid chromatography with fluorescence detection]. Nan Fang Yi Ke Da Xue Xue Bao. 2006;26(10):1510–12. [in Chinese] [PubMed] [Google Scholar]
- 25.Knibbe CA, Koster VS, Deneer VH, et al. Determination of propofol in low-volume samples by high-performance liquid chromatography with fluorescence detection. J Chromatogr B Biomed Sci Appl. 1998;706(2):305–10. doi: 10.1016/s0378-4347(97)00571-9. [DOI] [PubMed] [Google Scholar]
- 26.Vuyk J, Engbers FH, Burm AG, et al. Performance of computer-controlled infusion of propofol: An evaluation of five pharmacokinetic parameter sets. Anesth Analg. 1995;81(6):1275–82. doi: 10.1097/00000539-199512000-00026. [DOI] [PubMed] [Google Scholar]
- 27.Mertens MJ, Engbers FH, Burm AG, Vuyk J. Predictive performance of computer-controlled infusion of remifentanil during propofol/remifentanil anaesthesia. Br J Anaesth. 2003;90(2):132–41. doi: 10.1093/bja/aeg046. [DOI] [PubMed] [Google Scholar]
- 28.Li YH, Xu JH, Yang JJ, et al. Predictive performance of ‘Diprifusor’ TCI system in patients during upper abdominal surgery under propofol/fentanyl anesthesia. J Zhejiang Univ Sci B. 2005;6(1):43–48. doi: 10.1631/jzus.2005.B0043. [DOI] [PMC free article] [PubMed] [Google Scholar]
- 29.Ye HB, Li JH, Rui JZ, et al. Propofol pharmacokinetics in China: A multicentric study. Indian J Pharmacol. 2012;44(3):393–97. doi: 10.4103/0253-7613.96346. [DOI] [PMC free article] [PubMed] [Google Scholar]
- 30.Child CG, Turcotte JG. Surgery and portal hypertension. Major Probl Clin Surg. 1964;1:1–85. [PubMed] [Google Scholar]
- 31.Kaplan DE, Dai F, Aytaman A, et al. Development and performance of an algorithm to estimate the Child-Turcotte-Pugh score from a National Electronic Healthcare Database. Clin Gastroenterol Hepatol. 2015;13(13):2333–41.e1–6. doi: 10.1016/j.cgh.2015.07.010. [DOI] [PMC free article] [PubMed] [Google Scholar]
- 32.Schindhelm RK, Diamant M, Bakker SJ, et al. Liver alanine aminotransferase, insulin resistance and endothelial dysfunction in normotriglyceridaemic subjects with type 2 diabetes mellitus. Eur J Clin Invest. 2005;35(6):369–74. doi: 10.1111/j.1365-2362.2005.01502.x. [DOI] [PubMed] [Google Scholar]
- 33.Claeys MA, Gepts E, Camu F. Haemodynamic changes during anaesthesia induced and maintained with propofol. Br J Anaesth. 1988;60(1):3–9. doi: 10.1093/bja/60.1.3. [DOI] [PubMed] [Google Scholar]
- 34.Purnak T, Yilmaz Y. Liver disease and malnutrition. Best Pract Res Clin Gastroenterol. 2013;27(4):619–29. doi: 10.1016/j.bpg.2013.06.018. [DOI] [PubMed] [Google Scholar]
- 35.Guitton J, Buronfosse T, Desage M, et al. Possible involvement of multiple human cytochrome P450 isoforms in the liver metabolism of propofol. Br J Aaesth. 1998;80(6):788–95. doi: 10.1093/bja/80.6.788. [DOI] [PubMed] [Google Scholar]
- 36.Wu J, Zhu SM, He HL, et al. Plasma propofol concentrations during orthotopic liver transplantation. Acta Anaesthesiol Scand. 2005;49(6):804–10. doi: 10.1111/j.1399-6576.2005.00671.x. [DOI] [PubMed] [Google Scholar]
- 37.Servin F, Cockshott ID, Farinotti R, et al. Pharmacokinetics of propofol infusions in patients with cirrhosis. Br J Anaesth. 1990;65(2):177–83. doi: 10.1093/bja/65.2.177. [DOI] [PubMed] [Google Scholar]
- 38.van den Nieuwenhuyzen MC, Engbers FH, Burm AG, et al. Computer-controlled infusion of alfentanil for postoperative analgesia. A pharmacokinetic and pharmacodynamic evaluation. Anesthesiology. 1993;79(3):481–92. doi: 10.1097/00000542-199309000-00011. discussion 427A. [DOI] [PubMed] [Google Scholar]