Summary
We are now seeing the benefit of investments made over the last decade in high throughput screening (HTS) that is resulting in large structure activity datasets entering public and open databases such as ChEMBL and PubChem. The growth of academic HTS screening centers and the increasing move to academia for early stage drug discovery suggests a great need for the informatics tools and methods to mine such data and learn from it. Collaborative Drug Discovery, Inc (CDD) has developed a number of tools for storing, mining, securely and selectively sharing, as well as learning from such HTS data. We present a new web based data mining and visualization module directly within the CDD Vault platform for high throughput drug discovery data that makes use of a novel technology stack following modern reactive design principles. We also describe CDD Models within the CDD Vault platform that enables researchers to share models, share predictions from models, and create models from distributed, heterogeneous data. Our system is built on top of the Collaborative Drug Discovery Vault Activity and Registration data repository ecosystem which allows users to manipulate and visualize thousands of molecules in real time. This can be performed in any browser on any platform. We will present examples of its use with public datasets in CDD Vault. Such approaches can complement other cheminformatics tools, whether open source or commercial, in providing approaches for data mining and modeling of HTS data.
Keywords: ADME, Bayesian models, CDD Models, CDD Vault, Visualization, Collaborative Database, Datamining
1. Introduction
For well over twenty years, the early stages of modern drug discovery have utilized high throughput screening (HTS) of large libraries using small molecules against target–based assays 1. The approach has also been widely followed by academic screening centers 2–6 which has lead to the identification of hundreds of new chemical probes 7, 8. This approach, while having some failings in several disease areas or targets, most notably antibiotics 9, has led to a shift back to whole cell screening for some disease areas. This also seems to agree with the history of drug discovery in that more drugs were derived from phenotypic approaches 10. The hit rates of these HTS efforts are usually low and below 1% 11–14. The resulting data are iteratively analyzed alongside physicochemical properties, cytotoxicity and any other available data prior to further iterations of testing until an ideal collection of drug candidates is found. This data can also be ultimately used to produce computational models and enable further learning.
Computational approaches have played an increasingly important role in the drug discovery process within large pharmaceutical firms, and now constitute an essential part of drug discovery. Virtual screening of compounds using ligand-based and structure-based methods to predict potency enables more efficient utilization of HTS resources, by enriching the set of compounds physically screened with those more likely to yield hits 15–18. Computation of absorption, distribution, metabolism, excretion and toxicity (ADME/Tox) properties exploiting statistical techniques greatly reduces the number of expensive assays that must be performed, and now makes it practical to consider these factors very early in the discovery process to minimize late stage failures of potent lead compounds that are not drug-like 19–25. Large pharma have successfully integrated these in silico methods into operational practice, validated them, and realized their benefits because these firms have (1) expensive commercial software to build models, (2) large diverse proprietary datasets based on consistent experimental protocols to train and test the models, and (3) extensive computational and medicinal chemistry expertise on staff to run the models and interpret the results. In contrast, drug discovery efforts centered in universities, foundations, government laboratories, and small companies (“extra-pharma”) frequently lack these three critical resources and as a result have yet to exploit the full benefits of these in silico methods. As preclinical academic partnerships are important for both the industry as well as universities (in 2015 there were 236 such deals 26) it will be critical to provide industrial strength computational tools to ensure that early stage pipeline molecules are appropriately filtered before investing in them.
Typical practice in pharma is to integrate in silico predictions into a combined workflow together with in vitro assays to find “hits” that can then be reconfirmed and optimized. The incremental cost of a virtual screen is essentially zero, and the savings compared with a physical screen are magnified if the compound would also need to be synthesized rather than purchased from a vendor. If the blind hit rate against some library is 1% and the in silico model can prefilter the library prospectively, enriching the set of compounds to be tested so the experimental hit rate reaches, say, 2%, then significant resources are freed up to search a broader chemical space, focus more precisely on promising regions, or both 27.
The very high cost of in vivo and in vitro screening of ADME/Tox properties of molecules is a big motivator to develop in silico methods to filter and select a subset of compounds for testing. By relying on very large internally consistent datasets, large pharma has succeeded in developing highly predictive but proprietary ADME models 19–22. At Pfizer, as well as other large pharmaceutical companies, many of these models (e.g. volume of distribution, aqueous kinetic solubility, acid dissociation constant, distribution coefficient) 19–22, 28 have achieved such high accuracy that they could be considered competitors to the experimental assays. In most other cases, large pharmaceutical companies perform experimental assays for a small fraction of compounds of interest to augment or validate their computational models. Extra-pharma efforts have not been so successful, largely because they have by necessity drawn upon smaller datasets, in a few cases trying to combine them 25, 29–34. However, public datasets in ChEMBL 35, 36,36–38, PubChem39, 40, EPA Tox21 41, ToxCast42, 43, public datasets in the Collaborative Drug Discovery, Inc. (CDD) Vault 44, 45 and elsewhere are becoming available and used for modeling. 46–48
2. Materials
There have been several efforts describing different data mining 49 and machine learning approaches used with HTS datasets (e.g. reporter gene assays, whole cell phenotypic screens etc.) over the past decade alone, illustrated with the following examples.
2.1. Data mining tools
In 2006 Yan et al., published their experiences of data mining from millions of compounds over hundreds of assays. Their development of ontology-based pattern identification was described, as well as scaffold families with structure-HTS relationships, with a focus on finding artifactual results 50. Crisman et al., took the identification of false positives in reporter gene assays further by building Bayesian machine learning models with 650,000 molecules tested in these assays at Novartis. This resulted in frequent hitter models. These authors also predicted the target families for the frequent hitters, as well as suggested that compounds producing reduced luciferase signals as a readout, such as those compounds inhibiting the cell cycle, would in turn be a source of false positives. Experimental validation was also performed showing an enrichment over random screening 51. A quantitative HTS screen of a chemical collection against an IL-6 reporter gene assay is typical of many studies, in this case using Leadscope fingerprints and hierarchical clustering, identifying 5 scaffolds as potential artifacts as they had activity in cells lacking the β-lactamase reporter 52. Several different machine learning algorithms have been used for data mining including decision tree models; a recent review discussed their use in HTS as well as for ADME/Tox properties suggesting their interpretability was an advantage 53. Open source Java software called screening assistant 2 54 was developed for storage and analysis of very large HTS libraries. The use of this software was illustrated on very large libraries of 15 million vendor molecules as well as smaller kinase libraries, for which physicochemical properties and scaffold analysis was performed 54. An example of data mining in large databases is for Basic Active Structures (BAS) that are substructures which are indicative of biological activity 55. As the number of hits in databases is small, there is a huge imbalance in favor of inactive compounds, which makes it hard to extract substructures of actives. A workflow was demonstrated using random sampling and applied to several datasets such as HIV integrase, HIV-protease and procaspase-3 from PubChem and MDDR databases 55. This approach seems very reminiscent of using extended connectivity fingerprints with Bayesian algorithms. Another recent study dealing with the active / inactive imbalance in HTS datasets developed a method called DRAMOTE for data prepocessing which is an active learning approach focused on using HTS data to predict activity 56. This approach was demonstrated on various PubChem datasets showing improved precision for more than half the datasets 56. A new database called the BioAssay Research Database (BARD) was described in 2015 for housing screening data for probe development which uses a controlled vocabulary to describe the assay protocols. While this database is free and open-source, it relies on several non–open source components that require licenses 57. A linked hierarchy visualization in the database shows the distribution of biological process terms for a molecule and allows a linked approach to data mining. It is suggested that the restricted vocabulary used in BARD would make new datasets more powerful 57.
2.2. Visualization in CDD Vault
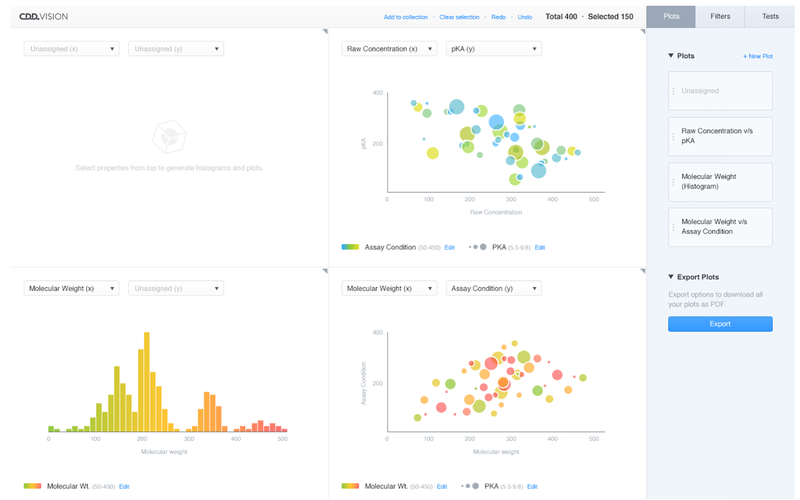
Processing HTS results is tedious and complex, as the vast amount of data involved tends to be multidimensional, and may well contain missing data or have other irregularities. CDD have recently developed more sophisticated visualization capabilities in CDD Vault which address these problems by providing a suite of modern web-based data visualization tools that generate publication quality data graphics. By making use of a variety of web technologies, including WebGL and SVG, the system allows users to manipulate and visualize hundreds of thousands of points in real time across an arbitrary number of dimensions. A representation of our implementation of this methodology is shown in Figure 1 in which selected molecules and data are taken from CDD Vault and utilized in the new Visualization module.
Figure 1.
A flowchart of the user experience flow of the Visualization application in CDD Vault. DOI: 10.6084/m9.figshare.3206266
We provide a collection of plots (initially scatterplots and histograms) in the main area which shows a general picture of the data. Much of the power of these plots, in addition to their utilization of the traditional spatial, color, and size variables, comes from their relative awareness of their position in the ambient higher dimensional space.
CDD visualization can be used as follows:
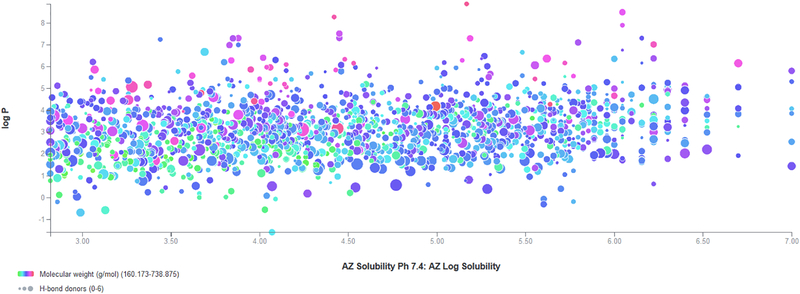
For instance, by representing both the selected and unselected points the user is able to visually measure the role of a given point in the larger space, such as a scatterplot utilizing these properties (Figure 2).
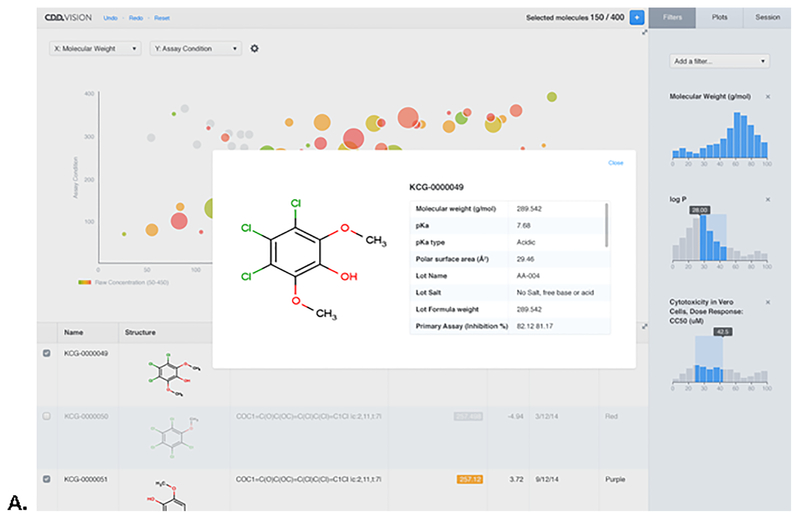
The data in these plots can then be manipulated by either adjusting the filters on the right side of the page, or by click and dragging directly on the plots themselves (Figure 3).
If the user wishes to know more about a given molecule or compound they can select it or find it in the data table.
Once the user is satisfied with their curation of the plots, they can export their selection to a pdf, or send the collection of molecules back to CDD Vault 44, where it can be used to develop machine learning models using CDD Models 46–48, or shared securely among other collaborators. In constructing our technology stack we attempted to solve three major problems:
Drug discovery data is often multidimensional and irregular 58, Data exploration is greatly aided by the ability to quickly undo and redo actions,User directed data mining and exploration is most effective when the feedback response loop is minimized to as close to real time as possible.
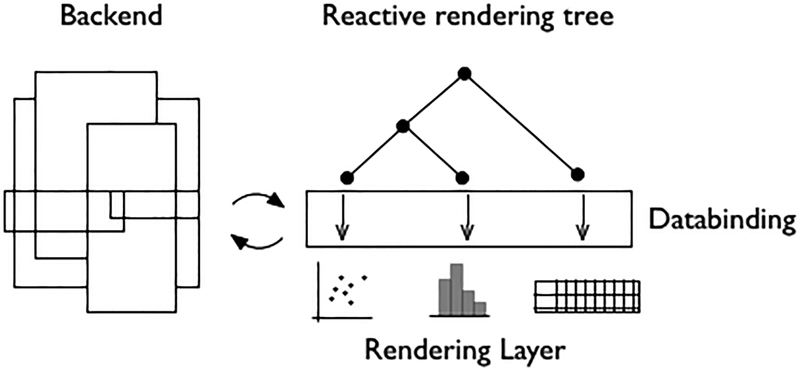
We found that the most effective way to address these constraints in a web context involved implementing a JavaScript application with a reactive architecture (Figure 4).
The CDD Vault Visualization module therefore represents a new tool that allows users to explore and present data via an intuitive user interface. It is a modular platform, and is able to support a wide variety of visualizations with high performance results.
Figure 2.
A sample plot from the Visualization Module in CDD Vault using Astra Zeneca public solubility data from ChEMBL on 1763 compounds showing the relationship with calculated molecular properties. DOI: 10.6084/m9.figshare.3206266
Figure 3.
A. Screenshot of the new Visualization capabilities in CDD Vault, showing The Broad Chagas disease dose response dataset that was used in a recent study by us to build a Bayesian machine learning model [2]. B. A screenshot showing highlighting of structures and filtering of data (right of screen). DOI: 10.6084/m9.figshare.3206266
Figure 4.
A flowchart of the technical structure of the Visualization module in CDD Vault. The backend is formed using Immutable and Crossfilter.js, the data binding layer is constructed using d3.js and jQuery, and finally the rendering layer makes use of d3.js and Pixi.js. DOI: 10.6084/m9.figshare.3206266
2.3. CDD Models
Recently a novel web-based software capability (CDD Models) was developed within the CDD Vault that enables scientists to work together effectively to discover and improve new drug leads, with the option not to reveal chemical structures to each other. Our goal was to create the first practical system of biocomputational analysis across distributed datasets with different owners, while respecting data privacy, thus lowering the key barrier to collaboration. Using models to accelerate the pre-clinical drug discovery pipeline will enable groups to effectively exploit state-of-the-art computational tools such as bioactivity, ADME/Tox predictions and virtual screening. This will also make it easier for researchers both outside and inside pharma and biotech to collaborate and benefit from high-quality datasets derived from big pharma.
This work was initiated when we collaborated with computational chemists at Pfizer in a proof of concept study which demonstrated that models constructed with open descriptors and keys (CDK+SMARTS) using open software (C5.0), performed essentially identically to expensive proprietary descriptors and models (MOE2D+SMARTS+Rulequest’s Cubist) across all metrics of performance, when evaluated on multiple Pfizer-proprietary ADME datasets: human liver microsomal stability (HLM), RRCK passive permeability, P-gp efflux, and aqueous solubility 59. Pfizer’s HLM dataset, for example, contained more than 230,000 compounds and covered a diverse range of chemistry as well as many therapeutic areas. The HLM dataset was split into a training set (80%) and a test set (20%) using the venetian blind splitting method; in addition, a newly screened set of 2310 compounds was evaluated as a blind dataset. All the key metrics of model performance e.g. R2, RMSE, kappa, sensitivity, specificity, positive predictive value (PPV) were nearly identical for the open-source approach vs. proprietary software (e.g. PPV of 0.80 vs. 0.82). The open-source approach even computed slightly faster (0.2 vs 0.3 s/compound). All of the datasets studied yielded the same conclusion that models built with open descriptors and models were as predictive as the commercial tools. Following this we proved the value of commercially available Bayesian algorithm and extended connectivity fingerprints in Discovery Studio (Biovia, San Diego, CA) by successfully predicting in advance which subsets of compound libraries our collaborators should screen. Each of the tuberculosis (TB) research groups we collaborated with (Infectious Disease Research Institute, UMDNJ-NJMS and Southern Research Institute) used computational models we created to identify new lead compounds for tuberculosis while saving significant time and expense. The models resulted in prospective potency predictions and achieved screening hit rates of 15–71% for suggested compounds, far higher than the 0.6 – 1.5% typical for random library HTS screening. This work was subsequently published 60–62 and we extended this approach to lead optimization 63 and dataset fusion alongside evaluation of other machine learning algorithms 64 to evaluate whether bigger models were better 6. We also demonstrated how machine learning methods could be used to predict in vivo activity in the mouse model for testing for efficacy against Mycobacterium tuberculosis 65. More recently we have applied the Bayesian machine learning approach to identify leads and repurpose drugs for Chagas disease 66 and Ebola 67.
CDD created a drop-in replacement for the extended connectivity fingerprints of maximum diameter 6 (ECFP6) and molecular function class fingerprints of maximum diameter 6 (FCFP6) fingerprints and the resulting code was made available to the public as a feature in the Chemical Development Kit (CDK) project under an open source license (https://github.com/cdd/modified-bayes). We coded the Bayesian algorithm with these fingerprints and implemented it in CDD Models. This allowed us to deliver a foundational platform for selective, secure distributed model generation and execution, including a toolkit based on open-source algorithms and descriptors. We have applied CDD Models to modeling decision making for chemical probes 8, ADME-Tox models 9 as well models of microsomal stability in mouse 68. The open source descriptors and Bayesian algorithm have also been used outside of CDD Vault to create several thousand Bayesian models with the ChEMBL data 10 as well as Bayesian models for human drug transporters 69 which could be useful for drug discovery and making these models more mobile. This also shows how developing the open source technologies could benefit others outside of CDD and stimulate new technology development. More recently we have developed a Bayesian binning approach which is a step towards semi-quantitative Bayesian models 47.
3. Methods
3.1. Applications of data mining and machine learning in CDD
We have made use of several public datasets to indicate how they can be used in CDD (or elsewhere) for data mining or machine learning with CDD Models and other methods.
Machine learning models
Bayesian models can be generated using the open source FCFP6 descriptors 70 alone in CDD Models (Collaborative Drug Discovery Inc. Burlingame, CA) 46 and at the same time perform a 3 fold cross validation.
Where possible, we validated the models with an external test set and generated receiver operator (ROC) plots.
We have previously described the generation and validation of the Laplacian-corrected Bayesian classifier models developed for various datasets using Discovery Studio 3.5 or 4.1 71. This approach has been utilized with the datasets for predicting selectivity. A set of simple molecular descriptors were used: FCFP_6 (Discovery Studio version of this descriptor) 72, AlogP, molecular weight (MW), number of RB, number of rings, number of aromatic rings, number of HBA, number of HBD, and molecular fractional polar surface area were calculated from input SD files.
Models were validated using leave-one-out cross-validation in which each sample was left out one at a time, a model was built using the remaining samples, and that model was utilized to predict the left-out sample. Each of the models were internally validated, receiver operator (ROC) plots were generated, and the cross validated (XV) ROC area under the curve (AUC) calculated. The Bayesian model was additionally evaluated by performing 5 fold cross validation in which 20% of the dataset is left out 5 times.
Abbott kinase inhibitors dataset
We have evaluated whether FCFP_6 descriptors and a Naïve Bayesian algorithm could be used to predict selectivity for a large-scale kinome-wide dataset made available by Abbott Laboratories, with data on more than 1487 molecules against 172 kinases 73 available in CDD Vault (https://app.collaborativedrug.com/register).
For each compound, a promiscuity value was calculated, defined as the fraction of kinases tested for which the compound had a potency value of 1μM or less. In the original study 73, the authors found that compounds with more HBD or HBA were more likely to be promiscuous.
For our Bayesian model, the 1487 molecules with disclosed structures were used and a cut-off for promiscuity of 0.3 was applied.
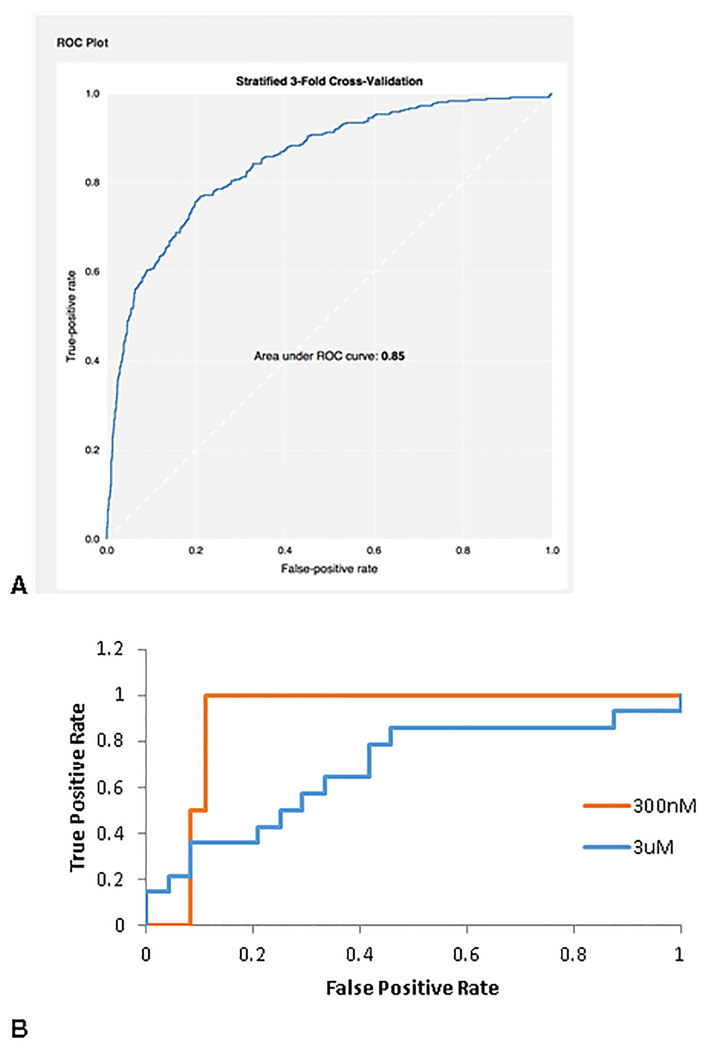
Using 3-fold cross validation in CDD Models, this Bayesian model led to a receiver operator characteristic (ROC) value of 0.85 (Fig 5A,).
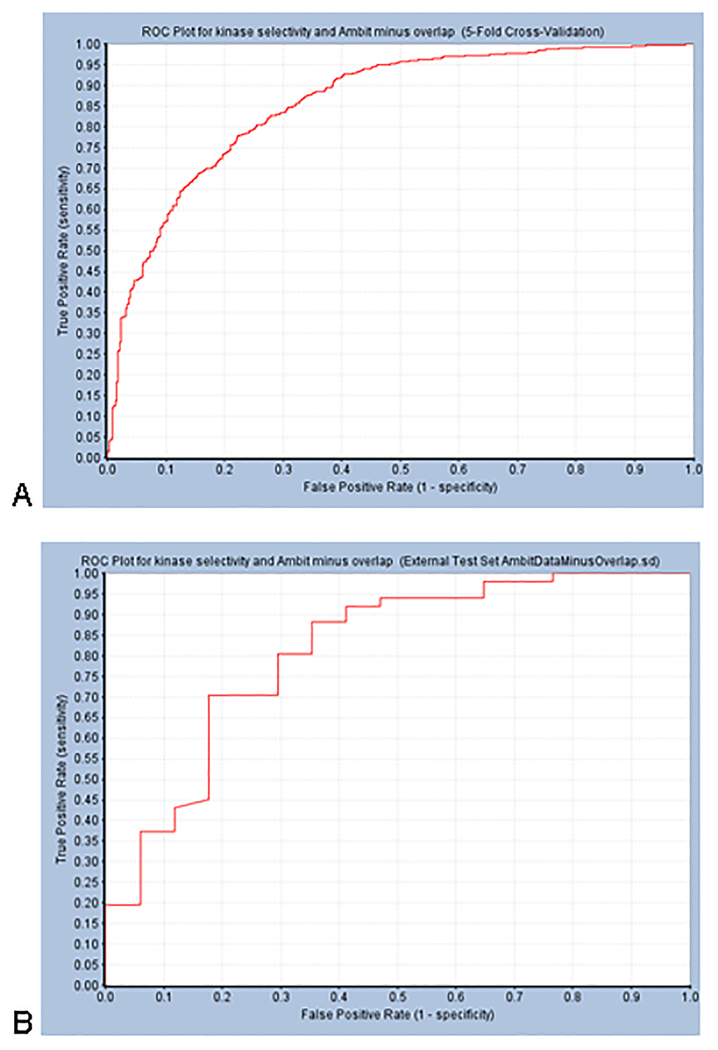
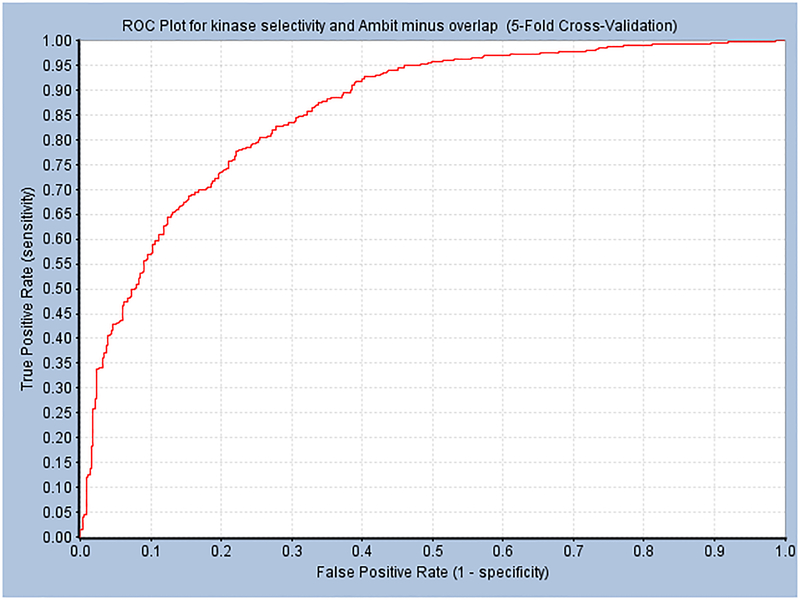
When the model was built with additional simple descriptors as well as FCFP_6 fingerprints (in Discovery Studio), a 5 fold cross validation ROC was equivalent (Fig 6, Table 1).
We then used the kinase selectivity values determined by Ambit for 72 74 compounds as an external test set to assess the predictions of these models.
It was found that when the cut off for selectivity fraction was set at 0.3, the test ROC value was 0.9 (Figure 5B) when compounds were tested at 300nM, while the ROC was 0.68 when compounds were tested at 3 μM (Fig. 5B).
A model was also built using Discovery Studio which gave a test set ROC of 0.81 at 300nM (Figure 6, Table 1).
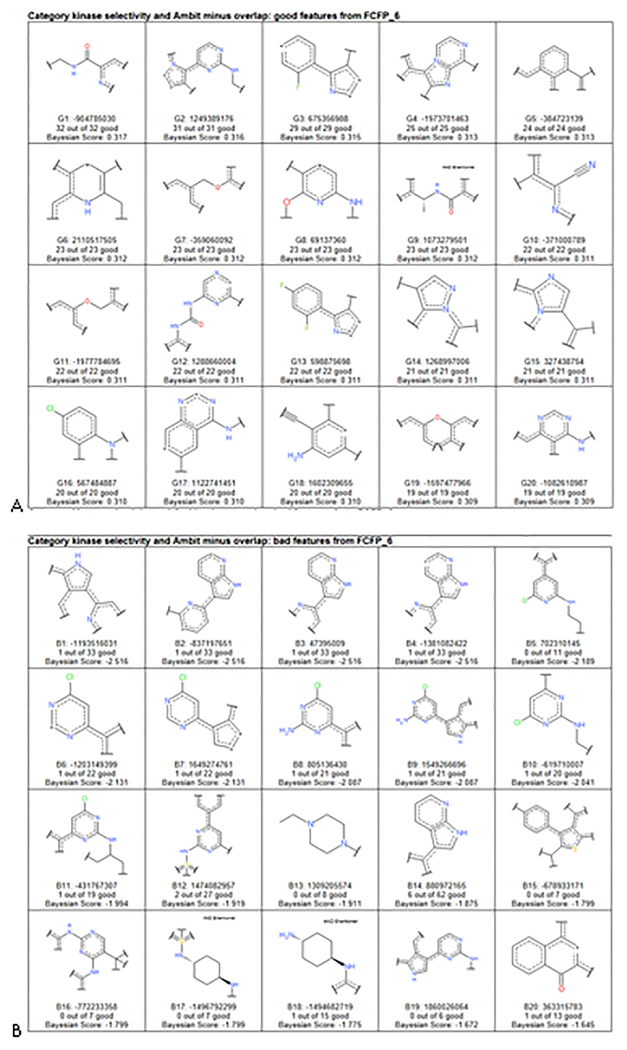
Good kinase selectivity model fingerprint features included nitrogen-rich heterocyclic, substituted anilines, and generally rigid fragments (Figure 7A). In contrast, the bad kinase selectivity fingerprint features included moieties with multiple positive charges that may reduce selectivity (Figure 7B). These results suggest that such selectivity models are predictive for external compounds, and could be a useful filter for selecting kinase inhibitors.
Figure 5.
Receiver Operator Characteristic plots for CDD Bayesian model with FCFP6 descriptors only after 3 fold cross validation for predicting selectivity in kinases using Abbott Laboratories data 73. A. training set B. The test set ROC for 2 different cutoffs using 39 compounds from the Ambit dataset not found in the training set from the Abbot dataset 74. DOI: 10.6084/m9.figshare.3206266
Figure 6.
Receiver Operator Characteristic plots for Discovery Studio Bayesian Models for Kinase Selectivity using Abbott Laboratories data 73 – minus overlapping compounds in Ambit dataset 74. Descriptors used: ALogP, FCFP_6, Molecular Weight, Number of Aromatic Rings, Number of H-Bond Acceptors, Number of H-Bond Donors, Number of Rings, Number of Rotatable Bonds, and Molecular Fractional Polar Surface Area. Selectivity values less than 0.3 = active. The Ambit dataset was used as a test set after removal of overlapping compounds. A. Training Set. ROC score 0.870 (leave-one-out). Best cutoff for this model is −2.624. B. Test Set ROC = 0.81 (Confusion Matrix: True Positives = 44, False Negatives = 7, False Positives = 6, True Negatives = 11). DOI: 10.6084/m9.figshare.3206266
Table 1.
Model statistics for Discovery Studio Bayesian Models for Kinase Selectivity A. training set B test set minus overlapping compounds in Ambit.
| A. Training set | |||||||||
| 5-Fold Cross-Validation Result | |||||||||
| Model Name | ROC Score | ROC Rating | True Positive | False Negative | False Positive | True Negative | Sensitivity | Specificity | Concordance |
| kinase selectivity and Ambit minus overlap | 0.858 | Good | 941 | 167 | 37 | 352 | 0.849 | 0.905 | 0.864 |
| A. Test Set | |||||||||
| Validation Result Using External Test Set AmbitDataMinusOverlap.sd | |||||||||
| Model Name | ROC Score | ROC Rating | True Positive | False Negative | False Positive | True Negative | Sensitivity | Specificity | Concordance |
| kinase selectivity and Ambit minus overlap | 0.813 | Good | 44 | 7 | 6 | 11 | 0.863 | 0.647 | 0.809 |
Figure 7.
A. Good Kinase selectivity model good fingerprints B Kinase selectivity model bad fingerprints. DOI: 10.6084/m9.figshare.3206266
Broad 100 protein binding dataset
Following the results with the Abbott Kinase dataset, the approaches for predicting selectivity were evaluated for applicability across other proteins.
A Bayesian machine learning model was built with more than 15,000 compounds with binding data for 100 different proteins, (not just limited to kinases) 75. This dataset is also available as a public dataset in the CDD Vault.
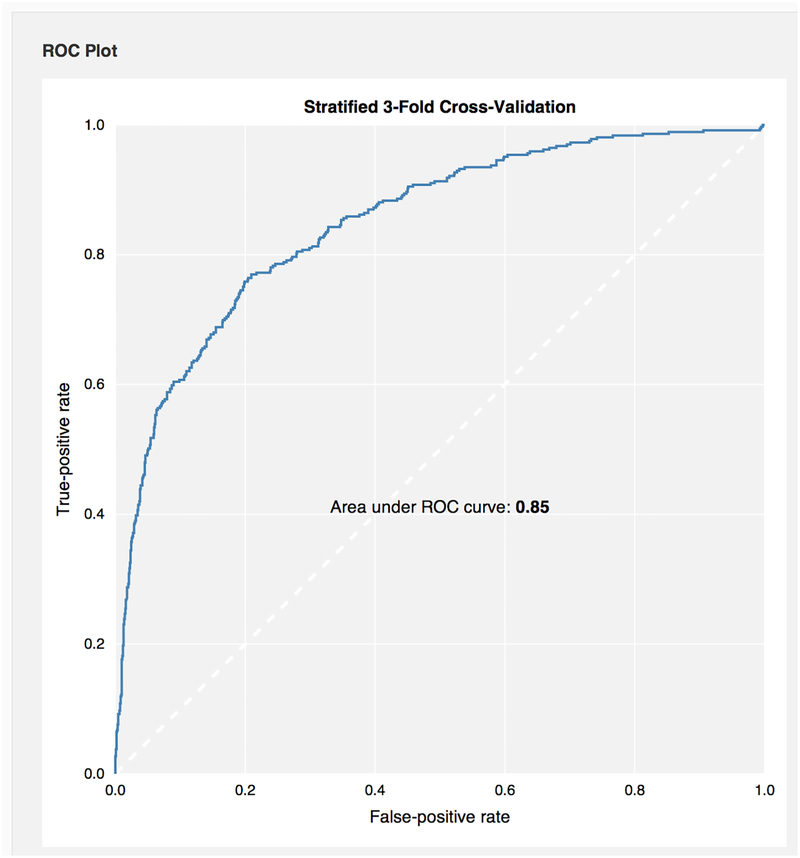
The cutoff for this model was 0.05 and the resulting 3-fold cross validation ROC value was 0.78 (Fig. 8). Similar results were obtained using a Bayesian model in Discovery Studio, (Fig 9, Table 2).
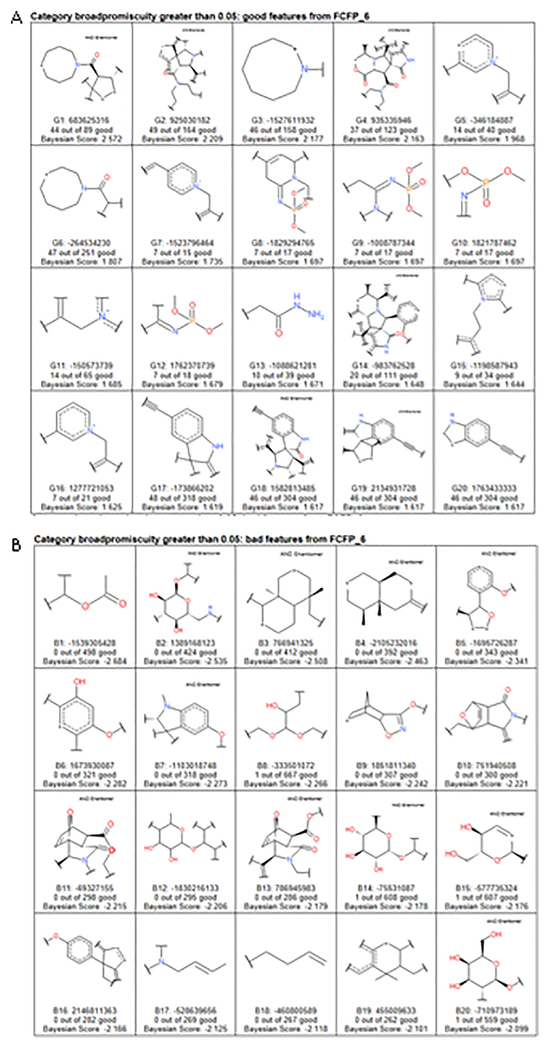
We have also identified the good and bad fingerprints for this model (Fig 10) Good fingerprint features include complex natural-product, macrocyclic, and biomimetic functionality. In contrast, the bad features include hydrolytically labile functionality, as well as flexible cyclic and acyclic aliphatic functional groups.
Together, this suggests that it is possible to glean biological promiscuity trends based on machine learning models using FCFP_6 fingerprints alone or in combination with other simple descriptors. These types of models could also complement other calculations for molecules which we have described recently76. More datasets with known drug discovery methods would provide additional confidence in the statistical significance of the results, and further validate the initial trends. For example there has been considerable numbers of studies attempting to understand kinase selectivity 74, 77–80 in order to avoid off target effects and to understand function. These examples show that learning from some of these datasets can also help predict kinase selectivity. In general, such machine learning approaches can be applied across different proteins and HTS datasets and aid in molecule selection or scoring.
Figure 8.
Receiver Operator Characteristic plot for CDD Bayesian model with FCFP6 descriptors only after 3 fold cross validation. Promiscuity of compounds binding to proteins using ~15,000 compounds 75. with binding data to 100 different proteins. DOI: 10.6084/m9.figshare.3206266
Figure 9.
Receiver Operator Characteristic plot for Discovery Studio Model of promiscuity of compounds binding to proteins using ~15,000 compounds 75 with binding data to 100 different proteins. The following descriptors were used: ALogP, FCFP_6, Molecular Weight, Number of Aromatic Rings, Number of H-Bond Acceptors, Number of H-Bond Donors, Number of Rings, Number of Rotatable Bonds, and Molecular Fractional Polar Surface Area. The cutoff for this model was 0.05. ROC score is 0.784 (leave-one-out). Best cutoff for this model is −0.560. DOI: 10.6084/m9.figshare.3206266
Table 2.
Model statistics for Discovery Studio Bayesian Model after 5 fold cross validation for > 15,000 compounds with binding data to 100 different proteins.
| 5-Fold Cross-Validation Result | |||||||||
| Model Name | ROC Score | ROC Rating | True Positive | False Negative | False Positive | True Negative | Sensitivity | Specificity | Concordance |
| broadpromiscuity greater than 0.05 | 0.778 | Fair | 366 | 52 | 3384 | 11444 | 0.876 | 0.772 | 0.775 |
Figure 10.
A. ~15,000 compounds with binding data to 100 different proteins good fingerprints B. ~15,000 compounds with binding data to 100 different proteins bad fingerprints. DOI: 10.6084/m9.figshare.3206266
Conclusion
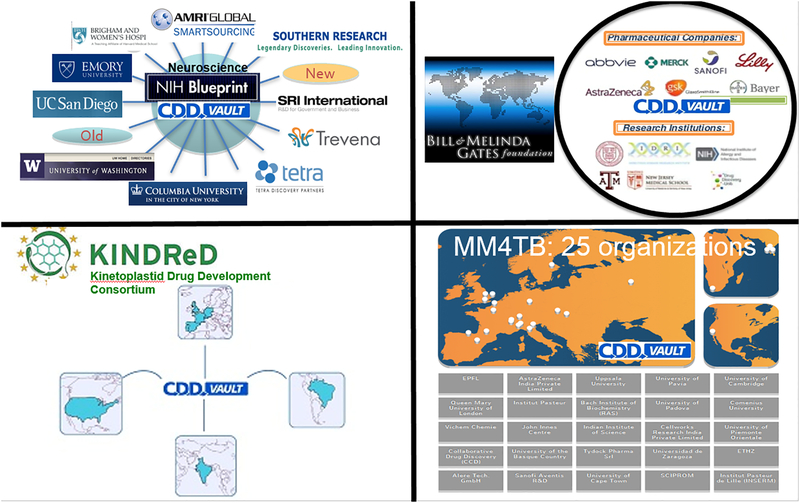
In the preceding decade a major transformation has occurred in the pharmaceutical industry which has had to adapt by acquiring companies or partnering with other companies or academic groups to bring in early preclinical innovation or products 81. We have previously discussed the shift in HTS from industry to academia and the potential bottlenecks and issues this creates 2 around data quality 8, 71. We and others have also described the need for informatics for public-private collaborations in the precompetitive space 44, 45,82 as exemplified by projects such as the NIH Blueprint, Bill and Melinda Gates Foundation TB drug accelerator, Kinetoplastid drug development consortium and More Medicines for Tuberculosis (Fig 11). There is also an increasing shift to the cloud for such collaborative projects e.g. the European Lead Factory 82. Key issues for all of these efforts (in which there is a big HTS component) is securing intellectual property, masking molecule structures in some cases, and selective sharing with only select members of a consortia.
Figure 11.
Examples of Collaborative Drug Discovery Vault used in large public-private collaborations. DOI: 10.6084/m9.figshare.3206266
In the process of developing CDD Vault, we have introduced improved visualization software that enables interactive graphing with multiple plot types, data mining and publication quality outputs as described for the Visualization Module in CDD Vault. Our approach builds on past ideas on data visualization and mining to produce a scientifically rigorous dashboard for drug discovery data, and suggests that these techniques might also be applicable to any field which has multidimensional data. Such approaches could also be useful for ‘Big Data’ set analysis. The Visualization module in the CDD Vault represents a new tool that is complete unto itself, in that it allows users to explore and present data. It is a modular platform, and can support a wide variety of visualizations with ease. Future work includes tools for visually presenting both statistical and chemical clustering in formats including dendrograms and heatmaps.
Big pharma has looked at the key chronic diseases in the western hemisphere. Yet if we think about healthcare from a global perspective there are still diseases (e.g. neglected) that are common in the developing world that can in many cases be readily treated with available drugs. Also there are thousands of diseases that occur in small patient populations and are not addressed by any treatments 83, these are classed as rare or orphan diseases. Neglected and rare diseases traditionally have not been the focus of big pharma, while biotech and academia have been primarily involved in their drug discovery. Our work aims to circumvent these limitations so that extra-pharma discovery projects can benefit from current and emerging best industry software informatics practices. CDD now enables extra-pharma drug discovery projects to benefit from proprietary, commercial ADME/Tox and other models in CDD Models within the CDD Vault and will also enable academic and commercial models from multiple parties to be securely integrated without the need to share underlying data. We will likely add additional flexibility in terms of algorithms, descriptors and methods for assessing applicability of the models used. Providing CDD Models in the CDD Vault environment enables users to build models with private and or public data and make predictions which can be used to make decisions as to which molecules to make or buy. These technologies for data mining and modeling are within reach of non-cheminformatics experts in academia and small companies, which should help level the playing field for drug discovery.
Acknowledgments
We acknowledge that the Bayesian model software within CDD was developed with support from Award Number 9R44TR000942–02 “Biocomputation across distributed private datasets to enhance drug discovery” from the NIH NCATS. The CDD TB has been developed thanks to funding from the Bill and Melinda Gates Foundation (Grant#49852 “Collaborative drug discovery for TB through a novel database of SAR data optimized to promote data archiving and sharing”). The work was partially supported by a grant from the European Community’s Seventh Framework Program (grant 260872, MM4TB Consortium) to SE. SE gratefully acknowledges Biovia (formerly Accelrys) for providing Discovery Studio and Dr. Alexander Perryman and Dr. Joel Freundlich for their feedback and collaboration on CDD models. We sincerely acknowledge our many colleagues, collaborators and advocates who have contributed to the development of CDD over the years.
References
- 1.Macarron R; Banks MN; Bojanic D; Burns DJ; Cirovic DA; Garyantes T; Green DV; Hertzberg RP; Janzen WP; Paslay JW; Schopfer U; Sittampalam GS , Impact of High-Throughput Screening in Biomedical Research. Nat Rev Drug Discov 2011, 10, 188–195. [DOI] [PubMed] [Google Scholar]
- 2.Ekins S; Waller CL; Bradley MP; Clark AM; Williams AJ, Four Disruptive Strategies for Removing Drug Discovery Bottlenecks Drug Disc Today 2013, 18, 265–271. [DOI] [PubMed] [Google Scholar]
- 3.Oprea TI; Bologa CG; Boyer S; Curpan RF; Glen RC; Hopkins AL; Lipinski CA; Marshall GR; Martin YC; Ostopovici-Halip L; Rishton G; Ursu O; Vaz RJ; Waller C; Waldmann H; Sklar LA, A Crowdsourcing Evaluation of the Nih Chemical Probes. Nat Chem Biol 2009, 5, 441–447. [DOI] [PMC free article] [PubMed] [Google Scholar]
- 4.Roy A; McDonald PR; Sittampalam S; Chaguturu R, Open Access High Throughput Drug Discovery in the Public Domain: A Mount Everest in the Making. Curr Pharm Biotechnol 2010, 11, 764–778. [DOI] [PMC free article] [PubMed] [Google Scholar]
- 5.Kaiser J, National Institutes of Health. Drug-Screening Program Looking for a Home. Science 2011, 334, 299. [DOI] [PubMed] [Google Scholar]
- 6.Frye S; Crosby M; Edwards T; Juliano R, Us Academic Drug Discovery. Nat Rev Drug Discov 2011, 10, 409–410. [DOI] [PMC free article] [PubMed] [Google Scholar]
- 7.Arrowsmith CH; Audia JE; Austin C; Baell J; Bennett J; Blagg J; Bountra C; Brennan PE; Brown PJ; Bunnage ME; Buser-Doepner C; Campbell RM; Carter AJ; Cohen P; Copeland RA; Cravatt B; Dahlin JL; Dhanak D; Edwards AM; Frederiksen M; Frye SV; Gray N; Grimshaw CE; Hepworth D; Howe T; Huber KV; Jin J; Knapp S; Kotz JD; Kruger RG; Lowe D; Mader MM; Marsden B; Mueller-Fahrnow A; Muller S; O’Hagan RC; Overington JP; Owen DR; Rosenberg SH; Roth B; Ross R; Schapira M; Schreiber SL; Shoichet B; Sundstrom M; Superti-Furga G; Taunton J; Toledo-Sherman L; Walpole C; Walters MA; Willson TM; Workman P; Young RN; Zuercher WJ, The Promise and Peril of Chemical Probes. Nat Chem Biol 2015, 11, 536–541. [DOI] [PMC free article] [PubMed] [Google Scholar]
- 8.Litterman N; Lipinski CA; Bunin BA; Ekins S, Computational Prediction and Validation of an Expert’s Evaluation of Chemical Probes. J Chem Inf Model 2014, 54, 2996–3004. [DOI] [PMC free article] [PubMed] [Google Scholar]
- 9.Payne DA; Gwynn MN; Holmes DJ; Pompliano DL, Drugs for Bad Bugs: Confronting the Challenges of Antibacterial Discovery. Nat Rev Drug Disc 2007, 6, 29–40. [DOI] [PubMed] [Google Scholar]
- 10.Wassermann AM; Camargo LM; Auld DS, Composition and Applications of Focus Libraries to Phenotypic Assays. Front Pharmacol 2014, 5, 164. [DOI] [PMC free article] [PubMed] [Google Scholar]
- 11.Mak PA; Rao SP; Ping Tan M; Lin X; Chyba J; Tay J; Ng SH; Tan BH; Cherian J; Duraiswamy J; Bifani P; Lim V; Lee BH; Ling Ma N; Beer D; Thayalan P; Kuhen K; Chatterjee A; Supek F; Glynne R; Zheng J; Boshoff HI; Barry CE 3rd; Dick T; Pethe K; Camacho LR, A High-Throughput Screen to Identify Inhibitors of Atp Homeostasis in Non-Replicating Mycobacterium Tuberculosis. ACS Chem Biol 2012, 7, 1190–1197. [DOI] [PMC free article] [PubMed] [Google Scholar]
- 12.Stanley SA; Grant SS; Kawate T; Iwase N; Shimizu M; Wivagg C; Silvis M; Kazyanskaya E; Aquadro J; Golas A; Fitzgerald M; Dai H; Zhang L; Hung DT, Identification of Novel Inhibitors of M. Tuberculosis Growth Using Whole Cell Based High-Throughput Screening. ACS Chem Biol 2012, 7, 1377–1384. [DOI] [PMC free article] [PubMed] [Google Scholar]
- 13.Gold B; Pingle M; Brickner SJ; Shah N; Roberts J; Rundell M; Bracken WC; Warrier T; Somersan S; Venugopal A; Darby C; Jiang X; Warren JD; Fernandez J; Ouerfelli O; Nuermberger EL; Cunningham-Bussel A; Rath P; Chidawanyika T; Deng H; Realubit R; Glickman JF; Nathan CF, Nonsteroidal Anti-Inflammatory Drug Sensitizes Mycobacterium Tuberculosis to Endogenous and Exogenous Antimicrobials. Proc Natl Acad Sci U S A 2012, 109, 16004–16011. [DOI] [PMC free article] [PubMed] [Google Scholar]
- 14.Magnet S; Hartkoorn RC; Szekely R; Pato J; Triccas JA; Schneider P; Szantai-Kis C; Orfi L; Chambon M; Banfi D; Bueno M; Turcatti G; Keri G; Cole ST, Leads for Antitubercular Compounds from Kinase Inhibitor Library Screens. Tuberculosis (Edinb) 2010, 90, 354–360. [DOI] [PubMed] [Google Scholar]
- 15.Oprea TI; Matter H, Integrating Virtual Screening in Lead Discovery. Curr Opin Chem Biol 2004, 8, 349–358. [DOI] [PubMed] [Google Scholar]
- 16.Ekins S; Mestres J; Testa B, In Silico Pharmacology for Drug Discovery: Applications to Targets and Beyond. Br J Pharmacol 2007, 152, 21–37. [DOI] [PMC free article] [PubMed] [Google Scholar]
- 17.Ekins S; Mestres J; Testa B, In Silico Pharmacology for Drug Discovery: Methods for Virtual Ligand Screening and Profiling. Br J Pharmacol 2007, 152, 9–20. [DOI] [PMC free article] [PubMed] [Google Scholar]
- 18.McGaughey GB; Sheridan RP; Bayly CI; Culberson JC; Kreatsoulas C; Lindsley S; Maiorov V; Truchon JF; Cornell WD, Comparison of Topological, Shape, and Docking Methods in Virtual Screening. J Chem Inf Model 2007, 47, 1504–1519. [DOI] [PubMed] [Google Scholar]
- 19.Lombardo F; Obach RS; Dicapua FM; Bakken GA; Lu J; Potter DM; Gao F; Miller MD; Zhang Y, A Hybrid Mixture Discriminant Analysis-Random Forest Computational Model for the Prediction of Volume of Distribution of Drugs in Human. J Med Chem 2006, 49, 2262–2267. [DOI] [PubMed] [Google Scholar]
- 20.Lombardo F; Obach RS; Shalaeva MY; Gao F, Prediction of Human Volume of Distribution Values for Neutral and Basic Drugs. 2. Extended Data Set and Leave-Class-out Statistics. J Med Chem 2004, 47, 1242–1250. [DOI] [PubMed] [Google Scholar]
- 21.Lombardo F; Obach RS; Shalaeva MY; Gao F, Prediction of Volume of Distribution Values in Humans for Neutral and Basic Drugs Using Physicochemical Measurements and Plasma Protein Binding. J Med Chem 2002, 45, 2867–2876. [DOI] [PubMed] [Google Scholar]
- 22.Lombardo F; Shalaeva MY; Tupper KA; Gao F, Elogdoct: A Tool for Lipophilicity Determination in Drug Discovery. 2 Basic and Neutral Compounds. J Med Chem 2001, 44, 2490–2497. [DOI] [PubMed] [Google Scholar]
- 23.Lombardo F; Blake JF; Curatolo WJ, Computation of Brain-Blood Partitioning of Organic Solutes Via Free Energy Calculations. J Med Chem 1996, 39, 4750–4755. [DOI] [PubMed] [Google Scholar]
- 24.Lipinski CA; Lombardo F; Dominy BW; Feeney PJ, Experimental and Computational Approaches to Estimate Solubility and Permeability in Drug Discovery and Development Settings. Adv Drug Del Rev 1997, 23, 3–25. [DOI] [PubMed] [Google Scholar]
- 25.Ekins S; Ring BJ; Grace J; McRobie-Belle DJ; Wrighton SA, Present and Future in Vitro Approaches for Drug Metabolism. J Pharm Tox Methods 2000, 44, 313–324. [DOI] [PubMed] [Google Scholar]
- 26.Huggett B, Academic Partnerships 2015. Nat Biotechnol 2016, 34, 372. [DOI] [PubMed] [Google Scholar]
- 27.Zientek M; Stoner C; Ayscue R; Klug-McLeod J; Jiang Y; West M; Collins C; Ekins S, Integrated in Silico-in Vitro Strategy for Addressing Cytochrome P450 3a4 Time-Dependent Inhibition. Chem Res Toxicol 2010, 23, 664–676. [DOI] [PubMed] [Google Scholar]
- 28.Lombardo F; Shalaeva MY; Tupper KA; Gao F; Abraham MH, Elogpoct a Tool for Lipophilicity Determination in Drug Discovery. J Med Chem 2000, 43, 2922–2928. [DOI] [PubMed] [Google Scholar]
- 29.Lagorce D; Sperandio O; Galons H; Miteva MA; Villoutreix BO, Faf-Drugs2: Free Adme/Tox Filtering Tool to Assist Drug Discovery and Chemical Biology Projects. BMC Bioinformatics 2008, 9, 396. [DOI] [PMC free article] [PubMed] [Google Scholar]
- 30.Villoutreix BO; Renault N; Lagorce D; Sperandio O; Montes M; Miteva MA, Free Resources to Assist Structure-Based Virtual Ligand Screening Experiments. Curr Protein Pept Sci 2007, 8, 381–411. [DOI] [PubMed] [Google Scholar]
- 31.Ekins S, Computational Toxicology: Risk Assessment for Pharmaceutical and Environmental Chemicals. John Wiley and Sons: Hoboken, NJ, 2007. [Google Scholar]
- 32.Balani SK; Miwa GT; Gan LS; Wu JT; Lee FW, Strategy of Utilizing in Vitro and in Vivo Adme Tools for Lead Optimization and Drug Candidate Selection. Curr Top Med Chem 2005, 5, 1033–1038. [DOI] [PubMed] [Google Scholar]
- 33.van De Waterbeemd H; Smith DA; Beaumont K; Walker DK, Property-Based Design: Optimization of Drug Absorption and Pharmacokinetics. J Med Chem 2001, 44, 1313–1333. [DOI] [PubMed] [Google Scholar]
- 34.Walters WP; Murcko MA, Prediction of ‘Drug-Likeness’. Adv Drug Del Rev 2002, 54, 255–271. [DOI] [PubMed] [Google Scholar]
- 35.ChEMBL. http://www.ebi.ac.uk/chembldb/index.php
- 36.Bento AP; Gaulton A; Hersey A; Bellis LJ; Chambers J; Davies M; Kruger FA; Light Y; Mak L; McGlinchey S; Nowotka M; Papadatos G; Santos R; Overington JP, The Chembl Bioactivity Database: An Update. Nucleic Acids Res 2014, 42, D1083–1090. [DOI] [PMC free article] [PubMed] [Google Scholar]
- 37.Gaulton A; Bellis LJ; Bento AP; Chambers J; Davies M; Hersey A; Light Y; McGlinchey S; Michalovich D; Al-Lazikani B; Overington JP, Chembl: A Large-Scale Bioactivity Database for Drug Discovery. Nucleic Acids Res 2012, 40, D1100–1107. [DOI] [PMC free article] [PubMed] [Google Scholar]
- 38.Papadatos G; Overington JP, The Chembl Database: A Taster for Medicinal Chemists. Future Med Chem 2014, 6, 361–364. [DOI] [PubMed] [Google Scholar]
- 39.Wang Y; Xiao J; Suzek TO; Zhang J; Wang J; Bryant SH, Pubchem: A Public Information System for Analyzing Bioactivities of Small Molecules. Nucleic Acids Res 2009, 37, W623–633. [DOI] [PMC free article] [PubMed] [Google Scholar]
- 40.Wang Y; Bolton E; Dracheva S; Karapetyan K; Shoemaker BA; Suzek TO; Wang J; Xiao J; Zhang J; Bryant SH, An Overview of the Pubchem Bioassay Resource. Nucleic Acids Res 2010, 38, D255–266. [DOI] [PMC free article] [PubMed] [Google Scholar]
- 41.Huang R; Xia M; Sakamuru S; Zhao J; Shahane SA; Attene-Ramos M; Zhao T; Austin CP; Simeonov A, Modelling the Tox21 10 K Chemical Profiles for in Vivo Toxicity Prediction and Mechanism Characterization. Nat Commun 2016, 7, 10425. [DOI] [PMC free article] [PubMed] [Google Scholar]
- 42.Dix DJ; Houck KA; Martin MT; Richard AM; Setzer RW; Kavlock RJ, The Toxcast Program for Prioritizing Toxicity Testing of Environmental Chemicals. Toxicol Sci 2007, 95, 5–12. [DOI] [PubMed] [Google Scholar]
- 43.Shah F; Greene N, Analysis of Pfizer Compounds in Epa’s Toxcast Chemicals-Assay Space. Chem Res Toxicol 2014, 27, 86–98. [DOI] [PubMed] [Google Scholar]
- 44.Hohman M; Gregory K; Chibale K; Smith PJ; Ekins S; Bunin B, Novel Web-Based Tools Combining Chemistry Informatics, Biology and Social Networks for Drug Discovery. Drug Discov Today 2009, 14, 261–270. [DOI] [PubMed] [Google Scholar]
- 45.Ekins S; Hohman M; Bunin BA Pioneering Use of the Cloud for Development of the Collaborative Drug Discovery (Cdd) Database In Collaborative Computational Technologies for Biomedical Research, Ekins S; Hupcey MAZ; Williams AJ, Eds.; Wiley and Sons: Hoboken, 2011; Vol. 335–361. [Google Scholar]
- 46.Clark AM; Dole K; Coulon-Spector A; McNutt A; Grass G; Freundlich JS; Reynolds RC; Ekins S, Open Source Bayesian Models: 1. Application to Adme/Tox and Drug Discovery Datasets. J Chem Inf Model 2015, 55, 1231–1245. [DOI] [PMC free article] [PubMed] [Google Scholar]
- 47.Clark AM; Dole K; Ekins S, Open Source Bayesian Models: 3. Composite Models for Prediction of Binned Responses. J Chem Inf Model 2015, 56, 275–285. [DOI] [PMC free article] [PubMed] [Google Scholar]
- 48.Clark AM; Ekins S, Open Source Bayesian Models: 2. Mining a “Big Dataset” to Create and Validate Models with Chembl. J Chem Inf Model 2015, 55, 1246–1260. [DOI] [PubMed] [Google Scholar]
- 49.Balakin KV, Pharmaceutical Data Mining : Approaches and Applications for Drug Discovery. John Wiley & Sons: Hoboken, NJ, 2010. [Google Scholar]
- 50.Yan SF; King FJ; He Y; Caldwell JS; Zhou Y, Learning from the Data: Mining of Large High-Throughput Screening Databases. J Chem Inf Model 2006, 46, 2381–2395. [DOI] [PubMed] [Google Scholar]
- 51.Crisman TJ; Parker CN; Jenkins JL; Scheiber J; Thoma M; Kang ZB; Kim R; Bender A; Nettles JH; Davies JW; Glick M, Understanding False Positives in Reporter Gene Assays: In Silico Chemogenomics Approaches to Prioritize Cell-Based Hts Data. J Chem Inf Model 2007, 47, 1319–1327. [DOI] [PubMed] [Google Scholar]
- 52.Johnson RL; Huang R; Jadhav A; Southall N; Wichterman J; MacArthur R; Xia M; Bi K; Printen J; Austin CP; Inglese J, A Quantitative High-Throughput Screen for Modulators of Il-6 Signaling: A Model for Interrogating Biological Networks Using Chemical Libraries. Mol Biosyst 2009, 5, 1039–1050. [DOI] [PMC free article] [PubMed] [Google Scholar]
- 53.Hammann F; Drewe J, Decision Tree Models for Data Mining in Hit Discovery. Expert Opin Drug Discov 2012, 7, 341–352. [DOI] [PubMed] [Google Scholar]
- 54.Guilloux VL; Arrault A; Colliandre L; Bourg S; Vayer P; Morin-Allory L, Mining Collections of Compounds with Screening Assistant 2. J Cheminform 2012, 4, 20. [DOI] [PMC free article] [PubMed] [Google Scholar]
- 55.Takada N; Ohmori N; Okada T, Mining Basic Active Structures from a Large-Scale Database. J Cheminform 2013, 5, 15. [DOI] [PMC free article] [PubMed] [Google Scholar]
- 56.Soufan O; Ba-alawi W; Afeef M; Essack M; Rodionov V; Kalnis P; Bajic VB, Mining Chemical Activity Status from High-Throughput Screening Assays. PLoS One 2015, 10, e0144426. [DOI] [PMC free article] [PubMed] [Google Scholar]
- 57.Howe EA; de Souza A; Lahr DL; Chatwin S; Montgomery P; Alexander BR; Nguyen DT; Cruz Y; Stonich DA; Walzer G; Rose JT; Picard SC; Liu Z; Rose JN; Xiang X; Asiedu J; Durkin D; Levine J; Yang JJ; Schurer SC; Braisted JC; Southall N; Southern MR; Chung TD; Brudz S; Tanega C; Schreiber SL; Bittker JA; Guha R; Clemons PA, Bioassay Research Database (Bard): Chemical Biology and Probe-Development Enabled by Structured Metadata and Result Types. Nucleic Acids Res 2015, 43, D1163–1170. [DOI] [PMC free article] [PubMed] [Google Scholar]
- 58.Ekins S; Boulanger B; Swaan PW; Hupcey MA, Towards a New Age of Virtual Adme/Tox and Multidimensional Drug Discovery. Mol Divers 2002, 5, 255–275. [DOI] [PubMed] [Google Scholar]
- 59.Gupta RR; Gifford EM; Liston T; Waller CL; Bunin B; Ekins S, Using Open Source Computational Tools for Predicting Human Metabolic Stability and Additional Adme/Tox Properties. Drug Metab Dispos 2010, 38, 2083–2090. [DOI] [PubMed] [Google Scholar]
- 60.Ekins S; Casey AC; Roberts D; Parish T; Bunin BA, Bayesian Models for Screening and Tb Mobile for Target Inference with Mycobacterium Tuberculosis Tuberculosis (Edinb) 2014, 94, 162–169. [DOI] [PMC free article] [PubMed] [Google Scholar]
- 61.Ekins S; Reynolds RC; Franzblau SG; Wan B; Freundlich JS; Bunin BA, Enhancing Hit Identification in Mycobacterium Tuberculosis Drug Discovery Using Validated Dual-Event Bayesian Models PLOSONE 2013, 8, e63240. [DOI] [PMC free article] [PubMed] [Google Scholar]
- 62.Ekins S; Reynolds RC; Kim H; Koo MS; Ekonomidis M; Talaue M; Paget SD; Woolhiser LK; Lenaerts AJ; Bunin BA; Connell N; Freundlich JS, Bayesian Models Leveraging Bioactivity and Cytotoxicity Information for Drug Discovery. Chem Biol 2013, 20, 370–378. [DOI] [PMC free article] [PubMed] [Google Scholar]
- 63.Ekins S; Freundlich JS; Hobrath JV; White EL; Reynolds RC, Combining Computational Methods for Hit to Lead Optimization in Mycobacterium Tuberculosis Drug Discovery. Pharm Res 2014, 31, 414–435. [DOI] [PMC free article] [PubMed] [Google Scholar]
- 64.Ekins S; Freundlich JS; Reynolds RC, Fusing Dual-Event Datasets for Mycobacterium Tuberculosis Machine Learning Models and Their Evaluation. J Chem Inf Model 2013, 53, 3054–3063. [DOI] [PMC free article] [PubMed] [Google Scholar]
- 65.Ekins S; Pottorf R; Reynolds RC; Williams AJ; Clark AM; Freundlich JS, Looking Back to the Future: Predicting in Vivo Efficacy of Small Molecules Versus Mycobacterium Tuberculosis. J Chem Inf Model 2014, 54, 1070–1082. [DOI] [PMC free article] [PubMed] [Google Scholar]
- 66.Ekins S; de Siqueira-Neto JL; McCall LI; Sarker M; Yadav M; Ponder EL; Kallel EA; Kellar D; Chen S; Arkin M; Bunin BA; McKerrow JH; Talcott C, Machine Learning Models and Pathway Genome Data Base for Trypanosoma Cruzi Drug Discovery. PLoS Negl Trop Dis 2015, 9, e0003878. [DOI] [PMC free article] [PubMed] [Google Scholar]
- 67.Ekins S; Freundlich JS; Clark AM; Anantpadma M; Davey RA; P. M, Machine Learning Models Identify Molecules Active against the Ebola Virus in Vitro. F1000Res 2016, 4, 1091. [DOI] [PMC free article] [PubMed] [Google Scholar]
- 68.Perryman AL; Stratton TP; Ekins S; Freundlich JS, Predicting Mouse Liver Microsomal Stability with “Pruned” Machine Learning Models and Public Data. Pharm Res 2016, 33, 433–449. [DOI] [PMC free article] [PubMed] [Google Scholar]
- 69.Ekins S; Clark AM; Wright SH, Making Transporter Models for Drug-Drug Interaction Prediction Mobile. Drug Metab Dispos 2015, 43, 1642–1645. [DOI] [PMC free article] [PubMed] [Google Scholar]
- 70.Clark AM; Sarker M; Ekins S, New Target Predictions and Visualization Tools Incorporating Open Source Molecular Fingerprints for Tb Mobile 2.0. J Cheminform 2014, 6, 38. [DOI] [PMC free article] [PubMed] [Google Scholar]
- 71.Lipinski CA; Litterman N; Southan C; Williams AJ; C. AM; Ekins S, The Parallel Worlds of Public or Commercial Chemistry and Biology Data. J Med Chem 2015, 58, 2068–2076. [DOI] [PMC free article] [PubMed] [Google Scholar]
- 72.Jones DR; Ekins S; Li L; Hall SD, Computational Approaches That Predict Metabolic Intermediate Complex Formation with Cyp3a4 (+B5). Drug Metab Dispos 2007, 35, 1466–1475. [DOI] [PubMed] [Google Scholar]
- 73.Metz JT; Johnson EF; Soni NB; Merta PJ; Kifle L; Hajduk PJ, Navigating the Kinome. Nat Chem Biol 2011, 7, 200–202. [DOI] [PubMed] [Google Scholar]
- 74.Davis MI; Hunt JP; Herrgard S; Ciceri P; Wodicka LM; Pallares G; Hocker M; Treiber DK; Zarrinkar PP, Comprehensive Analysis of Kinase Inhibitor Selectivity. Nat Biotechnol 2011, 29, 1046–1051. [DOI] [PubMed] [Google Scholar]
- 75.Clemons PA; Bodycombe NE; Carrinski HA; Wilson JA; Shamji AF; Wagner BK; Koehler AN; Schreiber SL, Small Molecules of Different Origins Have Distinct Distributions of Structural Complexity That Correlate with Protein-Binding Profiles. Proc Natl Acad Sci U S A 2010, 107, 18787–18792. [DOI] [PMC free article] [PubMed] [Google Scholar]
- 76.Ekins S; Litterman NK; Lipinski CA; Bunin BA, Thermodynamic Proxies to Compensate for Biases in Drug Discovery Methods. Pharm Res 2016, 33, 194–205. [DOI] [PubMed] [Google Scholar]
- 77.Anastassiadis T; Deacon SW; Devarajan K; Ma H; Peterson JR, Comprehensive Assay of Kinase Catalytic Activity Reveals Features of Kinase Inhibitor Selectivity. Nat Biotechnol 2011, 29, 1039–1045. [DOI] [PMC free article] [PubMed] [Google Scholar]
- 78.Norman RA; Toader D; Ferguson AD, Structural Approaches to Obtain Kinase Selectivity. Trends Pharmacol Sci 2012, 33, 273–278. [DOI] [PubMed] [Google Scholar]
- 79.Niijima S; Shiraishi A; Okuno Y, Dissecting Kinase Profiling Data to Predict Activity and Understand Cross-Reactivity of Kinase Inhibitors. J Chem Inf Model 2012, 52, 901–912. [DOI] [PubMed] [Google Scholar]
- 80.Uitdehaag JC; Verkaar F; Alwan H; de Man J; Buijsman RC; Zaman GJ, A Guide to Picking the Most Selective Kinase Inhibitor Tool Compounds for Pharmacological Validation of Drug Targets. Br J Pharmacol 2012, 166, 858–876. [DOI] [PMC free article] [PubMed] [Google Scholar]
- 81.Burrill GS, In 4th Annual CDD Community Meeting; San Francisco, 2010. [Google Scholar]
- 82.Paillard G; Cochrane P; Jones PS; van Hoorn WP; Caracoti A; van Vlijmen H; Pannifer AD, The Elf Honest Data Broker: Informatics Enabling Public-Private Collaboration in a Precompetitive Arena. Drug Discov Today 2016, 21, 97–102. [DOI] [PubMed] [Google Scholar]
- 83. http://rarediseases.info.nih.gov/Resources/Rare_Diseases_Information.aspx http://rarediseases.info.nih.gov/Resources/Rare_Diseases_Information.aspx.


