

Abstract
Nephrotic syndrome (NS), a frequent chronic kidney disease in children and young adults, is the most common phenotype associated with primary coenzyme Q10 (CoQ10) deficiency and is very responsive to CoQ10 supplementation, although the pathomechanism is not clear. Here, using a mouse model of CoQ deficiency-associated NS, we show that long-term oral CoQ10 supplementation prevents kidney failure by rescuing defects of sulfides oxidation and ameliorating oxidative stress, despite only incomplete normalization of kidney CoQ levels and lack of rescue of CoQ-dependent respiratory enzymes activities. Liver and kidney lipidomics, and urine metabolomics analyses, did not show CoQ metabolites. To further demonstrate that sulfides metabolism defects cause oxidative stress in CoQ deficiency, we show that silencing of sulfide quinone oxido-reductase (SQOR) in wild-type HeLa cells leads to similar increases of reactive oxygen species (ROS) observed in HeLa cells depleted of the CoQ biosynthesis regulatory protein COQ8A. While CoQ10 supplementation of COQ8A depleted cells decreases ROS and increases SQOR protein levels, knock-down of SQOR prevents CoQ10 antioxidant effects. We conclude that kidney failure in CoQ deficiency-associated NS is caused by oxidative stress mediated by impaired sulfides oxidation and propose that CoQ supplementation does not significantly increase the kidney pool of CoQ bound to the respiratory supercomplexes, but rather enhances the free pool of CoQ, which stabilizes SQOR protein levels rescuing oxidative stress.
Keywords: Coenzyme Q10, CoQ deficiency, mitochondria, oxidative stress, sulfides
1. Introduction
Deficiency of coenzyme Q10 (CoQ10, the major form of CoQ in humans) is one of the few readily treatable mitochondrial diseases. However, the response to supplementation varies among phenotypes. Nephrotic syndrome (NS), either in isolation or as part of an infantile multi-systemic disease, is the most common manifestation associated with CoQ10 deficiency due to mutations in genes encoding for proteins involved in CoQ10 biosynthesis (primary CoQ10 deficiency), and is the most responsive to CoQ10 supplementation (1). However, the mechanism of the selective responsiveness of NS is not clear, because, paradoxically, kidney is one of the organs with the poorest uptake of exogenous CoQ10 (2, 3).
CoQ10 is a lipid molecule present in all cell membranes, where exerts a variety of biological functions (4). For example, it carries electrons in the mitochondrial respiratory chain, acts as antioxidant, and, due to his redox properties, functions as cofactor for numerous enzymes, as sulfide quinone oxido-reductase (SQOR), the first enzyme of the sulfide (H2S) oxidation pathway, or electron-transferring flavoprotein dehydrogenase (ETFDH), involved in fatty acid oxidation (5). Whether there is a pool of CoQ responsible for all its biological functions, or whether two pools, one bound to mitochondrial respiratory supercomplexes, and one free, have separate functions, is still under debate (6). Considering the multiple functions of CoQ10, the clinical heterogeneity and variable response to supplementation of CoQ10 deficiency is not surprising and may reflect tissue-specific pathomechanistic effects.
To address these issues, we have been studying Pdss2kd/kd mice, which carry a spontaneous mutation in the subunit 2 of polyprenyl-diphosphate synthase, the first enzyme involved in the CoQ biosynthetic pathway (7). In humans, molecular defects in PDSS2 manifest with nephrotic syndrome and encephalopathy (8), whereas Pdss2kd/kd mice develop isolated nephropathy with proteinuria that progresses to lethal renal failure as the only clinical manifestation of the disease (9), thus reproducing the human disease caused by molecular defects in COQ2, COQ6, and COQ8B (10–15). The predominant kidney phenotype in these mice has been attributed to renal CoQ deficiency producing respiratory chain deficiency, increased oxidative stress, or both (16, 17). We previously showed that mitochondrial loss triggered by oxidative stress causes kidney failure in Pdss2kd/kd mice. Despite the widespread deficiency of CoQ9 (the predominant form of CoQ in mice) and mitochondrial respiratory chain deficiencies, only affected organs show oxidative stress, with increased reactive oxigen species (ROS) as first abnormality, occurring in pre-symptomatic stage of the disease (16). Recently, we also observed that in 6 month-old Pdss2kd/kd mice (late stage of disease), kidney showed: (i) reduced protein levels of SQOR and downstream enzymes, (ii) accumulation of hydrogen sulfides, and (iii) depletion of glutathione (GSH). In Pdss2kd/kd mice, we also observed low levels of plasma and urine thiosulfate and increased blood C4-C6 acylcarnitines (18), indicative of inhibition of short- chain acyl-CoA dehydrogenase (SCAD), a known toxic effect of H2S (16).
ROS production has been implicated as mechanism of H2S toxicity, for example by inhibiting cytochrome c oxidase (COX, complex IV) or by modulating the levels of GSH (19,21), leading us to hypothesize that in CoQ deficiency-associated NS, oxidative stress is caused by H2S oxidation impairment. Therefore, to investigate the mechanisms underlying CoQ10 deficiency-related NS, and understand CoQ10 mechanisms of action, we assessed the effects of long-term CoQ10 oral supplementation on clinical, biochemical and molecular abnormalities in kidney of Pdss2kd/kd mice. Since the negligible effects of CoQ10 supplementation can be explained by the strong lipophilicity of CoQ10, which reaches mitochondria in small proportion, we compared the effects of CoQ10 supplementation with the effects of supplementation with idebenone (IDB), a synthetic molecule with quinone proprieties similar to CoQ10, but with a shorter hydrocarbon chain responsible for its different role in the mitochondrial respiratory chain (22). Hydrophilic ubiquinone analogs as IDB are less efficient than hydrophobic ubiquinone analogs in the generation of energy by the mitochondrial respiratory chain, since the specific actions of both kind of ubiquinones depends of their interaction with two different bind sites, and hydrophilic quinones may enhance oxidative stress by interaction with the electron escape sites on Complex I (23–21). Although the results of our previous in vitro experiments suggested that primary CoQ10 deficiencies should be treated with CoQ10 supplementation but not with short-tail ubiquinone analogs, we observed that oxidative stress and cell death could be counteracted by administration of lipophilic or hydrophilic antioxidants (26).
2. Material and methods
2.1. Animals
2.1.1. Care
B6/Pdss2kd/kd mice were purchased from Jackson laboratory. Pdss2kd/kd mice harbor a spontaneous mutation in the gene encoding the subunit 2 of polyprenyl-diphosphate synthase (Pdss2) and have been previously described. All experiments were performed according to a protocol approved by the Institutional Animal Care and Use Committee of the Columbia University Medical Center, and were consistent with the National Institutes of Health Guide for the Care and Use of Laboratory Animals. Mice were housed and bred according to international standard conditions, with a 12 h light, 12 h dark cycle and free access to food and water.
Mutant and controls animals were euthanized at 6 months (late-stage of the disease) and at 20 months (CoQ10 treated animals, the only group that survived) unless differently specified. Affected (kidney) and two unaffected tissues (brain and liver) were quickly removed and frozen in the liquid phase of isopentane, pre-cooled towards its freezing point (−80°C) with dry ice, or fixed in a solution of 4% paraformaldehyde. Urine were collected at 6 months of age. Blood was extracted from the heart and collected in tubes with EDTA. Plasma was obtained from blood by centrifugation at 4°C at 2500 rpm for 15 min and kept at −80°C.
2.1.2. Groups
Regular chow was administered to wild-type and mutant mice until 3 months of age (age of phenotypic onset), followed by either regular, 0.5% Idebenone (IDB) or 0.5% Coenzyme Q10 (CoQ) supplemented food. CoQ10 and Idebenone supplemented food was purchased from Envigo (Envigo, Somerset, NJ). All the experiments were performed in 5–10 animals for group unless differently specified.
2.2. Assessment of kidney function
Proteins and creatinine levels in mice urine were measured commercially by Antech® Diagnostic (Fountain Valley, CA). Protein concentration was also assessed using a commercial kit (Chemistrip® 10 with SG, Roche Diagnostic, Germany) following the manufacturer’s instructions.
2.3. CoQ9 and CoQ10 measurement
CoQ9 (the main CoQ specie in mice) and CoQ10 were extracted from kidney, brain and liver, in 1-propanol. The lipid component of the extract was separated by high-performance liquid chromatography (HPLC) on a reverse-phase Waters Symmetry C18 3.5pm, 4.6 × 150mm (Waters Corp., Milford, MA, USA), using a mobile phase consisting of methanol, ethanol, 2- propanol, acetic acid (500:470:15:15), and 50mM sodium acetate at a flow rate of 0.8ml/min. The electrochemical detector, ESA Coulochem II (ESA Inc., Chelmsford, MA, USA), was used with the following settings: guard cell (upstream of the injector) at 650mV, conditioning cell at - 650mV (downstream of the column), followed by the analytical cell at +450mV. CoQ concentration was estimated by comparison of the peak area with those of standard solutions of known concentration and expressed in micrograms per gram of protein (8).
2.4. Mitochondrial respiratory chain enzymes activities
CoQ-dependent respiratory chain activities (NADH cytochrome c reductase, complex I+III, and Succinate cytochrome c reductase, complex Π+ΠΙ), and citrate synthase (CS) activities were measured spectrophotometrically (16). All following reactions were measured at 30°C. Complex I+III activity was measured in the presence of 10mM potassium cyanide, 2mM NADH, and ImM cytochrome c, as the rotenone-sensitive reduction of cytochrome c assessed at 550nm. The results were expressed in nmol reduced cyt c/min/mg protein. Complex II+III activity was measured in the presence of 10mM KCN and 30mMsuccinate in KH2PO4 buffer (pH 7.5). The reaction was initiated by addition of ImM cytochrome c and the decrease in absorbance was monitored at 550nm. The results were expressed in nmol reduced cyt c/min/mg protein. CS activity was measured following the reduction of ImM 5,50-dithiobis (2-nitrobenzoic acid) in 1M Tris-HCl (pH 8.1) at 412nm for 2 minutes in the presence of 10mM acetyl-CoA, and 10mM oxaloacetic acid, and expressed as nmol/min/mg protein.
2.5. Respiratory super-complexes native gel
For separation and quantification of respiratory super-complexes, mitochondrial inner membranes were prepared according to published protocols (28). Five mg of kidney tissue were homogenized in 500ml sucrose buffer (250mM sucrose, 20mM sodium phosphate, pH 7.0) and solubilized by adding digitonin (2% w/v). Solubilized mitochondrial complexes were divided in two aliquots and separated using high resolution clear native buffer 3 (29). To visualize the supercomplexes, gels were incubated at room temperature with specific complex I assay buffer (25mg of NTB, 100μl of NADH in 5mM Tris/HCl, pH 7.4 buffer). The reaction was stopped after 5 min and scanned for densitometric quantitation. To assess complex III in-gel activity, gels were incubated in buffer containing 5mg of diaminobenzidine dissolved in 10ml of 50mM sodium phosphate, pH 7.2, and acquired after 1h incubation.
2.6. Morphology and tissue studies
All sections were examined using an Olympus BX51 microscope (Olympus, Tokyo, Japan) with a computer assisted image analysis system, and images were captured with a QImaging Retiga EXi digital camera, using QCapture software (QImaging, Surrey, BC, Canada), and with a Zeiss AX10 epifluorescence microscope and processed by ΝIΗ ImageJ 1.50e software.
2.6.1. Histology
To visualize histological features, as well as extent of renal damage, hematoxylin and eosin (H&E) staining was performed on kidney sections. Briefly, sections were deparaffinized and rehydrated using Trilogy™ (Cell Marque, Rocklin, CA), stained in filtered Harris hematoxylin (Hematoxylin Solution, Harris Modified, Sigma Aldrich, Saint Louis, MO) for 10min, washed in 0.2% acetic acid for 30sec and rinsed in dH2O. Sections were then stained in eosin (Eosin Y solution, alcoholic, Sigma Aldrich, Saint Louis, MO) for 1min, dehydrated by passages in alcohol from 50% to 100% lmin each and cleaned in xylene twice (2min each). Coverslips were added using Permount (Permount Mounting Medium, Fisher Scientific, Hampton, NH). Renal Damage Score (RDS) was determined as in (27). The sections were examined blindly and scored as follows: 0= no tubular dilatation and no cell infiltrates. 1= small focal areas of cellular infiltration and tubular dilatation involving less than 10% of the cortex; 2= involvement of up to 25% of the cortex; 3= involvement of up to 50% of the cortex; 4= extensive damage involving more than 75% of the cortex. The presence or absence of glomerulosclerosis was determined as in (9).
2.6.2. Oxidative stress
Kidney were fixed in 10% neutral buffered formalin and embedded in paraffin using standard procedures. Sections (3 μm) were used for immunohistochemical studies to assess oxidative stress. For deparaffinization, rehydration and unmasking of the antigen the buffer Trilogy™ (Cell Marque, Rocklin, CA) was used. Section were then washed three times with PBS, incubated for 1h in blocking buffer (PBS, BSA 1%, Triton X 0.5%) and then incubated with the primary antibody overnight. After three washes in PBS, sections were incubated for lh at room temperature with the secondary antibody, washed again with PBS three times, incubated with Hoechst (Hoechst 33342, Thermo Fisher, Waltham, MA) for 10min, washed once with PBS and finally covered using Vectashield (Vectashield mounting medium H-1000, Vector Laboratories, Burlingame, CA). Rabbit anti-4-hydroxynonenal antiserum (HNE11-S; AlphaDiagnostic International. Inc, 1:1000) was used to detect lipid peroxidation (16); rabbit polyclonal anti- nitrotyrosine (PNK) (sc-55256, Santa Cruz Biotechnology Inc., Santa Cruz, CA, 1:1000) was used to detect protein oxidation (30). As secondary antibodies, we used species specific, Alexa Fluor™ 488 antibody (Sigma Aldrich, Saint Louis, MO, 1:2000).
Images where taken with a Zeiss AX10 epifluorescence microscope and processed with Image-J to quantify fluorescence intensity. Single glomeruli where analyzed from ten fields for each kidney. The fluorescence intensity of single glomeruli was measured and background signal was subtracted.
2.7. Assessment of sulfides oxidation pathway
To assess the H2S oxidation pathway, we measured mRNA and protein levels of H2S oxidation enzymes (SQOR, TST, ETHE1, and SUOX). To measure mRNA, quantitative RT- PCR was performed using TaqMan® Assays with the following Applied Biosystems probes: SQRDL, Mm00502443_m1; TST, Mm0119523l_ml1; SUOX, Mm00620388_gl; ETHE1, Mm00480916_m1. Expression of the target genes was calculated by -ΔΔCT method and normalized to the expression of GAPDH (#4308313). The experiments were performed in technical triplicates of at least at least three biological replicates as described in Ziosi et al. 2017 (18).
To measure protein levels, we performed western blots. Proteins were extracted from cell pellets by sonication and from mouse tissues by mechanical homogenization in lysis buffer (50nM Tris HCl, 150mM NaCl, 1mM EDTA). To prevent protein degradation a protease inhibitor cocktail (Complete Mini®, EDTA-free, 11836170001, Roche) was added to the protein extract and the samples were kept at −80°C. Cell lysates were quantitated for total protein content using the Bradford system (ThermoFisher, Waltham, MA); 10–20μg of proteins were loaded and analyzed by electrophoresis in a 12–15% PAGE gel or Novex 10–20% Glycine Gel (EC61355, Invitrogen, Carlsbad, CA). After electrophoresis, proteins were transferred to a PVC membrane (IPFL00010, Immobilon-FL). Membranes where blocked in PBT with 2.5–5% milk before incubation with the following antibodies: rabbit anti-SQOR (1:1000, abl 18772 Abcam, Cambridge, UK); rabbit anti-TST, (1:1000, abl55320, Ab cam); mouse anti-SUOX (1:1000, ab57852, Abeam, Cambridge, UK); rabbit anti-ETHE1 (1:1000, abl54041, Abcam, Cambridge, UK); rabbit anti-TOM20 (1:500, sc-11415, Santa Cruz Biotechnology Inc., Santa Cruz, CA), mouse anti-Vinculin (1:5000, abl8058, Abeam, Cambridge, UK); secondary rabbit and mouse HRP-conjugated antibodies (1:2000, A9044 and A0545, Sigma Aldrich, Saint Louis, MO). Protein bands were visualized by chemiluminescence, using ECL reagents (GE Healthcare, Little Chalfont, UK). Intensity of the bands was quantified with ImageJ (NIH), according to Ziosi el al. 2017 (18).
2.8. GSH measurement
The level of total GSH (T-GSH) was measured as described in (31). Briefly, frozen tissue were homogenized and centrifuged for 20min at 12000rpm. Proteins were quantified by Bradford assay and 25μg of protein were diluted in 100μl of 6% Ortophosphoric acid. The supernatant was then diluted 1:20 in assay buffer (0.1M potassium phosphate buffer pH 7.4; 5mM EDTA; 0.66mM DTNB; 0.5 μM NADPH). A standard calibration curve was prepared ranging from 0 to 12mg/ml of GSH. In a 1ml cuvette, 5μ1 of sample/standard, 400μ1 of assay buffer and 5μ1 (3 Units) of Glutathione Reductase (5 μg/μl) were mixed. After 3 minutes of incubation, the absorbance was measured at A412nm for 3min. Total GSH concentration was then extrapolated using the standard curve and expressed as expressed pmol/mg protein.
2.9. Ultra-carrying out liquid chromatography-mass spectrometer (MS/MS), analysis of CoQ excretion metabolites
Lipids extracts were obtained by mixing urine with 1-propanol or by hexane extraction (32, 33). Samples were analyzed using an Acquity ultra carrying out liquid chromatography system Η-Class (WatersCorporation) coupled to a Xevo TQS detector of mass spectrometer (MS/MS) with an electrospray ionization (Waters Corporation). The analytical separation column was a BEH C18, 1.7pm, 2.1×50mm column (Waters, Spain) (32). The mobile phase consisted of methanol and 0.1% Formic acid at the constant flow rate of 0.45ml/min. Source and desolvation temperatures were set at 140 and 500°C, respectively. Nitrogen was used as both cone gas (150l/h) and desolvation gas (800l/h), and argon was used as collision gas (0.14ml/min). Mass spectrometry analyses were carried out in full scan mode between 300 and 600uma, as well as 600 and 950uma to improve the sensitivity of the analysis.
2.10. Serum acylcarnitines determination
2.10.1. Samples preparation
To investigate fatty acid oxidation, we performed serum acylcarnitines profile. All solvents for sample preparation and UPLC/MS/MS analysis were LC/MS grade (Fisher Scientific; Pittsburgh, PA). Free carnitine and fatty acylcarnitine standards were purchased from Toronto Research Chemicals (Toronto, Ontario) and R&D Systems, Inc. (Minneapolis, MN). Deuterated internal standards were purchased from Cambridge Isotope Laboratories, Inc. (Tewksbury, MA). All the procedures were carried out on ice or at 4C. An aliquot of 100μl methanol containing internal standards was added to 50μl of plasma in a 1.5ml microcentrifuge tube. After vortexing, 400μl acetonitrile were added to the sample. Samples were vortexed at 2,000rpm for 30min and centrifuged at 20,000g for 10min. The clear supernatant was transferred to an Agilent micro sampling vial (Agilent Technologies, Cat No 5184–3550, Santa Clara, CA). The supernatant was evaporated to dryness with nitrogen at room temperature and subsequently reconstituted in 100μl of 1:9 (v:v) methanol/water containing 10mM ammonium acetate and 10mM heptafluorobutyric acid for injection.
2.10.2. LC-MS Conditions
All experiments were carried out on an Agilent 6410 Triple Quad LC-MS/MS system. 2.5μl were loaded onto an Agilent Poroshell 120 EC-C18 column (3.0mm inner diameter 50mm with 2.7μm particles). The column was maintained at 50°C throughout analysis. The initial conditions were as follows: 500μl/min with a mobile phase composition of 98% solvent A (water containing 10mM ammonium acetate and 10mM heptafluorobutyric acid) and 2% solvent B (methanol containing 10mM ammonium acetate and 10mM heptafluorobutyric acid). Initial conditions were maintained for 1min. Solvent B was lineally increased to 90% over 5min and maintained for 1min. The column was cleaned with 98% solvent B for 3min and conditioned with 2% solvent B for 3min before the next injection. Carnitine and acylcarnitines of interest elute between 1.3 and 6.8 minutes. Positive electrospray tandem mass spectrometry (ESI- MS/MS) under multiple reactions monitoring mode (MRM) was performed employing the following parameters: capillary voltage, 2,000V; gas temperature, 350°C; gas flow, 13l/min; nebulizer, 60psi. Different species were identified by comparing the retention times of experimental compounds with those of authentic standards. Concentrations of carnitine and acylcarnitines in the serum were quantified by comparing integrated peak areas for those of each carnitines against those of known amounts of purified standards.
2.11. Kidney and Liver lipidomics
Analysis of lipids in liver and kidney was performed using High Performance Liquid Chromatography-Mass Spectrometry. Lipid extracts were prepared using a modified Bligh and Dyer procedure as described previously (34, 35), spiked with appropriate internal standards, and analyzed using a 6490 Triple Quadrupole LC/MS system (Agilent Technologies, Santa Clara, CA). Glycerophospholipids and sphingolipids were separated with normal-phase HPLC as described before (35), with few modifications. An Agilent Zorbax Rx-Sil column (inner diameter 2.1 × 100mm) was used under the following conditions: mobile phase A (chloroform:methanol:1 M ammonium hydroxide, 89.9:10:0.1, v/v) and mobile phase B (chloroform:methanol:water:ammonium hydroxide, 55:39.9:5:0.1, v/v); 95% A for 2min, linear gradient to 30% A over 18min and held for 3min, and linear gradient to 95% A over 2min and held for 6min. Sterols and glycerolipids were separated with reverse-phase HPLC using an isocratic mobile phase as before (35) except with an Agilent Zorbax Eclipse XDB-C18 column (4.6×100mm). Quantification of lipid species was accomplished using multiple reaction monitoring (MRM) transitions developed in earlier studies (35) in conjunction with referencing of appropriate internal standards: PA 14:0/14:0, PC 14:0/14:0, PE 14:0/14:0, PI 12:0/13:0, PS 14:0/14:0, SM dl8:1/12:0, D7-cholesterol, CE 17:0, MG 17:0, 4ME 16:0 diether DG, D5-TG 16:0/18:0/16:0 (Avanti Polar Lipids, Alabaster, AL).
2.12. In vitro studies
2.12.1. Cell culture and CoQ10 supplementation
To generate Hela cells depleted of COQ8A, cells were stable transfected with scramble shRNA-pLKO plasmid (used as control EV) or COQ8A-specific TRC shRNA-pLKO plasmid construct (SHCLNG-NM_020247 MISSION® shRNA Bacterial Glycerol Stock; Sigma Aldrich).
EV and COQ8A shRNA cells were plated at concentration of 0.5×l06/ml in six well plates and cultured in DMEM. After 24h, the medium was supplemented with 10% FBS +/− 10μM of CoQ10 (Hydro Q Sorb Powder, Tishcon Corp., USA) for 72hrs. Transient knockdown of SQOR in wild-type and COQ8A depleted HeLa cells was obtained incubating cells for 6hrs in OptiMEM medium supplemented with 5ml MEM vitamins and 5ml MEM non-essential amino acids, 25pmol of SQRDL Silencer Select Validated siRNA (Ambion 4390824), and Lipofectamine 2000.
After 6hrs, 10% FBS +/− 10uM of CoQ10 was supplemented and cells where incubated for other 42hrs.
2.12.2. Determination of superoxide production
To estimate production of ROS, cells were washed in PBS and treated with 5mM of MitoSOX (Molecular Probes - M36008) for 30min. at 37°C, nuclei were stained with 0.lug/ml of Hoechst 33342 (Thermo Scientific - 62249). Cells were washed twice in PBS and images where captured with fluorescence microscope (Nikon Eclipse TE-2000) Images were elaborated and fluorescence intensity was measured with ImageJ.
2.12.3. Determination of protein steady-state levels by immunoblotting
Steady-state protein levels of COQ8A/ADCK3 and SQOR were measured by western blot analysis. Proteins were extracted from cell pellets by sonication in water. To prevent protein degradation, a protease inhibitor cocktail (Complete Mini®, EDTA-free, 11836170001, Roche) was added to the protein extract and the samples were kept at −80°C. Cell lysates were quantitated for total protein content using the BCA system (ThermoScience) and analyzed by electrophoresis in Novex 10–20% Glycine Gel (EC61355, Invitrogen) loading 20pg of protein for sample. After electrophoresis, proteins were transferred to a PVC transfer membrane (IPFL00010, Immobilon-FL). Membranes were blocked in PBT with 5% milk before incubation with the following antibodies: rabbit anti-SQRDL (1:1000, 17256–1-AP Proteintech); rabbit anti- ADCK3/CABC1 (1:1000, Thermo Scientific, Pierce, PA5–13906) mouse anti-vinculin (1:5000, Abcam abl8058); secondary rabbit and mouse HRP (1:2000, Sigma A9044 and A0545). Protein bands were visualized by chemiluminescence, using ECL reagents (GE Healthcare). Intensity of the bands was quantified with ImageJ (NIH).
2.13. Statistical analysis
For the survival curve, the longrank (or Mantel-Cox) test was used; in order to compare results of CoQ, RCA, Western blots, acylcarnitine, GSH, lipidomics and qPCR measurement, the Mann-Whitney non-parametric U-test was used, unless specified otherwise. To compare urine proteinuria unpaired t- test was used. For the quantification of fluorescence intensity in the in vitro and in vivo experiments one way ANOVA test was used. For statistical analysis, GraphPad Prism v5 was used. Data are expressed as mean ± SD of at least three experiments for group. A value of p < 0.05 was considered to be statistically significant. * indicates a value of p < 0.05, ** indicates a value of p < 0.01, and *** indicates a value of p < 0.001.
3. Results
3.1. CoQ10 supplementation increases the life span of Pdss2kd/kd mutant animals and stabilizes proteinuria
To evaluate the effect of our treatments on the life span of Pdss2kd/kd, we compared survival curve of placebo, CoQ10, and IDB treated animals. While survival of mutant animals was dramatically prolonged by CoQ10 supplementation, it was not improved by IDB treatment (Fig. 1).
Fig. 1: Survival curve in Pdss2kd/kd mice: CoQ10 supplementation significantly increases survival of mutant mice.
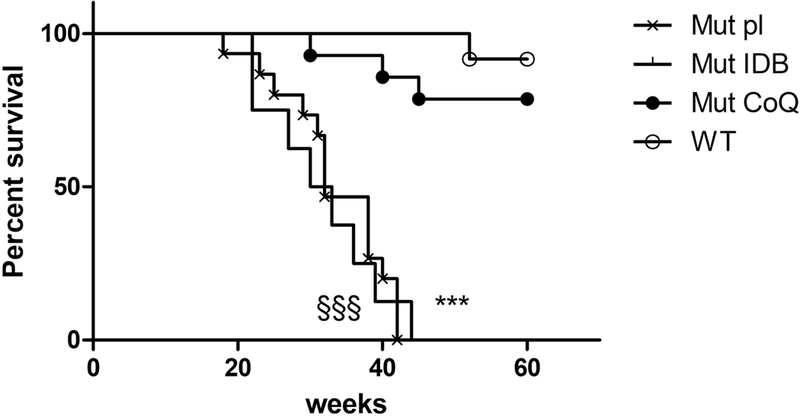
Mut Placebo vs WT: p<0.001, §§§; Mut IDB vs WT: p<0.001, *** (Mantel-Cox test). Mut placebo =15, Mut IDB = 8, Mut CoQ = 9, WT =15. Mut = mutant; IDB = Idebenone; CoQ = CoQ10; WT = wild type.
Proteine /creatinine ratio was significantly increased in 6 month-old mutant animals in placebo compared with wild-type animals, and was reduced by CoQ10 supplementation (Table 1).
Table 1:
Protein and Creatinine levels in urine of 6mo Pdss2kd/kd mice.
| WT pl 6mo | Mut pl 6mo | WT CoQ 6mo | Mut CoQ 6mo | |
|---|---|---|---|---|
| Protein-Urine (mg/dL) | 275.2±15.8 | 612.1±183.3 | 223.6±210.4 | 388.8±334.3 |
| Creatinine (mg/dL) | 65.1±21.1 | 30.6±3.8* | 47.1±11.6 | 32.2±2.1* |
| Urine Proteine/Creatinine | 2.9±0.6 | 20.0±5.5* | 4.3±3.0 | 10.8±8.6 |
WT= wild type; Mut= mutant, mo= month-old; pl= placebo; CoQ= CoQ10; N = 3 for group. Bold characters = statistical significance
= p<0.05 (unpaired t test).
Mutant animals treated with placebo showed proteinuria starting at 3 months of age. Proteinuria worsened in 6 month-old placebo and IDB treated mutant animals, but not in CoQ10- treated Pdss2kd/kd mice at ages 3, 6, 9 and 12 month-old (Suppl. Table 1), indicating that CoQ10 supplementation prevents the progression of the disease to renal failure.
3.2. CoQ10 supplementation preserves kidney morphology
Kidney of 4 month-old (age of onset of disease) Pdss2kd/kd mice showed tubular interstitial nephritis and collapsing glomerulopathy, absent in younger mutant mice (16, 36). To assess the effects of the treatments on kidney morphology, we performed H&E staining, and quantified kidney damage. Kidney of 6 and 20 month-old mutant animals supplemented with CoQ10 showed preserved histological structure. In contrast, IDB supplementation had no beneficial effects on the tissue morphology, as glomeruli were disrupted (Fig. 2). Renal Damage Score (RDS) was 3+ in mutant animals in placebo and IDB; 0 in wild-type animals, and 1 in mutant animals treated with CoQ10. We found glomerulosclerosis in mutant animals in placebo and IDB. On the contrary, despite minor cortical damage, we did not detect any sign of glomerulosclerosis after CoQ10 treatment in mutant mice (RDS=1) (Fig. 2).
Fig. 2: Kidney morphology: CoQ10 supplementation preserves kidney structure in Pdss2kd/kd mutant mice.
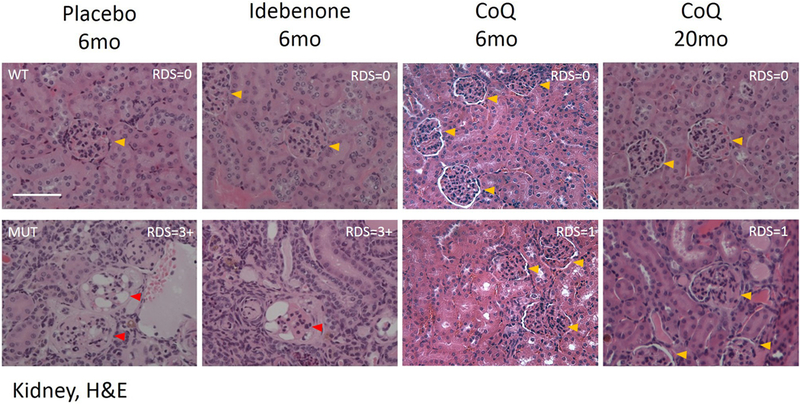
Representative images of H&E staining in kidney of wild-type (WT) and mutant (MUT) animals (N= 3 for group). RDS= Renal Damage Score. Yellow arrows indicate healthy glomeruli, red arrows indicate disrupted glomeruli. Magnification: 20×; CoQ = CoQ10; 6mo = 6 months old; 20mo = 20 months old, H&E = Hematoxylin - Eosin; scale bar = 100pm.
These data, together with the results of survival and proteinuria, indicate that the CoQ10 supplementation prevents kidney failure in Pdss2kd/kd mice.
3.3. CoQ10 supplementation partially increases CoQ levels in kidney of Pdss2kd/kd mutant mice
To assess CoQ10 organs uptake, CoQ9 and CoQ10 levels were measured in affected tissue (kidney), two unaffected tissues used as control (brain and liver), and plasma. Consistently with our previously published data (16), kidney of 6 month-old mutant animals in placebo showed significantly decreased CoQ9 and CoQ10 levels compared with wild-type animals (kidney CoQ9: Mut placebo 40% of WT, p=0.0012; kidney CoQ10: Mut placebo 17% of WT, p=0.0003; Table 2, Fig. 3 A, B). Also brain and liver, despite being clinically unaffected, showed significantly decreased CoQ9 and CoQ10 levels (Suppl. table 2, Suppl. fig. 1 A, B, D, E).
Table 2: CoQ levels in kidney of Pdss2kd/kd mice.
CoQ values are expressed as mean± standard deviation μg/g protein.
| Kidney | WT pl 6mo | Mut pl 6mo | WT IDB 6mo | Mut IDB 6mo | WT CoQ 6mo | Mut CoQ 6mo | WT CoQ 20mo | Mut CoQ 20mo |
|---|---|---|---|---|---|---|---|---|
| CoQ9 | 1867±1122 | 756.8±336.2** | 3812±2030 | 596±291.1*** | 5785±1391 | 1098±606.4* | 1312±573 | 450.6±187.4** |
| CoQ10 | 493.1±178.4 | 83.6±26.2*** | 591.8±212.6 | 67.4±38.5*** | 721.8±183.3 | 133.7±47.5* | 388.4±210.1 | 91.28±27** |
WT= wild type; Mut= mutant, mo= month-old; pl= placebo; IDB idebenone; CoQ= CoQ10; N= 7 per group. Bold characters = statistical significance
= p<0.05
= p<0.01
= p<0.001 (Mann Whitney test).
Fig. 3: CoQ levels in kidney of Pdss2kd/kd mice: CoQ10 supplementation partially increases CoQ levels in 6 months-old mutant and wild-type mice.
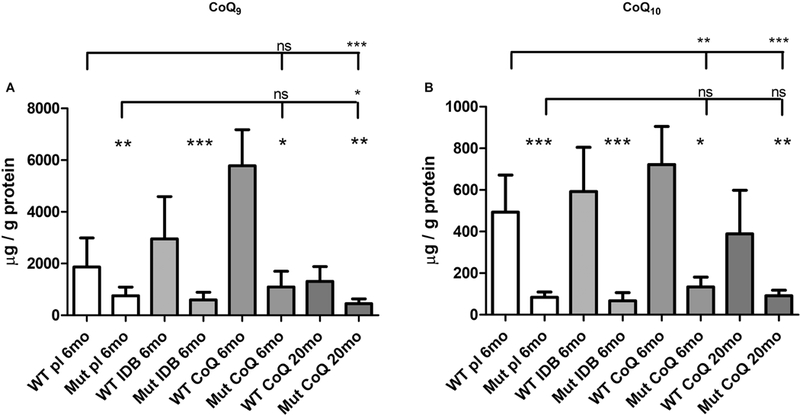
Amount of CoQ9 (A) and CoQ10 (B). Data are represented as mean ± standard deviation (N = 7). Mutant mice (Mut) are compared to age -matched controls (WT) under same treatment (pl = placebo; CoQ = CoQ10; IDB = Idebenone); 6mo = 6 months old; 20mo = 20 months old. * = p<0.05, ** = p<0.01, *** = p<0.001, ns = not significant (Mann Whitney test).
The levels of CoQ9 and CoQ10 in kidney of 6 month-old animals supplemented with CoQ10, were increased compared to animals in placebo (kidney CoQ9: WT CoQ 310% of placebo, p=0.0025; kidney CoQ10: WT CoQ 146% of placebo, p=0.045; kidney CoQ9: Mut CoQ 145% of placebo, p=0.32; kidney CoQ10: Mut CoQ 160% of placebo, p=0.073; Table 2, Fig. 3 A, B). However, they were still significantly reduced in mutant compared with wild-type animals (kidney CoQ9: Mut CoQ 19% of WT, p=0.016; kidney CoQ10: Mut CoQ 19% of WT, p=0.016; Table 2, Fig. 3 A, B).
On the contrary, levels of CoQ9 and CoQ10 were not increased in kidney of 20 month-old mutant animals supplemented with CoQ10 (kidney CoQ9: Mut CoQ 34% of WT, p=0.0012; kidney CoQ10: Mut CoQ 23% of WT, p=0.0017; Table 2, Fig. 3 A, B).
To assess whether levels of CoQ10 in kidney of 20 month-old animals supplemented were low because exogenous CoQ10 was metabolized, we measured CoQ9 and CoQ10 levels in plasma of 20 month-old CoQ-treated animals. However, the levels of CoQ10 were comparable in plasma of treated mutant and wild-type animals (Suppl. table 2, Suppl. fig. 1 C, F).
To assess whether exogenous CoQ10 accumulates in the liver, as previously reported (37, 38), we measured CoQ9 and CoQ10 in liver of 6 month-old and 20 month-old animals and found that CoQ10 supplementation increased liver CoQ10 levels in mutant and wild-type animals proportionally to the duration of the supplementation, and CoQ9 and CoQ10 in liver of treated mutants were comparable with treated wild-type animals (Suppl. table 2, Suppl. fig.1 B, E).
As expected, due to the poor bioavailability of CoQ10, supplementation did not change levels of CoQ9 and CoQ10 in brain of 6 and 20 month-old treated animals (Suppl. table 2, Suppl. fig. 1A, D).
IDB supplementation did not affect CoQ9 and CoQ10 values compared to placebo animals (Table 2, Fig. 3 A, B, and Suppl. table 2, Suppl. fig. 1 A, B, D, E).
These results indicate that CoQ10 supplementation causes accumulation of CoQ in plasma and liver, and partially and transiently increases CoQ levels in kidney.
3.4. CoQ10 supplementation does not rescues CoQ-dependent enzymes activities in kidney of Pdss2kd/kd mutant mice
To assess the effects of supplementations on mitochondrial bioenergetics, we measured the activities of the CoQ-dependent enzymes, complexes I+III and II+III.
In kidney of 6 month-old mutant animals in placebo complex I+III activity was slightly reduced compared with wild-type animals, and in 6 months-old mutant animals supplemented with CoQ10, it was slightly increased, compared with wild-type animals, although these differences were not statistically significant (Table 3, Fig. 4 A, B). On the contrary, complex II+III activity was significantly reduced in kidney of 6 month-old mutant animals in placebo, and showed a trend toward reduction in mutant animals in CoQ10, compared with wild-type animals (Table 3, Fig. 4 A, B). Importantly, both enzymes activities were significantly decreased in 20 month-old mutant animals supplemented with CoQ10 compared to wild-type (activity levels Mut/WT ratio; kidney complex I+III: placebo 6mo 0.75±0.44; CoQ 6mo 1.91±0.81; CoQ 20mo 0.37±0.25, p=0.0093; kidney complex II+III: placebo 6mo 0.62±0.33, p=0.029; CoQ 6mo 0.64±0.30; CoQ 20mo 0.50±0.28, p=0.0048; Table 3, Fig. 4 A, B).
Table 3: CoQ-dependent respiratory chain enzymes activities in kidney of Pdss2kd/kd mice.
Enzyme activities values are expressed as mean ± standard deviation micromoles per minute per mg of protein.
| Kidney | WT pl 6mo | Mut pl 6mo | WT IDB 6mo | Mut IDB 6mo | WT CoQ 6mo | Mut CoQ 6mo | WT CoQ 20mo | Mut CoQ 20mo |
|---|---|---|---|---|---|---|---|---|
| I+III | 0.21±0.1 | 0.16±0.09 | 0.13±0.08 | 0.08±0.04 | 0.3±0.05 | 0.57±0.24 | 0.15±0.11 | 0.05 ±0.03** |
| II+III | 0.18±0.03 | 0.11 ±0.06 * | 0.18±0.1 | 0.09±0.04 | 0.18±0.07 | 0.11±0.05 | 0.15±0.03 | 0.08 ±0.04** |
| CS | 3.18±1.76 | 3.24±0.98 | 2.63±1.87 | 2.2±1.09 | 7.34±2.43 | 6.68±2.94 | 2.62±1.34 | 3.4±1.77 |
WT= wild type; Mut= mutant, mo= month-old; pl= placebo; IDB idebenone; CoQ= CoQ10; CS = citrate synthase; I+II = complexes I+II; II+III = complexes II+III; N= 7 per group. Bold characters = statistical significance
= p<0.05
= p<0.01
= p<0.001 (Mann Whitney test).
Fig. 4: CoQ-dependent respiratory chain enzymes activities in kidney of Pdss2kd/kd mice: CoQ10 supplementation does not rescue mitochondrial respiratory chain function in mutant mice.
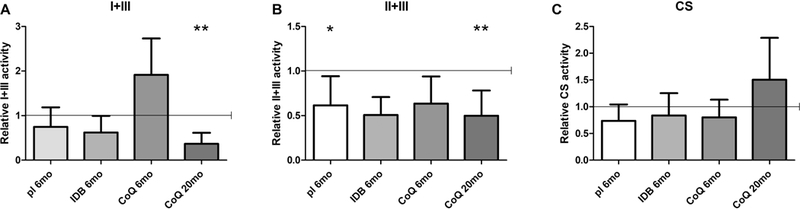
Complexes I+III (A), II+III (B) and citrate synthase (C) measured by spectrophotometric assay in kidney homogenates. Values are represented as fold changes of mutant mice (Mut) compared to age -matched controls (WT) under same treatment (pl = placebo; CoQ = CoQ10; IDB = Idebenone) (all set as 1, horizontal bar); CS = citrate synthase; I+II = complexes I+II; II+III = complexes II+III; 6mo = 6 months old; 20mo = 20 months old. Data are represented as mean ± standard deviation (N = 7 for group). * = p<0.05, ** = p<0.01 (Mann Whitney test).
In accordance with the normal respiratory chain enzyme activities of complex I and III, we observed normal assembly levels of respiratory chain supercomplexes, S1 (I-III-IV) and S0 (I-III) in kidney of placebo 6 month-old animals (data not shown).
Complex I+III and II+III activities in brain and liver of mutant mice were comparable to wild-type before and after the supplementation (Suppl. Table 3, Suppl. fig. 2 A, B, D, E).
IDB supplementation did not affect complex II+III activity, but decreased complex I+III activity, compared to placebo animals (Table 3, Fig. 4 A, B).
These results indicate that mitochondrial respiratory chain defects do not contribute to the pathogenesis of NS associated with CoQ deficiency.
3.5. Increased mitochondrial mass in kidney of Pdss2kd/kd mutant mice is a secondary effect of CoQ10 supplementation
Loss of mitochondrial mass, due to abnormal mitophagy has been documented in CoQ deficiency in vivo and in vitro (39–41). Therefore, we assessed kidney activity of citrate synthase (CS), a mitochondrial matrix enzyme, and the levels of TOM20, an outer mitochondrial membrane protein, both indices of mitochondrial mass. We found that CS activity was not altered in kidney of 6 month-old animals in placebo, IDB, and CoQ10 supplementation, and showed a trend toward increase in CoQ10 treated 20 month-old animals (Table 3, Fig. 4 C). Since CS activity was increased in 20 month-old animals supplemented with CoQ10, we normalized complexes activities over this index of mitochondrial mass, and we found them extremely reduced (activity levels Mut/WT ratio; kidney complex I+III/CS: placebo 6mo 0.65±0.42; IDB 6mo 0.58±0.35; CoQ 6mo 1.67±0.69; CoQ 20mo 0.44±0.26, p=0.029; kidney complex II+III/CS: placebo 6mo 0.89±0.34; IDB 6mo 0.41±0.21, p=0.036; CoQ 6mo 0.91±0.72; CoQ 20mo 0.25±0.08, p=0.0003; Table 3).
In kidney of 6 month-old mutant animals on placebo, CoQ10 or IDB, TOM20 levels were significantly decreased compared with wild-type animals (kidney TOM20 protein levels Mut/WT: placebo 6mo 0.47±0.28, p<0.0001; IDB 6mo 0.29±0.19, p<0.0001; CoQ 6mo 0.44±0.34, p=0.0011; Fig. 5). In 20 month-old mutant animals supplemented with CoQ10, the levels of TOM20 were comparable with controls (Fig. 5).
Fig. 5: Mitochondrial mass in kidney of Pdss2kd/kd mice: Decrease of mitochondrial mass is a secondary effect of CoQ10 deficiency.
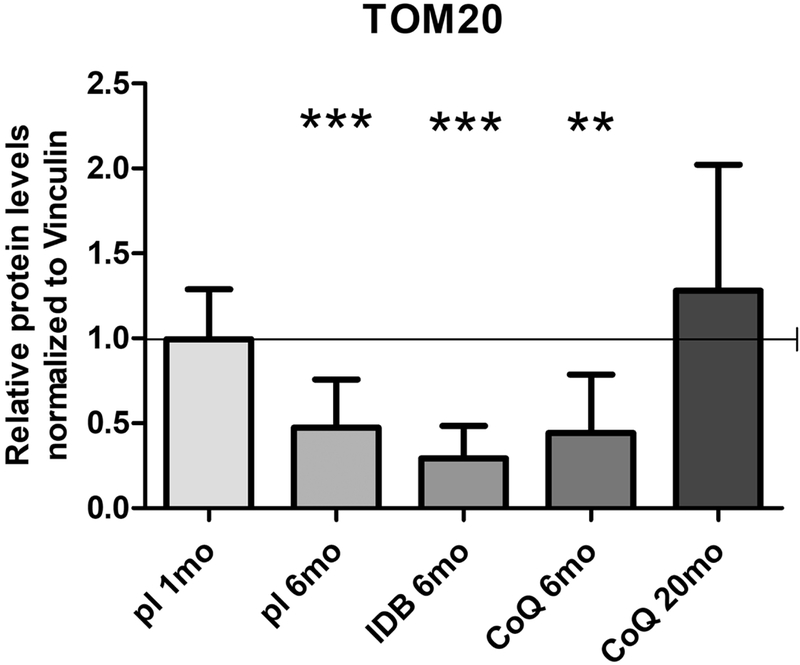
The levels of TOM20 were normalized to vinculin and represented as fold changes of mutant mice (Mut) compared to age -matched controls (WT) under same treatment (pl = placebo; CoQ = CoQ10; IDB = Idebenone) (all set as 1, horizontal bar), 1mo = 1 month-old, 6mo = 6 months old; 20mo = 20 months old. Data are represented as mean ± standard deviation (N = 4 for group). ** = p<0.01, *** = p<0.001 (Mann Whitney test).
To assess the disease stage at which loss of mitochondria occurs, we measured TOM20 levels in kidney of 1 month-old mutant animals, and we found them comparable to wild-type (Fig. 5).
In brain and liver, CS activity was normal in all groups (Suppl. Table 3, Suppl. Fig. 2 C, F). Interestingly, TOM20 levels were slightly reduced also in brain of 6 month-old untreated mutant animals compared with wild-type (Suppl. Fig 3).
These results suggest that the decrease in mitochondrial mass is a secondary effect of CoQ10 deficiency, and that the increase in mitochondrial mass is an effect of CoQ10 supplementation secondary to the rescue of other biochemical and molecular abnormalities.
3.6. CoQ10 supplementation reduces oxidative stress in kidney of Pdss2kd/kd mice
We previously showed that oxidative stress makers are increased only in kidney of Pdss2kd/kd mice (16). To assess the efficacy of CoQ10 and IDB as antioxidants, we performed immunofluorescence to measure levels of anti-nitrotyrosine and anti 4-hydroxynonenal, markers of protein and lipid oxidative stress, respectively. Surprisingly, CoQ10 supplementation reduces oxidative stress damage in 6 and 20 month-old mutant animals, while IDB supplementation did not have any effect on oxidative stress markers (Fig. 6). These results support the role of oxidative stress in the pathogenesis of CoQ10 deficiency and suggest that CoQ10 and IDB have different antioxidant properties.
Fig. 6: Oxidative stress in kidney of Pdss2kd/kd mice: CoQ10 supplementation improves oxidative stress.
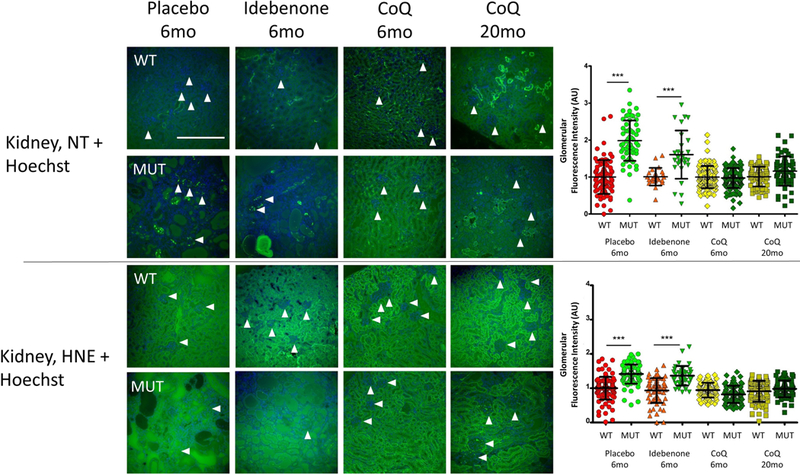
Representative images of anti- Nitrotyrosine and anti Hydroxynonenal staining to detect protein and lipid oxidation, and Hoechst to detect nuclei in mutant and control animals (N=3 for group). White arrows indicate single glomeruli. Magnification: 20×; NT = Nitrotyrosine; HNE = 4 Hydroxynonenal; WT = wild type; Mut = mutant; CoQ = CoQ10; 6mo= 6 months old; 20 mo = 20 months old; scale bar = 100μm. The graphics show the fluorescence intensity in the glomeruli. Data are represented as scatter plot measurements of single glomeruli fluorescence after background subtraction. Bars represent Mean ± standard deviation. *** = p<0.001 (One-way ANOVA with Tukey Post test). A.U. = Arbitrary Unit.
3.7. CoQ10 supplementation rescues H2S oxidation pathway in kidney of Pdss2kd/kd mice
As CoQ10 deficiency has been shown to cause impairment of H2S oxidation (18, 33), we assessed effects of CoQ10 supplementation on levels of the enzymes involved in the H2S oxidation pathway, sulfide quinone oxido-reductase (SQOR), thiosulfate sulfurtransferase (TST), persulfide dioxygenase (ETHE1) and sulfite oxidase (SUOX). We previously showed that in kidney of mutant 6 month-old mutant animals, levels of all the enzymes in this pathway are down-regulated (18).
Although in kidney of 6 month-old animals treated with CoQ10, SQOR and SUOX proteins levels were lower than controls, the reduction was less pronounced than in placebo animals (protein levels Mut/WT ratios; kidney: SQOR: CoQ 6mo 0.49±0.16, p<0.0001; SUOX: CoQ 6mo 0.53±0.16, p<0.0001; Fig. 7 A, D) while TST and ETHE1 levels were rescued (protein levels Mut/WT ratio; kidney: TST: CoQ 6mo 0.80±0.26; ETHE1: CoQ 6mo 0.59±0.12; Fig. 7 B, C). However, in CoQ10 treated 20 months-old mutants the levels of the four enzymes of the pathway showed no statistical difference compared to the CoQ10 treated wild- type animals (Fig. 7). These results indicate that the rescue of H2S oxidation defect is one of the first and lasting effects of CoQ10 supplementation.
Fig. 7: Protein levels of the enzymes of the H2S oxidation pathway in kidney of Pdss2kd/kd mice: CoQ10 supplementation rescues H2S oxidation impairment.
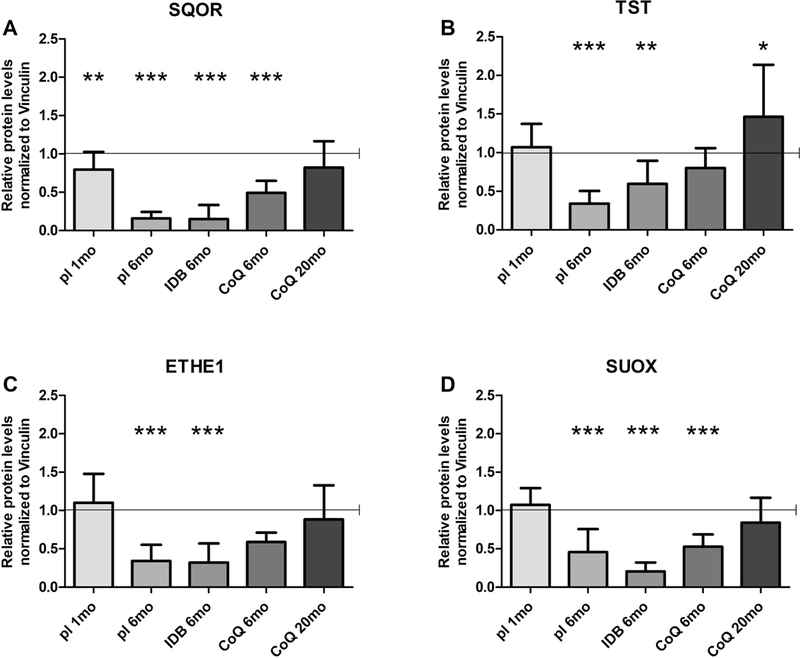
Protein amounts of SQOR (A), TST (B) ETHE1 (C) and SQOX (D) normalized to vinculin and represented as fold changes of mutant mice (Mut) compared to age -matched controls (WT) under same treatment (pl = placebo; CoQ = CoQ10; IDB = Idebenone) (all set as 1, horizontal bar), 1mo = 1 month-old, 6mo = 6 months old; 20mo = 20 months old. Data are represented as mean ± standard deviation (N=5 per group). * = p<0.05, ** = p<0.01, *** = p<0.001 (Mann Whitney test).
To assess whether impairment of the sulfides oxidation pathway occurs early in CoQ deficiency, we measured protein levels of the enzymes in 1 month-old mutant mice. We found that SQOR levels were already significantly decreased compared with controls, while the levels of the downstream enzymes were comparable with wild type animals (protein levels Mut/WT ratio; kidney: SQOR: placebo 1mo 0.79±0.23, p=0.0056; Fig. 7).
We previously showed that the mRNA levels of enzymes of the H2S oxidation were not decreased in kidney of 6 months untreated mutant animals. As expected, these levels were not affected by CoQ10 supplementation (Suppl. Fig. 4).
In brain, H2S oxidation pathway in 6 month-old mutant animals was comparable with wild-type, before and after CoQ10 supplementation (Suppl. Fig. 5). These findings indicate that decreased protein levels of SQOR, together with increased ROS production, comprise one of the first abnormalities occurring in kidney of Pdss2kd/kd mutant mice. Furthermore, they confirm our previous observation that CoQ levels regulate SQOR protein levels, which, in turn, modulate the downstream pathway (18).
3.8. CoQ10 supplementation normalizes plasma acylcarnitine profile in Pdss2kd/kd mice
H2S accumulation inhibits short-chain acyl-CoA dehydrogenase (SCAD), leading to a defect of short-chain fatty acid oxidation (18, 42–44). Thus, we assessed acylcarnitine profile in blood of 6 month-old Pdss2kd/kd mice and we found increased AC-4 and AC-6 levels, and slightly increased AC-5 levels (acylcarnitine levels Mut/WT ratio; plasma: AC-4: Mut placebo 6mo 2.36±0.67, p=0.036; AC-5: Mut placebo 6mo 1.67±0.52, p=0.14; AC-6: Mut placebo 6mo 2.28±1.12, p=0.036; Fig 8 A), which were normalized after CoQ10 supplementation (Fig 8 A). These findings provide further evidence that CoQ10 supplementation rescues H2S oxidation.
Fig 8: Short-chain acylcarnitines in plasma and T-GSH in kidney of Pdss2kd/kd mice. CoQ10 supplementation rescues detrimental effects of H2S oxidation impairment.
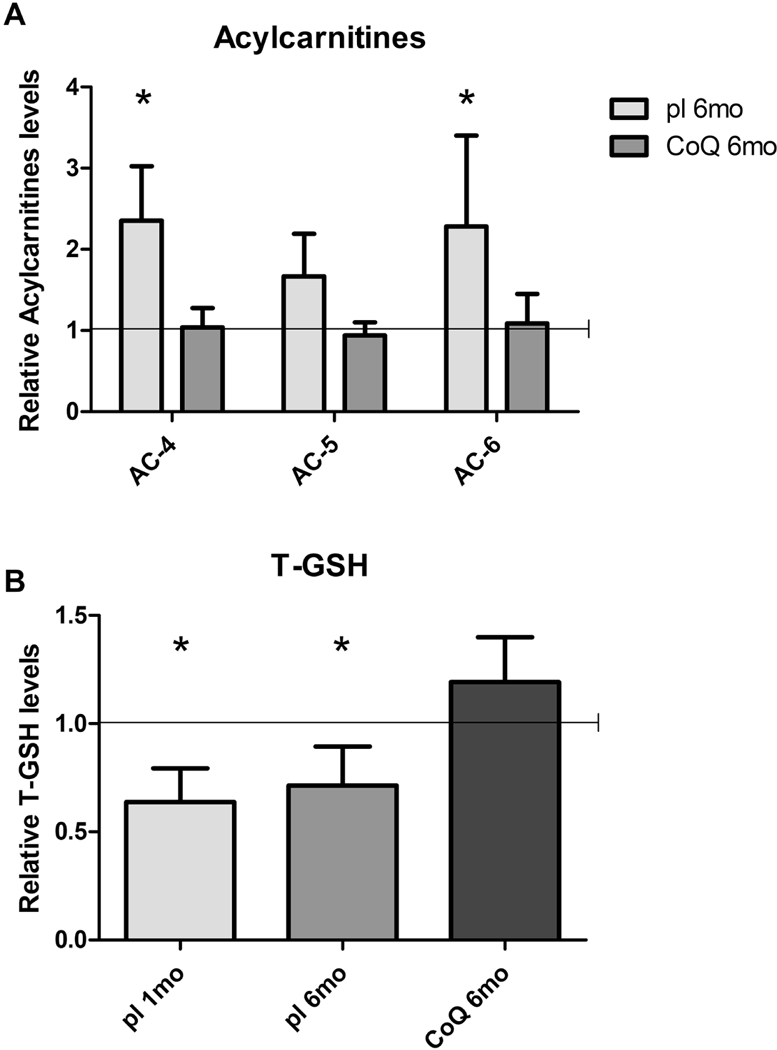
Levels of C4, C5 and C6 acylcarnitines (A) and levels of total GSH (B) are represented as fold changes of mutant mice (Mut) compared to age -matched controls (WT) under same treatment (pl = placebo; CoQ = CoQ10) (all set as 1, horizontal bar), lmo = 1 month-old, 6mo = 6 months old, T-GSH = total glutathione. Data are represented as mean ± standard deviation (N=5 for group). * = p<0.05 (Mann-Whitney test).
3.9. CoQ10 supplementation rescues total GSH in kidney of Pdss2kd/kd mice
Because defects in H2S oxidation may decrease GSH levels through several mechanisms (21), we measured total GSH levels in kidney of treated and untreated animals. In fact, we observed that GSH levels were reduced in kidney of 6 month-old mutant mice (18) (Fig 8 B), and were rescued by CoQ10 supplementation (total GSH levels Mut/WT ratio; kidney: Mut placebo 6mo 0.71±0.18, p=0.032; Mut CoQ 6mo 1.19±0.21, p=0.19; Fig 8 B). We also noted decreased GSH levels in pre-symptomatic stage of disease in kidney of 1 month-old mutant animals (total GSH levels Mut/WT ratio; kidney: Mut placebo 1mo 0.64±0.156, p=0.016; Fig 8 B). These data indicate that low levels of GSH contribute to the pathogenesis of CoQ deficiency- associated NS.
3.10. Knock-down of SQOR in COQ8A depleted HeLa cells reduces antioxidant efficacy of CoQ10
To evaluate whether the antioxidant effect of CoQ10 is mediated by modulation of SQOR protein levels, we compared effects of CoQ10 supplementation on levels of ROS in HeLa cells depleted of COQ8A, a CoQ biosynthesis regulatory protein and either with or without knockdown of SQOR transcript. COQ8A depleted cells, which have ~50% residual CoQ10, showed increased ROS levels compared to control cells (160% of untreated EV, p<0.0001; Fig. 9 A, B). As expected, SQOR knock-down in control cells (55% of untreated EV, p=0.0165; Fig. 9 C) significantly increased levels of ROS (184% of untreated EV, p<0.0001; Fig. 9 A, B). In COQ8A depleted cells, CoQ10 supplementation reduced ROS levels (62% of untreated CoQ8A depleted cells, p<0.0001;Fig. 9 A, B) and increased SQOR protein levels (134% of untreated CoQ8A depleted cells, p<0.0317; Fig. 9 C) However, knock-down of SQOR in COQ8A depleted cells, prevented antioxidant effects of CoQ10 supplementation (Fig. 9 A, B, C). Thesedata indicate that the antioxidant effects of CoQ10 are mediated by the regulation of SQOR levels.
Fig. 9: Effects of CoQ10 supplementation on ROS levels in SQOR and COQ8A depleted Hela cells: SQOR knock-down causes increase of ROS in wild-type cells and prevents antioxidant effects of CoQ10 in COQ8A depleted cells.
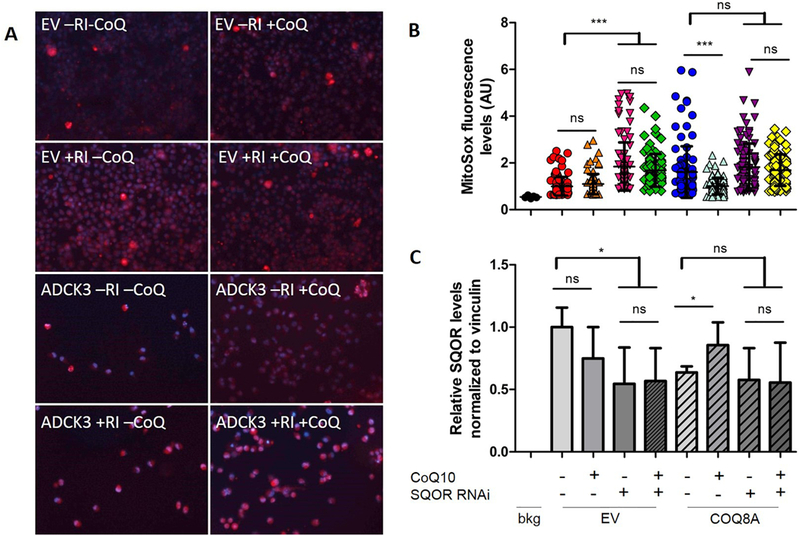
Representative images of HeLa cells stained with MitoSOX (red signal) to detect ROS, and Hoechst (blue signal) to detect nuclei (A). Quantification of red staining intensity. Data are represented as mean ± standard deviation (99 total readings from 3 independent experiments), ns = not significant; *** = p<0.001 (One way ANOVA test) (B). Protein amounts of SQOR normalized to vinculin and represented as fold changes compared to untreated EV (C). Bkg = background; EV = empty vector; RI = SQOR RNA interference; CoQ = CoQ10.
3.11. CoQ10 is not metabolized in kidney of Pdss2kd/kd mice
CoQ10 supplementation failed to completely rescue levels of CoQ10 in kidney of mutant animals. Because exogenous CoQ10 administered intraperitoneally to rat has been shown to be metabolized in kidney and excreted as metabolites in urine (2), we performed an ultra-carrying out liquid chromatography-mass spectrometer assay of urine from 6 month-old mutant and wild- type animals, with placebo or CoQ10 supplementation. However, we were not able to detect any CoQ10-derived metabolites (data not shown).
Lipidomics analysis of kidney and liver from 6 month-old Pdss2kd/kd mice also did not reveal CoQ10 metabolites (data not shown). However, we found that short and medium length acylcarnitines levels showed trends towards decreases in both tissues (Fig 10 A, B). Diacylglycerol and triacylglycerol were reduced in both tissues (diacylglycerol, kidney: Mut pl 29% of WT, p=0.15; liver: Mut pl 38% of WT, p <0.008; triacylglycerol, kidney: Mut pl 0.27% of WT, p=0.4; liver: Mut pl 0.43% of WT, p <0.008; Table 4, Fig. 10 C, D).
Fig. 10: Acylcarnitines, acylglycerols and cholesterols levels in kidney and liver of Pdss2kd/kd mice: CoQ deficiency leads to fatty acids and cholesterol metabolism alterations.
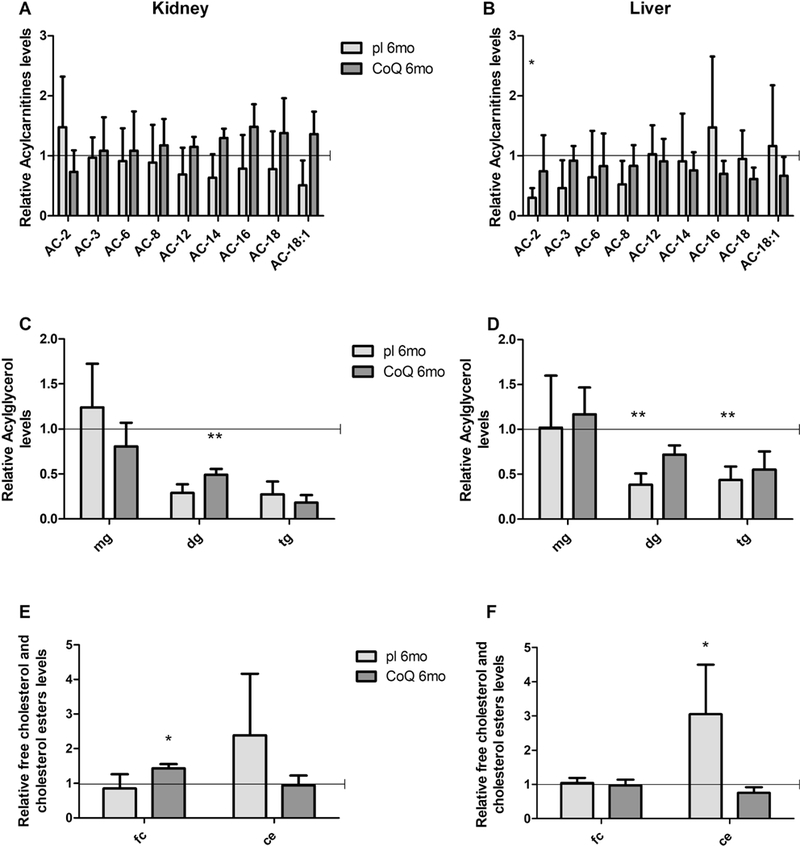
Levels of acylcarnitines (A, B), acylglycerols (C, D) free cholesterol and cholesterol esters (E, F) in kidney (A, C, E) and liver (B, D, F) are represented as fold changes of mutant mice (Mut) compared to age -matched controls (WT) under same treatment (pl = placebo; CoQ = CoQ10) (all set as 1, horizontal bar). 6mo = 6 months old, AC = acylcarnitine, mg = monoacylglycerol, dg = diacylglycerol, tg = triacylglycerol, fc = free cholesterol, ce = cholesterol esters. Data are represented as mean ± standard deviation (N=5 for group). * = p<0.05, ** = p<0.01 (Mann-Whitney test).
Table 4: acylglycerols and cholesterols levels in kidney and liver of Pdss2kd/kd mice.
Values are represented as fold changes of mutant group (Mut) compared to age-matched controls (WT) under same treatment.
| WT pl 6mo | Mut pl 6mo | WT CoQ 6mo | Mut CoQ 6mo | |
|---|---|---|---|---|
| Kidney | ||||
| mg | 1±0.54 | 1.24±0.48 | 1±0.32 | 0.81±0.26 |
| dg | 1±1.16 | 0.29±0.1 | 1±0.48 | 0.49±0.07** |
| tg | 1±1.05 | 0.27±0.14 | 1±0.66 | 0.18±0.08 |
| Fc | 1±0.41 | 0.85±0.41 | 1±0.26 | 1.43±0.12* |
| Ce | 1±0.75 | 3.4±2.74 | 1±0.55 | 0.94±0.28 |
| Liver | ||||
| mg | 1±0.35 | 1.02±0.58 | 1±0.28 | 1.17±0.3 |
| dg | 1±0.13 | 0.38±0.13** | 1±0.32 | 0.72±0.10 |
| tg | 1±0.21 | 0.44±0.15** | 1±0.59 | 0.55±0.20 |
| fc | 1±0.25 | 1.40±0.15 | 1±0.12 | 0.97±0.17 |
| ce | 1±0.19 | 3.06±1.45* | 1±0.12 | 0.76±0.16 |
WT= wild type; Mut= mutant, mo= month-old; pl= placebo; CoQ= CoQ10; mg = monoacylglycerol, dg = diacylglycerol, tg = triacylglycerol, fc = free cholesterol, ce = cholesterol esters; N= 5 per group. Bold characters = statistical significance
= p<0.05
= p<0.01
= p<0.001 (Mann Whitney test).
Lastly, cholesterol esters were increased in the mutant animals, and normalized by CoQ10 supplementation (kidney: Mut pl 239%, p=0.28; Mut CoQ 94% of WT, p=1; liver: Mut pl 305%, p<0.016; Mut CoQ 76% of WT, p=0.055; Table 4, Fig. 10 E, F). These results suggest that CoQ deficiency alters fatty acids oxidation, and cholesterol metabolism.
4. Discussion
This is the first study of a mouse model of primary CoQ10 deficient nephrotic syndrome that links impairment of sulfide metabolism to oxidative stress and therapeutic effects of longterm oral CoQ10 supplementation. Our results indicate that: 1) H2S oxidation impairment causes CoQ10 associated-NS; 2) decreased SQOR levels increase ROS production and oxidative stress in CoQ deficiency; and 3) long-term CoQ10 supplementation increases kidney CoQ levels sufficiently to rescue H2S oxidation by increasing SQOR levels thereby preventing renal failure.
Although previous studies explored the effects CoQ supplementation in Pdss2kd/kd mice, they were short-term studies, which showed improvement of NS, but did not elucidate the mechanism by which CoQ10 supplementation rescues kidney function (17, 45).
We previously showed that the increase of ROS levels is a kidney-specific phenomenon, and occurs in pre-symptomatic stage of disease, whereas impairment of CoQ-dependent respiratory chain activities is a late event (16). Here, we show that abnormalities in the H2S metabolism pathway are also early events, occurring in pre-symptomatic stage of disease. We have observed that CoQ10 supplementation rescues survival and prevents kidney failure in mutant animals, but does not correct respiratory chain enzymes activities. On the contrary, CoQ10 administration improves oxidative stress and rescues H2S oxidation proportionally to the duration of the supplementation and increases mitochondrial mass. These results support the hypothesis that H2S oxidation impairment and oxidative stress together contribute to the pathogenesis of NS in CoQ deficiency, while defects of mitochondrial respiratory chain enzymes activities are not detrimental.
The causal relationship between H2S oxidation impairment and oxidative stress is corroborated by our experiments in vitro. Knock-down of SQOR in wild-type HeLa cells increases ROS to levels comparable to CoQ10 deficient cells. Importantly, in CoQ deficient cells, CoQ10 antioxidant effects are associated with increased SQOR, and are prevented by its knocking-down.
The causative role of oxidative stress in the pathogenesis of CoQ deficiency is supported by several studies in vivo and in vitro. As previously observed in Pdss2kd/kd mutant mice, the onset of the diseases correlates with signs of increased oxidative stress in affected organs (16). Moderate CoQ deficiency in vitro leads to increased ROS levels and oxidative stress, which correlate with cell death, and they are both rescued by CoQ10 supplementation (46, 47). In contrast, severe CoQ10 deficiency in patients’ fibroblasts (46, 48), wild-type cells treated with inhibitors of CoQ10 biosynthesis (47), and CoQ-deficient murine cell lines (49) decreases mitochondrial respiration, without evidence of growth impairment or increased cell death.
Interestingly, we observed that kidney of Pdss2kd/kd mice does not have alteration of respiratory supercomplexes levels, as opposed to Coq9 knock-in mouse brain, the clinically affected organ, which showed higher levels of free complex III than complex I/III in supercomplexes (32, 50). In Coq9 knock-in mice, encephalopathy and respiratory chain activities defects in brain were ameliorated by supplementation with reduced CoQ10 (ubiquinol-10) (51), supporting our hypothesis that different pathomechanisms are responsible for the clinical heterogeneity of the disease. This difference can be explained by the fact that some of the proteins involved in CoQ biosynthesis, including COQ9, are organized in a complex (Q complex), and different molecular defects affecting the stability of these proteins variably affect stability of the CoQ biosynthetic complex (50), and, in turn, in the hypothesis of an interaction between Q biosynthetic complex and supercomplexes (Trevisson E, personal communication), the stability of the respiratory supercomplexes. However, COQ1, encoded by PDSs1 and PDSS2, is not part of the Q complex; therefore, mutations in PDSS2 do not alter the complex structure.
In support of the idea that NS is not caused by RC defects is the fact that NS is not common in mitochondrial respiratory chain deficiencies, whose more frequent manifestation of kidney dysfunction is proximal tubulopathy (52, 53). Nevertheless, NS can rarely occur in patients with the mitochondrial DNA m.3243A>G mutation, a frequent cause of MELAS (54), which has been associated with secondary CoQ deficiency (41). We recently showed that CoQ deficiency in vitro and in vivo causes H2S oxidation abnormalities with consequent H2S accumulation (18, 55). H2S is a gasotransmitter with several physiological functions, but when accumulated, is toxic. Therefore, H2S levels are tightly regulated by its synthesis and catabolism pathways (56, 57). Kidney might be particularly vulnerable because it produces H2S not only through the transulfuration pathway (using L-cysteine), but also through the DAO/3-MST pathway, in which 3-MP is generated from D-cysteine by D-amino acid oxidase (DAO) (58, 59). DAO is richly expressed in the kidney and may generate more H2S than the L-cysteine pathway (60). Interestingly, DAO is also highly expressed also in cerebellum (61, 62), which is another organ frequently affected in human CoQ10 deficiency, primary and secondary (63, 64). Although Pdss2kd/kd mice do not manifest cerebellar ataxia, conditional cerebellar Pdss2 knock-out mice develop cerebellar hypoplasia and ataxia (65).
However, other disorders of sulfide metabolism do not manifest glomerulonephropathy. For example, the levels of SQOR protein were significantly reduced in cerebrum, kidneys, and muscle of Coq9R239X mice, and in muscle of Coq9Q95X mice. In parallel to the reduction in SQOR protein levels, the activity of SQOR was significantly reduced in kidneys and muscle of Coq9R239X and Coq9Q95X mice (33). Also ETHE1 knock out mice do not manifest nephropathy despite the high thiosulfate and H2S concentrations in kidney (66). We have two possible explanations for the absence of nephropathy in these animals: 1) the severe encephalopathy causes early death and might mask the involvement of other organs, which would manifest later; 2) the phenotypic heterogeneity associated with different molecular defects might reflect tissue-specific vulnerability, compensatory mechanisms, alternative metabolic pathways for H2S detoxification, or different buffering mechanisms. Another difference between Pdss2kd/kd mice and ETHE1 knock out mice is the absence of COX deficiency in our model (18). As we previously discussed (18), we observed a mild accumulation of H2S in mutant mice kidney compared with controls (18). The only moderate increase in EES concentrations we observed might explain the absence of COX deficiency in the affected tissues of the Pdss2kd/kd mice. It is possible that in CoQ deficiency, where SQOR activity is reduced but not completely absent, H2S levels are not high enough to suppress COX activity in contrast to ethylmalonic aciduria, which presents with a much more severe phenotype and COX deficiency in patients. However, kidney and liver of ETHE1 knock out mice, in spite of high thiosulfate and H2S concentrations, have normal COX activity (66), again supporting the hypothesis that there are tissue-specific alternative metabolic pathways for H2S detoxification, or different buffering mechanisms. Interestingly, N-acetylcysteine (NAC) supplementation in ETHE1 mice prolongs survival but does not improve COX activity in brain and muscle (67), suggesting other mechanisms of H2S toxicity, including inhibition of short-chain fatty acid oxidation, GSH depletion and the ability of H2S to generate ROS, may play a role in the pathogenesis of the disease.
Although the link between oxidative stress and H2S in kidney physiology and pathology is rather controversial due to conflicting data in this field, ROS production has been implicated as mechanism of H2S toxicity (20, 21). Since we excluded the first mechanism (16, 18), we propose that low levels of GSH contribute to oxidative stress since we observed decreased GSH in kidney of 1 and 6 month-old Pdss2kd/kd mice, and GSH levels increased after CoQ10 supplementation. Low levels of GSH may be a direct consequence of the down-regulation of the H2S catabolic pathway and its intermediates. Alternatively, GSH deficiency might be due to limited availability of its precursor cysteine, because H2S accumulation in kidney of Pdss2kd/kd mice might trigger negative feedback on the H2S synthesis pathway, which uses cysteine as substrate. Finally, since we previously observed that CoQ10 deficiency in vitro causes increasing of S-sulfhydration of proteins involved in redox status of the cells (18), it is possible that this post-translational modification adversely affects their functions and contributes to oxidative stress in CoQ deficiency. In fact, protein S-sulfhydration has emerged as fundamental mechanism of H2S signalling (68, 69).
It is plausible that oxidative stress in CoQ deficiency is not caused exclusively by defects of H2S oxidation; however, our experiments in vitro indicate that the antioxidant effects of CoQ are mediated by regulation of SQOR levels. Since CoQ receives electrons from NADH through complex I, FADH2 through complex II, and H2S through SQOR (18), which is localized downstream of complex II and upstream of complex III, increased H2S oxidation induced by CoQ supplementation might decrease ROS generated by complex III. However, we can not exclude that ROS originate directly from SQOR, since H2S oxidation has been shown to be coupled with oxygen consumption (69, 70).
The severe deficiency of complexes T+TTT and TT+TTT might be responsible for the renal tubular oxidative stress observed in 20 month-old animals. Interestingly, specific defects in the mitochondrial respiratory chain increase ROS levels, which have been implicated in prolonging rather than decreasing lifespan (71, 72).
The lack of beneficial effects of TDB on oxidative stress in Pdss2kd/kd mice further indicates that CoQ10 prevents oxidative stress by indirect mechanisms, since TDB is a synthetic analog of CoQ10 with the same quinone moiety of CoQ10, but with a shorter, less lipophilic tail, whose anti-oxidant properties, in a context of normal values of CoQ10, are well known (22). However, previous work in cultured fibroblasts and isolated mitochondria showed that TDB might have pro-oxidant properties under certain in vitro conditions (26,73). The pro-oxidant effect of TDB is likely due to inhibition of complex T, as previously shown (24, 25) and confirmed by the complex I+III defect observed in our animals treated with IDB.
Kidney, together with brain and muscle, has been described as one of the organs with poorest uptake of CoQ10 (38), a data confirmed by two previous studies of short-term CoQ10 supplementation in Pdss2kd/kd mice (17, 45). However, studies of long-term CoQ supplementation in wild-type animals showed accumulation of CoQ in kidney (74). Our results not only confirm that long-term supplementation is necessary for CoQ10 to reach target organs, but they also demonstrate that even when CoQ10 reaches the target organ, not all of its biological functions are restored. Tt is noteworthy that SQOR and CoQ-dependent respiratory enzymes are both localized in the inner mitochondrial membrane and therefore should be equally reached by exogenous CoQ10. Our results can be explained by the existence of two pools of CoQ, with separate functions, one bound to mitochondrial respiratory chain supercomplexes (75), and a free pool in the inner mitochondrial membrane. Whether this free pool is merely a reservoir of an excess of CoQ molecules without a specific function, or the pool is necessary for the function of the respiratory chain and/or for additional functions is still debated (6, 76, 77). We hypothesize that CoQ10 oral supplementation increases the kidney free pool of CoQ, which might act as co-factor for SQOR, and not the CoQ bound to the supercomplexes. It is possible that CoQ10 supplementation transiently increases CoQ bound to the supercomplexes, but in the attempt to reach the equilibrium with the free pool it diffuses, leading to the severe deficit of both CI+III and CII+III activities observed in 20 months-old mutant supplemented animals. An alternative hypothesis is that SQOR binding site is easier to access for CoQ than CI and CII binding sites, explaining why SQOR levels increase proportionally to the duration of the supplementation, while CI+III and CII+III are not affected by CoQ10 supplementation. Another alternative hypothesis to explain how CoQ10 rescues SQOR levels but not respiratory chain enzymes activities is that exogenous CoQ10 can substitute CoQ9 (the main specie of CoQ in mice) as electrons acceptor of SQOR, but not in the respiratory chain. However, this hypothesis is unlikely since CoQ10 supplementation seems to equally increase CoQ9 and CoQ10 in kidney of Pdss2kd/kd, likely via CoQ10 conversion to CoQ9 (74). Importantly, in our study, CoQ supplementation did not affect SQOR transcriptional levels excluding the possibility that CoQ10 accumulation in liver might trigger liver-kidney signaling pathways that induce Sqor mRNA up- regulation.
Although previous studies of short-term intra-peritoneal administration of radioactive CoQ10 showed that exogenous CoQ10 is metabolized in the kidney, and revealed urine metabolites (2), our metabolomics analyses did not detect any metabolites of ubiquinone in kidney or urine of treated and untreated wild-type and mutant animals. Furthermore, lipidomic analysis of kidney and liver also exclude the presence of CoQ10-derived metabolites.
The lipidomic analysis also indicated that CoQ10 deficiency alters cholesterol homeostasis. Specifically, mutant mice showed significant increases in cholesterol esters (CEs) containing long-unsaturated acyl chain, which might result from up-regulation in the uptake of cholesterol, or reduction in its efflux. Interestingly, and in contrast to liver, CoQ10 supplementation rescued CEs levels in kidney, with a concomitant increase in the level of non- esterified cholesterol. In agreement with previous reports (78), this result suggests that CoQ10 supplementation activates cholesterol metabolism, in a tissue-specific manner.
One limitation of the study is that biochemical and molecular abnormalities, beside oxidative stress, were measured in the whole kidney, and not specifically in the glomerulus, which is particularly vulnerable to Pdss2 dysfunction. In fact, Peng and colleagues showed that disease manifestations originate specifically in glomerular podocytes, as renal disease is seen in podocytes conditional knockout mice but not in conditional knockouts targeted for example to renal tubular epithelium (27). The same group reported evidence of mitophagy in Pdss2kd/kd mice (79). Mitophagy was also reported in in vitro models of CoQ10 deficiency (41). We confirmed this data, which is in contrast with observations in patients with NS caused by COQ2 mutations (10). This discrepancy might be attributed to the rapid progression from onset of PROTEINURIA TO KIDNEY FAILURE IS MICE, WHICH DOES NOT ALLOW KIDNEY PROLIFERATION OF MITOCHONDRIA AS A TRANSITORY COMPENSATORY MECHANISM, AS OBSERVED IN HUMANS.
In conclusion, our work further elucidates the role of H2S oxidation impairment in the pathogenesis of CoQ deficiency, and reveals a novel antioxidant mechanism of action of CoQ10. These results not only are important to understand clinical heterogeneity and tissue-specificity of both primary and secondary CoQ deficiencies, but provide insight in a novel pathogenic pathway potentially relevant for other diseases.
Supplementary Material
Highlights.
Long-term oral CoQ10 supplementation rescues CoQ deficient- NS syndrome in Pdss2kd/kd mice
H2S impairment contributes to ROS production in CoQ deficiency
CoQ antioxidant effects are mediated by regulation of SQR protein levels
6. Acknowledgments
This work was supported by NIH P01 HD080642–01 (CMQ), NIH Clinical Translational Science Award (CTSA) UL1TR001873 (CMQ), and MINECO SAF2015–65786-R (LCL).
The funders had no role in study design, data collection and analysis, decision to publish, or preparation of the manuscript.
Footnotes
Conflict of interest statement
The authors have declared that no conflict of interest exists.
Publisher's Disclaimer: This is a PDF file of an unedited manuscript that has been accepted for publication. As a service to our customers we are providing this early version of the manuscript. The manuscript will undergo copyediting, typesetting, and review of the resulting proof before it is published in its final citable form. Please note that during the production process errors may be discovered which could affect the content, and all legal disclaimers that apply to the journal pertain.
8. References
- 1.Emma F, Salviati L. Mitochondrial cytopathies and the kidney. Nephrol Ther. 2017:13 Suppl 1:S23–S8. [DOI] [PubMed] [Google Scholar]
- 2.Bentinger M, Dallner G, Chojnacki T, Swiezewska E. Distribution and breakdown of labeled coenzyme Q10 in rat. Free Radic Biol Med. 2003:34(5):563–75. [DOI] [PubMed] [Google Scholar]
- 3.Zhang Y, Aberg F, Appelkvist EL, Dallner G, Ernster L. Uptake of dietary coenzyme Q supplement is limited in rats. J Nutr. 1995:125(3):446–53. [DOI] [PubMed] [Google Scholar]
- 4.Stefely JA, Pagliarini DJ. Biochemistry of Mitochondrial Coenzyme Q Biosynthesis. Trends Biochem Sci. 2017:42(10):824–43. [DOI] [PMC free article] [PubMed] [Google Scholar]
- 5.Acosta MJ, Vazquez Fonseca L, Desbats MA, Cerqua C, Zordan R. Trevisson E, et al. Coenzyme Q biosynthesis in health and disease. Biochimica et biophysica acta. 2016:1857(8):1079–85. [DOI] [PubMed] [Google Scholar]
- 6.Enriquez JA, Lenaz G. Coenzyme q and the respiratory chain: coenzyme q pool and mitochondrial supercomplexes. Molecular syndromology. 2014:5(3–4):119–40. [DOI] [PMC free article] [PubMed] [Google Scholar]
- 7.Lvon MF, Hulse EV. An inherited kidney disease of mice resembling human nephronophthisis. J Med Genet. 1971:8(1):41–8. [DOI] [PMC free article] [PubMed] [Google Scholar]
- 8.Lopez LC, Schuelke M, Quinzii CM, Kanki T, Rodenburg RJ, Naini A, et al. Leigh syndrome with nephropathy and CoQ10 deficiency due to decaprenyl diphosphate synthase subunit 2 (PDSS2) mutations. Am J Hum Genet. 2006:79(6): 1125–9. [DOI] [PMC free article] [PubMed] [Google Scholar]
- 9.Madaio MP, Ahima RS, Meade R, Rader DJ, Mendoza A, Peng M, et al. Glomerular and tubular epithelial defects in kd/kd mice lead to progressive renal failure. American journal of nephrology. 2005:25(6):604–10. [DOI] [PMC free article] [PubMed] [Google Scholar]
- 10.Diomedi-Camassei F, Di Giandomenico S, Santorelli FM, Caridi G, Piemonte F, Montini G, et al. COQ2 nephropathy: a newly described inherited mitochondriopathy with primary renal involvement. J Am Soc Nephrol. 2007:18(10):2773–80. [DOI] [PubMed] [Google Scholar]
- 11.Park E, Ahn YH, Kang HG, Yoo KH, Won NH, Lee KB, et al. COQ6 Mutations in Children With Steroid-Resistant Focal Segmental Glomerulosclerosis and Sensorineural Hearing Loss. Am J Kidney Dis. 2017:70(1):139–44. [DOI] [PubMed] [Google Scholar]
- 12.Heeringa SF, Chernin G, Chaki M, Zhou W, Sloan AJ, Ji Z, et al. COQ6 mutations in human patients produce nephrotic syndrome with sensorineural deafness. The Journal of clinical investigation. 2011:121(5):2013–24. [DOI] [PMC free article] [PubMed] [Google Scholar]
- 13.Gigante M, Diella S, Santangelo L, Trevisson E, Acosta MJ, Amatruda M, et al. Further phenotypic heterogeneity of CoQ10 deficiency associated with steroid resistant nephrotic syndrome and novel COQ2 and COQ6 variants. Clin Genet. 2017:92(2):224–6. [DOI] [PubMed] [Google Scholar]
- 14.Ashraf S, Gee HY, Woerner S, Xie LX, Vega-Warner V, Lovric S, et al. ADCK4 mutations promote steroid-resistant nephrotic syndrome through CoQ10 biosynthesis disruption. The Journal of clinical investigation. 2013:123(12):5179–89. [DOI] [PMC free article] [PubMed] [Google Scholar]
- 15.Feng C, Wang Q, Wang J, Liu F, Shen H, Fu H, et al. Coenzyme Q10 supplementation therapy for 2 children with proteinuria renal disease and ADCK4 mutation: Case reports and literature review. Medicine. 2017:96(47):e8880. [DOI] [PMC free article] [PubMed] [Google Scholar]
- 16.Quinzii CM, Garone C, Emmanuele V, Tadesse S, Krishna S, Dorado B, et al. Tissue-specific oxidative stress and loss of mitochondria in CoQ-deficient Pdss2 mutant mice. FASEB J. 2013:27(2):612–21. [DOI] [PMC free article] [PubMed] [Google Scholar]
- 17.Saiki R, Lunceford AL, Shi Y, Marbois B, King R, Pachuski J, et al. Coenzyme Q10 supplementation rescues renal disease in Pdss2kd/kd mice with mutations in prenyl diphosphate synthase subunit 2. American journal of physiology Renal physiology. 2008:295(5):F1535–44. [DOI] [PMC free article] [PubMed] [Google Scholar]
- 18.Ziosi M, Di Meo I, Kleiner G, Gao XH, Barca E, Sanchez-Quintero MJ, et al. Coenzyme Q deficiency causes impairment of the sulfide oxidation pathway. EMBO molecular medicine. 2017:9(1):96–111. [DOI] [PMC free article] [PubMed] [Google Scholar]
- 19.Gunasekar PG, Sun PW, Kanthasamy AG, Borowitz JL, Isom GE. Cyanide-induced neurotoxicity involves nitric oxide and reactive oxygen species generation after N-methyl-D-aspartate receptor activation. J Pharmacol Exp Ther. 1996:277(1):150–5. [PubMed] [Google Scholar]
- 20.Jiang J, Chan A, Ali S, Saha A, Haushalter KJ, Lam WL, et al. Hydrogen Sulfide--Mechanisms of Toxicity and Development of an Antidote. Sci Rep. 2016:6:20831. [DOI] [PMC free article] [PubMed] [Google Scholar]
- 21.Truong DH, Eghbal MA, Hindmarsh W, Roth SH, O’Brien PJ. Molecular mechanisms of hydrogen sulfide toxicity. Drug metabolism reviews. 2006:38(4):733–44. [DOI] [PubMed] [Google Scholar]
- 22.Gueven N, Woolley K, Smith J. Border between natural product and drug: comparison of the related benzoquinones idebenone and coenzyme Q10. Redox Biol. 2015:4:289–95. [DOI] [PMC free article] [PubMed] [Google Scholar]
- 23.Degli Esposti M, Ngo A, McMullen GL, Ghelli A, Sparla F, Benelli B, et al. The specificity of mitochondrial complex I for ubiquinones. Biochem J. 1996:313 ( Pt 1):327–34. [DOI] [PMC free article] [PubMed] [Google Scholar]
- 24.Esposti MD, Ngo A, Ghelli A, Benelli B, Carelli V, McLennan H, et al. The interaction of Q analogs, particularly hvdroxydecvl benzoquinone (idebenone), with the respiratory complexes of heart mitochondria. Arch Biochem Biophvs. 1996:330(2):395–400. [DOI] [PubMed] [Google Scholar]
- 25.Fato R, Bergamini C, Leoni S, Lenaz G. Mitochondrial production of reactive oxygen species: role of complex I and quinone analogues. BioFactors. 2008:32(1–4):31–9. [DOI] [PubMed] [Google Scholar]
- 26.Lopez LC, Quinzii CM, Area E, Naini A, Rahman S, Schuelke M, et al. Treatment of CoQ(10) deficient fibroblasts with ubiquinone, CoQ analogs, and vitamin C: time- and compound-dependent effects. PloS one. 2010:5(7):e11897. [DOI] [PMC free article] [PubMed] [Google Scholar]
- 27.Peng M, Falk MJ, Haase VH, King R, Polyak E, Selak M, et al. Primary coenzyme Q deficiency in Pdss2 mutant mice causes isolated renal disease. PLoS genetics. 2008:4(4):e1000061. [DOI] [PMC free article] [PubMed] [Google Scholar]
- 28.Wittig I, Carrozzo R, Santorelli FM, Schagger H. Functional assays in high-resolution clear native gels to quantify mitochondrial complexes in human biopsies and cell lines. Electrophoresis. 2007:28(21):3811–20. [DOI] [PubMed] [Google Scholar]
- 29.Wittig I, Karas M, Schagger H. High resolution clear native electrophoresis for in-gel functional assays and fluorescence studies of membrane protein complexes. Mol Cell Proteomics. 2007:6(7):1215–25. [DOI] [PubMed] [Google Scholar]
- 30.Zhang MZ, Yao B, Yang S, Yang H, Wang S, Fan X, et al. Intrarenal dopamine inhibits progression of diabetic nephropathy. Diabetes. 2012:61(10):2575–84. [DOI] [PMC free article] [PubMed] [Google Scholar]
- 31.Quinzii CM, Lopez LC, Von-Moltke J, Naini A, Krishna S, Schuelke M, et al. Respiratory chain dysfunction and oxidative stress correlate with severity of primary CoQ10 deficiency. FASEB J. 2008:22(6): 1874–85. [DOI] [PMC free article] [PubMed] [Google Scholar]
- 32.Garcia-Corzo L, Luna-Sanchez M, Doerrier C, Garcia JA, Guaras A, Acin-Perez R, et al. Dysfunctional Coq9 protein causes predominant encephalomvopathv associated with CoQ deficiency. Human molecular genetics. 2013:22(6): 1233–48. [DOI] [PubMed] [Google Scholar]
- 33.Luna-Sanchez M, Hidalgo-Gutierrez A, Hildebrandt TM, Chaves-Serrano J, Barriocanal-Casado E, Santos-Fandila A, et al. CoQ deficiency causes disruption of mitochondrial sulfide oxidation, a new pathomechanism associated with this syndrome. EMBO molecular medicine. 2017:9(1):78–95. [DOI] [PMC free article] [PubMed] [Google Scholar]
- 34.Bligh EG, Dyer WJ. A rapid method of total lipid extraction and purification. Can J Biochem Physiol. 1959:37(8):911–7. [DOI] [PubMed] [Google Scholar]
- 35.Chan RB, Oliveira TG, Cortes EP, Honig LS, Duff KE, Small SA, et al. Comparative lipidomic analysis of mouse and human brain with Alzheimer disease. The Journal of biological chemistry. 2012:287(4):2678–88. [DOI] [PMC free article] [PubMed] [Google Scholar]
- 36.Barisoni L, Madaio MP, Eraso M, Gasser DL, Nelson PJ. The kd/kd mouse is a model of collapsing glomerulopathy. J Am Soc Nephrol. 2005:16(10):2847–51. [DOI] [PMC free article] [PubMed] [Google Scholar]
- 37.Yuzuriha T, Takada M, Katayama K. Transport of [14C]coenzyme Q10 from the liver to other tissues after intravenous administration to guinea pigs. Biochimica et biophysica acta. 1983:759(3):286–91. [DOI] [PubMed] [Google Scholar]
- 38.Dallner G, Brismar K, Chojnacki T, Swiezewska E. Regulation of coenzyme Q biosynthesis and breakdown. BioFactors. 2003:18(1–4):11–22. [DOI] [PubMed] [Google Scholar]
- 39.Rodriguez-Hernandez A, Cordero MD, Salviati L, Artuch R, Pineda M, Briones P, et al. Coenzyme Q deficiency triggers mitochondria degradation by mitophagy. Autophagy. 2009:5(1):19–32. [DOI] [PubMed] [Google Scholar]
- 40.Lopez LC, Luna-Sanchez M, Garcia-Corzo L, Quinzii CM, Hirano M. Pathomechanisms in coenzyme q10-deficient human fibroblasts. Molecular syndromology. 2014:5(3–4):163–9. [DOI] [PMC free article] [PubMed] [Google Scholar]
- 41.Cotan D, Cordero MD, Garrido-Maraver J, Oropesa-Avila M, Rodriguez-Hernandez A, Gomez Izquierdo L, et al. Secondary coenzyme Q10 deficiency triggers mitochondria degradation by mitophagy in MELAS fibroblasts. FASEB J. 2011:25(8):2669–87. [DOI] [PubMed] [Google Scholar]
- 42.Pedersen CB, Bross P, Winter VS, Corydon TJ, Bolund L, Bartlett K, et al. Misfolding, degradation, and aggregation of variant proteins. The molecular pathogenesis of short chain acyl-CoA dehydrogenase (SCAD) deficiency. The Journal of biological chemistry. 2003:278(48):47449–58. [DOI] [PubMed] [Google Scholar]
- 43.Zafeiriou DI, Augoustides-Savvopoulou P, Haas D, Smet J, Triantafyllou P, Vargiami E, et al. Ethylmalonic encephalopathy: clinical and biochemical observations. Neuropediatrics. 2007:38(2):78–82. [DOI] [PubMed] [Google Scholar]
- 44.Barth M, Ottolenghi C, Hubert L, Chretien D, Serre V, Gobin S, et al. Multiple sources of metabolic disturbance in ETHE1-related ethylmalonic encephalopathy. Journal of inherited metabolic disease. 2010:33 Suppl 3:S443–53. [DOI] [PubMed] [Google Scholar]
- 45.Falk MJ, Polyak E, Zhang Z, Peng M, King R, Maltzman JS, et al. Probucol ameliorates renal and metabolic sequelae of primary CoQ deficiency in Pdss2 mutant mice. EMBO molecular medicine. 2011:3(7):410–27. [DOI] [PMC free article] [PubMed] [Google Scholar]
- 46.Quinzii CM, Lopez LC, Gilkerson RW, Dorado B, Coku J, Naini AB, et al. Reactive oxygen species, oxidative stress, and cell death correlate with level of CoQ10 deficiency. FASEB J. 2010:24(10):3733–43. [DOI] [PMC free article] [PubMed] [Google Scholar]
- 47.Quinzii CM, Tadesse S, Naini A, Hirano M. Effects of inhibiting CoQ10 biosynthesis with 4-nitrobenzoate in human fibroblasts. PloS one. 2012:7(2):e30606. [DOI] [PMC free article] [PubMed] [Google Scholar]
- 48.Desbats MA, Vetro A, Limongelli I, Lunardi G, Casarin A, Doimo M, et al. Primary coenzyme Q10 deficiency presenting as fatal neonatal multiorgan failure. European journal of human genetics : EJHG. 2015:23(91):1254–8. [DOI] [PMC free article] [PubMed] [Google Scholar]
- 49.Wang Y, Hekimi S. Mitochondrial respiration without ubiquinone biosynthesis. Human molecular genetics. 2013:22(23):4768–83. [DOI] [PMC free article] [PubMed] [Google Scholar]
- 50.Luna-Sanchez M, Diaz-Casado E, Barca E, Tejada MA, Montilla-Garcia A, Cobos EJ, et al. The clinical heterogeneity of coenzyme Q10 deficiency results from genotypic differences in the Coq9 gene. EMBO molecular medicine. 2015:7(5):670–87. [DOI] [PMC free article] [PubMed] [Google Scholar]
- 51.Garcia-Corzo L, Luna-Sanchez M, Doerrier C, Ortiz F, Escames G, Acuna-Castroviejo D, et al. Ubiquinol-10 ameliorates mitochondrial encephalopathy associated with CoQ deficiency. Biochimica et biophvsica acta. 2014:1842(7):893–901. [DOI] [PubMed] [Google Scholar]
- 52.Lee IC, Lee NC, Lu JJ, Su PH. Mitochondrial depletion causes neonatal-onset leigh syndrome, myopathy, and renal tubulopathy. J Child Neurol. 2013:28(3):404–8. [DOI] [PubMed] [Google Scholar]
- 53.Emma F, Montini G, Parikh SM, Salviati L. Mitochondrial dysfunction in inherited renal disease and acute kidney injury. Nat Rev Nephrol. 2016:12(5):267–80. [DOI] [PMC free article] [PubMed] [Google Scholar]
- 54.Carelli V, La Morgia C. Clinical syndromes associated with mtDNA mutations: where we stand after 30 years. Essays Biochem. 2018:62(3):235–54. [DOI] [PubMed] [Google Scholar]
- 55.Quinzii CM, Luna-Sanchez M, Ziosi M, Hidalgo-Gutierrez A, Kleiner G, Lopez LC. The Role of Sulfide Oxidation Impairment in the Pathogenesis of Primary CoQ Deficiency. Front Physiol. 2017:8:525. [DOI] [PMC free article] [PubMed] [Google Scholar]
- 56.Muller FH, Bandeiras TM, Urich T, Teixeira M, Gomes CM, Kletzin A. Coupling of the pathway of sulphur oxidation to dioxygen reduction: characterization of a novel membrane-bound thiosulphate:quinone oxidoreductase. Molecular microbiology. 2004:53(4):1147–60. [DOI] [PubMed] [Google Scholar]
- 57.Olson KR. H2S and polvsulfide metabolism: Conventional and unconventional pathways. Biochem Pharmacol. 2017. [DOI] [PubMed] [Google Scholar]
- 58.Shibuya N, Koike S, Tanaka M, Ishigami-Yuasa M, Kimura Y, Ogasawara Y, et al. A novel pathway for the production of hydrogen sulfide from D-cysteine in mammalian cells. Nature communications. 2013:4:1366. [DOI] [PubMed] [Google Scholar]
- 59.Kasinath BS, Feliers D, Lee HJ. Hydrogen sulfide as a regulatory factor in kidney health and disease. Biochem Pharmacol. 2017. [DOI] [PubMed] [Google Scholar]
- 60.Sacchi S, Cappelletti P, Murtas G. Biochemical Properties of Human D-amino Acid Oxidase Variants and Their Potential Significance in Pathologies. Front Mol Biosci. 2018:5:55. [DOI] [PMC free article] [PubMed] [Google Scholar]
- 61.Koga R Miyoshi Y, Sakaue H, Hamase K, Konno R Mouse d-Amino-Acid Oxidase: Distribution and Physiological Substrates. Front Mol Biosci. 2017:4:82. [DOI] [PMC free article] [PubMed] [Google Scholar]
- 62.Jagannath V, Brotzakis ZF, Parrinello M, Walitza S, Grunblatt E. Controversial Effects of D-Amino Acid Oxidase Activator (DAOA1/G72 on D-Amino Acid Oxidase (DAO1 Activity in Human Neuronal, Astrocyte and Kidney Cell Lines: The N-methyl D-aspartate (NMDA1 Receptor Hypofunction Point of View. Front Mol Neurosci. 2017:10:342. [DOI] [PMC free article] [PubMed] [Google Scholar]
- 63.Emmanuele V, Lopez LC, Berardo A, Naini A, Tadesse S, Wen B, et al. Heterogeneity of coenzyme Q10 deficiency: patient study and literature review. Arch Neurol. 2012:69(8):978–83. [DOI] [PMC free article] [PubMed] [Google Scholar]
- 64.Montero R, Pineda M, Aracil A, Vilaseca MA, Briones P, Sanchez-Alcazar JA, et al. Clinical, biochemical and molecular aspects of cerebellar ataxia and Coenzyme Q10 deficiency. Cerebellum. 2007:6(2):118–22. [DOI] [PubMed] [Google Scholar]
- 65.Lu S, Lu LY, Liu MF, Yuan QJ, Sham MH, Guan XY, et al. Cerebellar defects in Pdss2 conditional knockout mice during embryonic development and in adulthood. Neurobiology of disease. 2012:45(1):219–33. [DOI] [PubMed] [Google Scholar]
- 66.Tiranti V, Viscomi C, Hildebrandt T, Di Meo I, Mineri R, Tiveron C, et al. Loss of ETHE1, a mitochondrial dioxygenase, causes fatal sulfide toxicity in ethylmalonic encephalopathy. Nature medicine. 2009:15(2):200–5. [DOI] [PubMed] [Google Scholar]
- 67.Viscomi C, Burlina AB, Dweikat I, Savoiardo M, Lamperti C, Hildebrandt T, et al. Combined treatment with oral metronidazole and N-acetylcysteine is effective in ethylmalonic encephalopathy. Nature medicine. 2010:16(8):869–71. [DOI] [PubMed] [Google Scholar]
- 68.Mustafa AK, Gadalla MM, Sen N, Kim S, Mu W, Gazi SK, et al. H2S signals through protein S-sulfhydration. Science signaling. 2009:2(96):ra72. [DOI] [PMC free article] [PubMed] [Google Scholar]
- 69.Bouillaud F, Blachier F. Mitochondria and sulfide: a very old story of poisoning, feeding, and signaling? Antioxidants & redox signaling. 2011:15(2):379–91 [DOI] [PubMed] [Google Scholar]
- 70.Szabo C, Coletta C, Chao C, Modis K, Szczesny B, Papapetropoulos A, et al. Tumor-derived hydrogen sulfide, produced by cvstathionine-beta-svnthase. stimulates bioenergetics. cell proliferation, and angiogenesis in colon cancer. Proceedings of the National Academy of Sciences of the United States of America. 2013;110(30):12474–9. [DOI] [PMC free article] [PubMed] [Google Scholar]
- 71.Wang Y, Hekimi S. Understanding Ubiquinone. Trends in cell biology. 2016;26(5):367–78. [DOI] [PubMed] [Google Scholar]
- 72.Scialo F, Sriram A, Fernandez-Avala D, Gubina N, Lohmus M, Nelson G, et al. Mitochondrial ROS Produced via Reverse Electron Transport Extend Animal Lifespan. Cell metabolism. 2016;23(4):725–34. [DOI] [PMC free article] [PubMed] [Google Scholar]
- 73.Fato R, Bergamini C, Bortolus M, Maniero AL, Leoni S, Ohnishi T, et al. Differential effects of mitochondrial Complex I inhibitors on production of reactive oxygen species. Biochimica et biophysica acta. 2009; 1787(5):384–92. [DOI] [PMC free article] [PubMed] [Google Scholar]
- 74.Sohal RS, Kamzalov S, Sumien N, Ferguson M, Rebrin I, Heinrich KR, et al. Effect of coenzyme Q10 intake on endogenous coenzyme Q content, mitochondrial electron transport chain, antioxidative defenses, and life span of mice. Free Radic Biol Med. 2006;40(3):480–7. [DOI] [PMC free article] [PubMed] [Google Scholar]
- 75.Acin-Perez R, Fernandez-Silva P, Peleato ML, Perez-Martos A, Enriquez JA. Respiratory active mitochondrial supercomplexes. Mol Cell. 2008;32(4):529–39. [DOI] [PubMed] [Google Scholar]
- 76.Moreno-Loshuertos R, Enriquez JA. Respiratory supercomplexes and the functional segmentation of the CoQ pool. Free Radic Biol Med. 2016;100:5–13. [DOI] [PubMed] [Google Scholar]
- 77.Benard G, Faustin B, Galinier A, Rocher C, Bellance N, Smolkova K, et al. Functional dynamic compartmentalization of respiratory chain intermediate substrates: implications for the control of energy production and mitochondrial diseases. Int J Biochem Cell Biol. 2008;40(8):1543–54. [DOI] [PubMed] [Google Scholar]
- 78.Allen RM, Vickers KC. Coenzyme Q10 increases cholesterol efflux and inhibits atherosclerosis through microRNAs. Arteriosclerosis-thrombosis, and vascular biology. 2014;34(9):1795–7. [DOI] [PMC free article] [PubMed] [Google Scholar]
- 79.Peng M, Jarett L, Meade R, Madaio MP, Hancock WW, George AL, et al. Mutant prenyltransferase-like mitochondrial protein (PLMP) and mitochondrial abnormalities in kd/kd mice. Kidney international. 2004;66(1):20–8. [DOI] [PMC free article] [PubMed] [Google Scholar]
Associated Data
This section collects any data citations, data availability statements, or supplementary materials included in this article.