Abstract:
During the pathogenesis of early atherosclerosis, lipid-loaded macrophages are involved in plaque development and progression. As a novel adipokine, C1q/tumor necrosis factor–related protein-9 (CTRP9) has beneficial effects in cardiovascular disease. However, previous reports have not studied whether the formation of macrophage foam cell induced by oxidized low-density lipoprotein (ox-LDL) is affected by CTRP9. According to our study, in ox-LDL–induced THP-1 macrophages, CTRP9 could reduce the quantity of lipid droplets, lower the level of cholesteryl ester (CE), promote cholesterol efflux, as well as increase the expression level of the cholesterol transport receptors ATP-binding membrane cassette transporter A1 (ABCA1) and G1 (ABCG1). In addition, the protein of LC3 II is elevated and that of p62 is decreased in CTRP9-treated foam cells by enhancing autophagy. However, using 3-methyladenine (3-MA) abolished the role of CTRP9 by inhibiting autophagy. Mechanistically, the autophagy-promoting effects of CTRP9 on foam cells was reversed by an AMPK inhibitor, Compound C, which inhibited the signaling pathway of adenosine 5′-monophosphate (AMP)-activated protein kinase (AMPK)/mammalian target of rapamycin (mTOR). These results show that CTRP9 protects against atherosclerosis by promoting cholesterol efflux to reduce the formation of foam cell in virtue of inducing autophagy in an AMPK/mTOR signaling pathway–dependent manner.
Key Words: CTRP9, atherosclerosis, foam cell, autophagy, cholesterol efflux
INTRODUCTION
Atherosclerosis is the leading cause of death due to cardiovascular events.1 In the pathogenesis of atherosclerosis, the foam cells formed by macrophages in the intima contribute to inflammation and atherosclerotic lesion formation.2 The scavenging of arterial cholesterol by macrophages is beneficial, but an overwhelming amount of ox-LDL accumulation in macrophages leads to an inflammatory response in lesions, which further contributes to disease progression.3 Macrophages engulf ox-LDL from the periphery and transport intracellular cholesterol into extracellular high-density lipoprotein (HDL) as well as human apolipoprotein A-1 (apoA-1),4,5 which is primarily controlled by ABCA1 and ABCG1.6 If the accumulation rate of cholesterol exceeds that of its export in macrophages, CE will accumulate within cytoplasmic lipid droplets.7 Many studies have indicated that reducing the macrophage-derived foam cell formation by the promotion of cholesterol efflux may be an effective antiatherogenic treatment.8–10
Autophagy is a complex cellular catabolic process that participates in initiating and developing numerous diseases, such as tumors and neurodegenerative and cardiovascular disorders.11–13 In terms of cardiovascular effects, atherosclerosis research has shown that autophagy deficiency leads to inflammasome hyperactivation,14 whereas moderate activation of autophagy can effectively inhibit atherosclerosis.15 Promoting autophagy attenuates vascular smooth muscle cell (VSMC) apoptosis, which contributes to antiatherosclerotic effects.16 Recently, it has been proved that the autophagic–lysosomal system can remarkably promote cytoplasmic CE hydrolysis by lysosomal acid lipase to increase cholesterol efflux,17 in contrast to the traditional view that all cytoplasmic CE hydrolysis can only be induced by natural CE hydrolases. Autophagy regulates cholesterol efflux in macrophages and has been treated as a potential therapeutic target for atherosclerosis.18,19
CTRP9 is a novel adipocytokine that is part of the C1q family and has properties similar to those of adiponectin with respect to lipid and glucose metabolism.20–22 The cardiovascular system is beneficially affected by CTRP9 through the AMPK signaling pathway, including through inhibition of proinflammatory cytokine production23 and VSMC proliferation,24 as well as through the promotion of vascular relaxation25 and carotid plaque stability.26 Moreover, we recently observed that CTRP9 inhibits VSMC cholesterol uptake and suppresses the VSMC-to-macrophage–like switch.27 However, previous studies did not discuss whether CTRP9 can impact the formation of macrophage foam cell induced by ox-LDL. Therefore, this study aims to establish whether CTRP9 can inhibit foam cell formation by activating autophagy and to determine the potential mechanism of CTRP9 in foam cells.
MATERIALS AND METHODS
Materials
Human THP-1 monocytes used in the study were provided by the American Type Culture Collection (ATCC, Manassas, VA). Fetal bovine serum and RPMI 1640 medium were, respectively, supplied by HyClone (Logan, UT) and HyClone-Thermo Fisher Scientific (Waltham, MA). R&D Systems (Minneapolis, MN) and MedChem Express (Monmouth Junction, NJ) provided the recombinant human CTRP9 (6537-TN-050) and Compound C, respectively. 3-Methyladenine (3-MA), chloroquine, paraoxon, apoA-1, phorbol-12-myristate-13-acetate (PMA), Oil Red O, vinblastine, Harris hematoxylin, as well as a cholesterol quantitation kit (MAK043) were obtained from Sigma-Aldrich (St. Louis, MO). The cholesterol efflux assay kit was provided by BioVision (Milpitas, CA). Yiyuan Biotechnologies (Guangzhou, China) supplied the ox-LDL, HDL, and human LDL. A Cell Counting Kit-8 (CCK-8) used was obtained from Dojindo (Kumamoto, Japan). The dual-tagged LC3 (mRFP-GFP-LC3) adenovirus was obtained from Hanbio Biotechnology (Shanghai, China). The antibodies against ABCA1, ABCG1, phospho(p)-mTOR, and total mTOR were provided by Abcam (Cambridge, MA). The antibodies against LC3 II, p62, phospho(p)-AMPK, and total AMPK were provided by Cell Signaling Technology (Beverly, MA). ZSGB-BIO (Beijing, China) supplied the β-actin and peroxidase-conjugated secondary antibodies. The enhanced chemiluminescence reagents were purchased from Wanleibio (Shenyang, China).
Cell Culture
THP-1 cells were cultured in a 5% CO2 humid incubator at 37°C with RPMI 1640, which contains 10% fetal bovine serum and 1% penicillin–streptomycin. The addition of 100 ng/mL PMA into THP-1 cell for 48 hours aims to induce the differentiation of THP-1 cell into macrophages. Next, phosphate-buffered saline (PBS) was used to wash these macrophages, followed by adding 50 μg/mL ox-LDL in fresh RPMI 1640 medium to establish a model of atherosclerosis-associated macrophage foam cells. Subsequently, we replaced the medium, and incubated the foam cells with CTRP9 at given concentrations for another 24 hours. To illustrate how certain mechanisms are influenced by CTRP9, the lysosomal lipolysis inhibitor chloroquine (20 μM) or the neutral lipolysis inhibitor paraoxon (10 μM) was added with CTRP9, the autophagy inhibitors 3-MA (10 mM) as well as the vinblastine (20 μM), or the AMPK pathway inhibitor Compound C (10 μM) was added 30 minutes before CTRP9 treatment.
Preparation of ox-LDL
Briefly, 5-µM Cu2SO4 (oxidant) was used to oxidize human LDL in PBS under the temperature of 37°C. The oxidation was largely dependent on the addition of excess EDTA-Na2. The agarose gel electrophoresis was adopted to analyze each lot for migration versus LDL. Compared with native LDL, ox-LDL exhibited a stronger 2.0-fold migration. The colorimetric method was able to decide the thiobarbituric acid–reactive substances based on malondialdehyde. The starting LDL was 0.35 nmoles of MDA/mg protein and the starting ox-LDL was 20.3 nmoles of MDA/mg protein.
CCK-8 Assay
After treating macrophage foam cells with different concentrations of CTRP9 in a 96-well plate for 24 hours, each well was added with 10 μL of CCK-8 solution and were incubated for 2 hours under a temperature of 37°C. Subsequently, the colour intensity was measured at an absorbance of 450 nm (Tecan Infinite M200 microplate reader; LabX, Austria) to access cell viability. Three separated experiments were conducted 3 times.
Lipid Staining by Oil Red O
After using CTRP9 with different concentrations to treat macrophage foam cells for a predetermined time as described above, the supernatants had been removed, and the cells were washed by the use of PBS. Subsequently, the washed cells were placed in 4% paraformaldehyde lasting for 10 minutes. Thereafter, the cells were washed again, 60% isopropanol was added for 3 minutes, after which cells were under staining treatment of premixed Oil Red O for 30 minutes followed by being dyed with hematoxylin for 40 seconds. For the last time of washing, the cells were photographed using by phase-contrast microscope (DMI4000B; Leica, Wetzlar, Germany).
Cholesterol Concentration Assay
A cholesterol quantitation kit was used to measure the amounts of total cholesterol as well as free cholesterol in the cells that had been treated based on colorimetric detection. Cells were treated as described above and sample preparation was performed as previously described.27 The absorbance of each sample reached 570 nm, and the quality of cholesterol was calculated according to its molecular weight. Finally, conjugated cholesterol was represented by CE, calculated with the following formula: CE = total cholesterol − free cholesterol. Involved experiments were conducted 3 times.
Cholesterol Efflux Assay
Differentiated macrophages were cultured with fluorescence-labeled cholesterol and equilibration buffer in a black 96-well plate at 37°C overnight. After 16 hours, CTRP9 with designated concentrations was used to culture the abovementioned cells in the presence of human HDL with concentration of 50 μg/mL or apoA-1 with concentration of 10 μg/mL, which served as a cholesterol acceptor. After incubating for another 6 hours, we transferred the supernatant into a new 96-well plate. The cell monolayer was lysed and mixed by pipetting. The absorbance of the supernatant and the cell monolayer was measured at 482/515 nm. The following formula was used to assess cholesterol efflux: Cholesterol efflux (%) = Fluorescence intensity of the media/(Fluorescence intensity of the cell lysate + media) × 100.
Western Blot Assay
Radio-Immunoprecipitation Assay (RIPA) lysis buffer was used to lyse the cultured cells for 30 minutes under a temperature of 4°C, after which a bicinchoninic acid kit (Beyotime Biotech, Shanghai, China) was used to test the protein concentration. An equal amount of cell lysate was heated aiming at denaturing proteins, which were then resolved by a 10% or 12% sodium dodecyl sulfate–polyacrylamide gel electrophoresis before being transported to polyvinylidene fluoride (PVDF) membranes (Millipore, Billerica, MA). The blots had been blocked for 1 hour after being incubated using different primary antibodies overnight under temperature of 4°C, including LC3 II (1:1000), p62 (1:1000), ABCA1 (1: 500), ABCG1 (1:1000), p-AMPK (1:1000), AMPK (1:1000), mTOR (1:1000), p-mTOR (1:1000), and β-actin (1:2000). These membranes were washed and then accepted 1-hour incubation by a horseradish peroxidase (HRP)-conjugated second antibody (1:10,000) at room temperature for 1 hour. Finally, enhanced chemiluminescence detection reagents were used to visualize protein bands based on an imaging system (Tanon, Shanghai, China; 6600). ImageJ (NIH, Bethesda, MD) was adopted to quantify each band. Three experiments were conducted separately.
Autophagy Flux Analysis
Briefly, THP-1 macrophages were transfected with mRFP-GFP-LC3 adenovirus in a fresh complete medium for 4 hours. Then, PBS was used to wash cells to be cultured with ox-LDL in a serum-free medium to generate foam cells, followed by the addition of CTRP9 with or without vinblastine treatment for another 24 hours. Cells were photographed using by a phase-contrast microscope (DMI4000B; Leica).
Statistics
Data obtained represented the mean ± SD. GraphPad Prism (GraphPad Software, San Diego, CA) was adopted to analyze measurements. Multiple comparisons among different groups were assessed in virtue of the 1-way analysis of variance and Tukey's post hoc test. No less than 3 experiments were performed separately, and P < 0.05 was defined as significant.
RESULTS
CTRP9 Inhibits Formation of THP-1 Macrophage-Derived Foam Cell and Promotes Cholesterol Efflux
First, different concentrations of CTRP9 (0, 0.3, 1, 3, 5, and 10 μg/mL) were added to foam cells for 24 hours to assess cytotoxicity. As shown in Figure 1A, cell viability exhibited an obvious downtrend at 5 and 10 μg/mL but was not affected below 3 μg/mL CTRP9. Thus, 0.3, 1, and 3 μg/mL CTPR9 were used in our experiments. To visually assess the formation of foam cells and to detect intracellular lipid accumulation, Oil Red O staining method coupled with a cholesterol concentration assay was performed. Figures 1B, C indicated that a significant number of lipid droplets accumulated, and cellular CE levels increased after exposure to ox-LDL with a concentration of 50 μg/mL. When different concentrations of CTRP9 were added to the foam cells, both lipid droplets and CE decreased in a dose-dependent manner. To illustrate how CTRP9 decreased cellular cholesterol levels, we observed that CTRP9 enhanced foam cell cholesterol efflux when human apoA-1 or HDL was added to serum-free media as cholesterol effluent receptors, as shown in Figure 2A. Considering that cholesterol efflux is closely related to reverse cholesterol transporters, the protein level of both ABCA1 and ABCG1 in foam cells was evaluated, observing that CTRP9 contributed to the increase in their expression levels (Fig. 2B).
FIGURE 1.
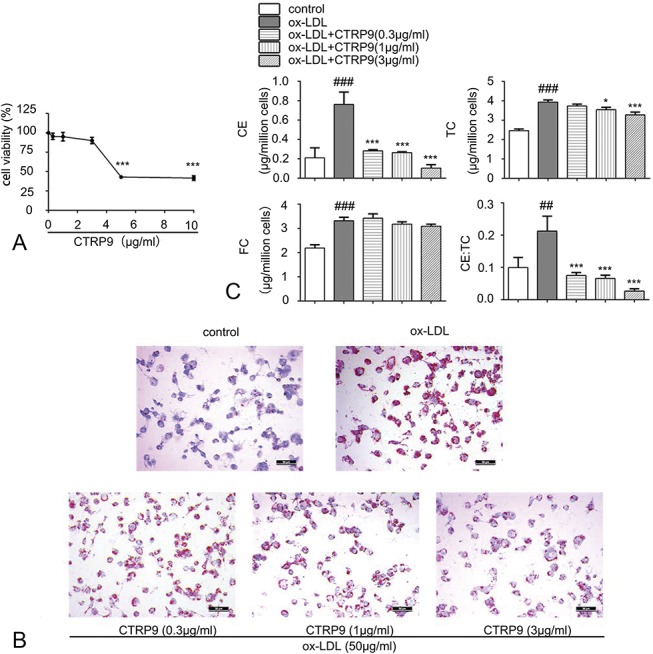
CTRP9 subdues the formation of foam cell induced by ox-LDL in THP-1 macrophages. A, Impact of different CTRP9 concentrations on viability of foam cell derived from THP-1 macrophage. THP-1 macrophages undertook a 24-hour culture with ox-LDL (50 µg/mL), followed by the 24-hour addition of increasing doses of CTRP9 (0–10 μg/mL). The CCK-8 assay was adopted to detect the cell viability (mean ± SD). B, THP-1–derived macrophages accepted 24-hour culture in the presence or absence of ox-LDL (50 µg/mL). The media were then replaced, and macrophages were treated with or without CTRP9 with concentration of 0.3, 1, and 3 μg/mL, respectively, for another 24 hours. Then, Oil Red O as well as Harris hematoxylin were used to stain these macrophages. A microscope with magnification ×200 was used to observe the cells. C, Detect the cholesterol content to assess the lipid deposition. The methodology of measurement is given in material and methods. Values obtained represented the mean ± SD of 3 separated experiments. *P < 0.05 and ***P < 0.001 versus the ox-LDL group; ##P < 0.01 and ###P < 0.001 versus the control group.
FIGURE 2.
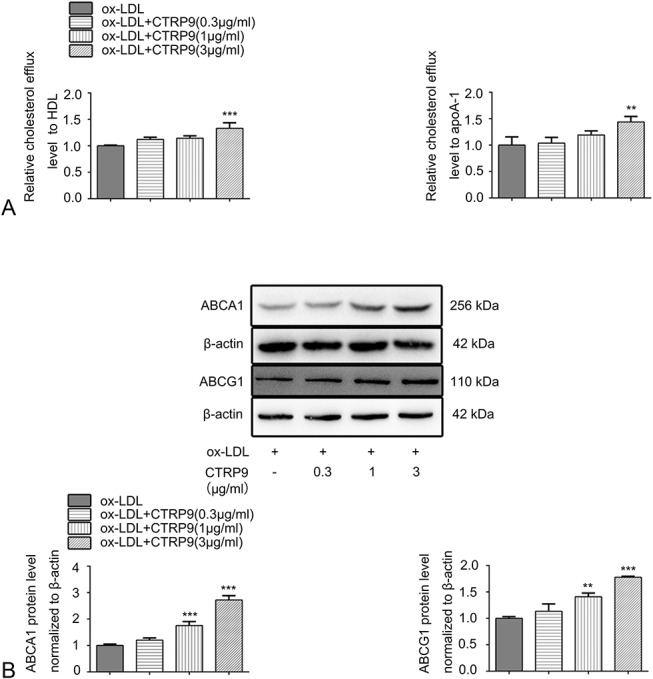
CTRP9 increases the cholesterol efflux level as well as the protein expression level of reverse cholesterol transporters in foam cells. A, Per the cholesterol efflux assay kit instructions, differentiated macrophages were cultured for 16 hours using the fluorescence-labeled cholesterol, followed by being treated with CTRP9 (0.3, 1, and 3 μg/mL) and human HDL with a concentration of 50 μg/mL or apoA-1 with a concentration of 10 μg/mL. The data are expressed as levels relative to those in the ox-LDL group. B, Protein expression level of ABCA1 and ABCG1 were accessed by Western blot after the foam cells were treated with different concentrations of CTRP9. Values obtained represent the mean ± SD of 3 experiments performed separately. **P < 0.01 and ***P < 0.001 versus the ox-LDL group.
CTRP9 Promotes Cholesterol Efflux Through the Acid Lipolysis Pathway and Enhances Autophagy in ox-LDL–Induced THP-1 Macrophages
To distinguish the roles that acid lipolysis and neutral lipolysis play in the process of CTRP9-induced cholesterol efflux, paraoxon or chloroquine were added to disrupt neutral CE hydrolysis and lysosomal CE hydrolysis, respectively. Oil Red O staining revealed that 3 μg/mL CTRP9 reduced the quantity of lipid droplets. This decrease could be obviously abolished by treating the foam cells with chloroquine but not with paraoxon (Fig. 3A). Consistent with this finding, the cholesterol efflux level was decreased only when chloroquine was present (Fig. 3B). Therefore, lysosomal acid lipase–mediated acid lipolysis plays the dominant role in increasing the cholesterol efflux by CTRP9. We also studied whether CTRP9 could activate autophagy in foam cells. LC3 II is an effector of autophagosome formation, and p62 is a receptor of autophagy substrates, both of which are essential autophagic markers. We detected protein levels of LC3 II and p62 between different groups based on the analysis of Western blot. Compared with the control group, in the ox-LDL group, the protein expression level of LC3 II was downregulated, whereas that of p62 was upregulated (Figs. 3C–E), indicating that ox-LDL inhibits autophagosome formation and substrate degradation. Meanwhile, on treatment with CTRP9, the impairment in autophagy induced by ox-LDL was obviously reversed through increased LC3 II and decreased p62 in a dose-dependent fashion, especially when the concentration remained at 3 μg/mL.
FIGURE 3.
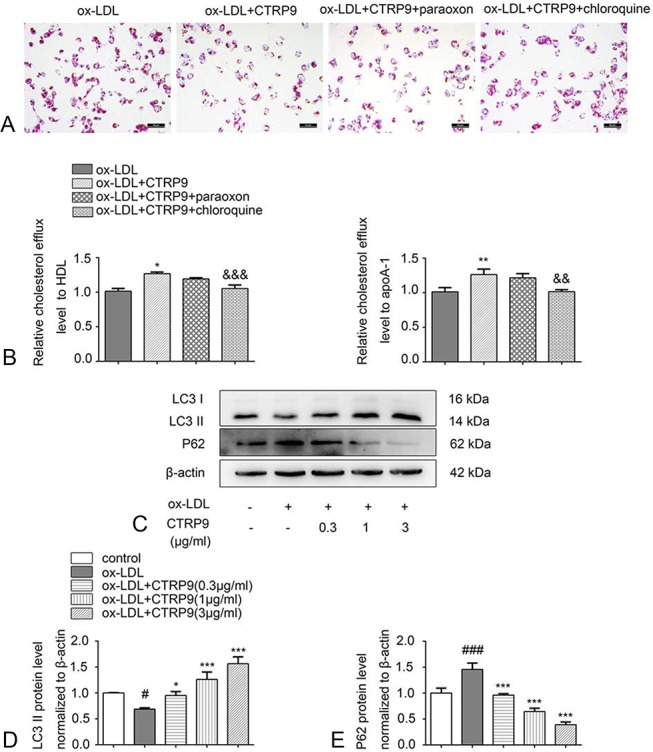
CTRP9 promotes cholesterol efflux through the acid lipolysis pathway and induces autophagy. A, Foam cells accepted the culture of 3 μg/mL of CTRP9 and paraoxon (10 μM) or chloroquine (20 μM), and Oil Red O staining and Harris hematoxylin staining were performed. B, After the cell treatments described above, the relative cholesterol efflux level was detected with HDL or apoA-1. C–E, Macrophages were cultured using CTRP9 with different concentrations with or without ox-LDL. Western blot was used to assess the protein expression levels of LC3 II and p62. Values are shown in the form of the mean ± SD of 3 experiments conducted independently. *P < 0.05, **P < 0.01 and ***P < 0.001 versus the ox-LDL group. &&P < 0.01 and &&&P < 0.001 versus the ox-LDL + CTRP9 group. #P < 0.05 and ###P < 0.001 versus the control group.
CTRP9 Inhibits Foam Cell Formation by Activating Autophagy
To further confirm a relationship between autophagy and the decreased number of foam cells caused by CTRP9, we used a known autophagy inhibitor, 3-MA, to block autophagy. Oil Red O staining revealed that CTRP9 caused a decrease in the quantity of lipid droplets, which could be attenuated by pretreating the foam cells with 3-MA (Fig. 4A). Consistent with this finding, the 3-MA–pretreated group had lower cholesterol efflux levels than the CTRP9-only group (Fig. 4B). We next investigated the autophagy-associated and reverse cholesterol transporter protein levels. Figures 5A–E shows that the ABCA1 and ABCG1 protein levels were downregulated when the cells were under the pretreatment of the 3-MA compared with the CTRP9-only group. Moreover, pretreatment with 3-MA suppressed the CTRP9-induced upregulation of LC3 II and the downregulation of p62 protein expression in foam cells. In addition, we visually assessed whether CTRP9 could regulate autophagy flux in foam cells using vinblastine, which hampered the fusion process of autophagosomes and lysosomes to block autophagy flux. We used dual-tagged mRFP-GFP-LC3 to overexpress LC3 in the cells and observed the fluorescence signal by immunofluorescence microscopy. During this process, yellow puncta indicated pH-neutral autophagosomes, and after fusing with lysosomes, the pH-sensitive GFP puncta vanished such that only red mRFP puncta were observed. As shown in Figure 5F, the CTRP9 group exhibited significantly more red and yellow dots than the ox-LDL group. However, notably fewer red puncta were detected when the cells were pretreated with vinblastine.
FIGURE 4.
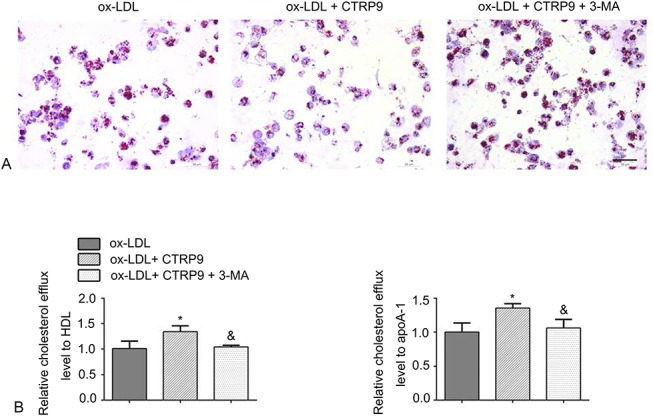
Autophagy blockage reverses the effect of CTRP9 on foam cells. A, Foam cells were incubated with or without 3-MA (10 mM) 30 minutes before the addition of CTRP9. Staining processes using Oil Red O and Harris hematoxylin were performed, respectively, to examine foam cell formation. B, After the cell treatments described above, the relative cholesterol efflux level was detected with apoA-1 or HDL. *P < 0.05 versus the ox-LDL group. &P < 0.05 versus the ox-LDL + CTRP9 group.
FIGURE 5.
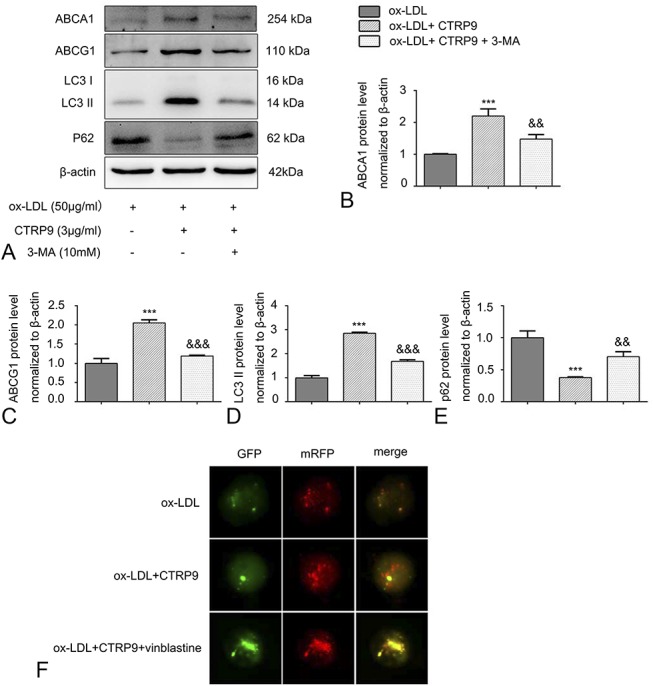
Autophagy inhibitors reverse the protein expression and autophagy flux changes induced by CTRP9 in foam cells. Cells were treated as mentioned above. A–E, Cholesterol reverse transporter (ABCA1 and ABCG1) and autophagy-associated protein levels (LC3 II and p62) were assessed in virtue of the Western blot. Values are presented in the form of the mean ± SD of 3 experiments conducted separately. F, GFP-RFP-LC3 was transiently transfected into cells as described before. Foam cells were incubated with or without vinblastine (20 μM) before the addition of CTRP9. Immunofluorescence images of yellow and red fluorescent puncta were acquired using a fluorescence microscope (magnification ×400). Values are presented as the mean ± SD of 3 separate experiments. ***P < 0.001 versus the ox-LDL group. &&P < 0.01 and &&&P < 0.001 versus the ox-LDL + CTRP9 group.
CTRP9 Induces Autophagy by Regulating the AMPK/mTOR Pathway in THP-1 Macrophage-Derived Foam Cells
It is found that AMPK/mTOR signaling pathway is associated with regulating autophagy.18 However, it remained unknown about whether CTRP9 can activate autophagy by AMPK/mTOR signaling pathway in foam cells. Therefore, the AMPK signaling pathway inhibitor, Compound C, was used to elucidate the underlying mechanism of CTRP9. Compared with the ox-LDL group, CTRP9 treatment remarkably increased the AMPK phosphorylation at Thr172, whereas it restrained phosphorylation of its downstream target mTOR, as shown in Figure 6. Meanwhile, pretreatment with Compound C inhibited this effect of CTRP9. In addition, we further investigated the significant effect of the AMPK/mTOR pathway on autophagy. LC3 II translation was suppressed, and p62 translation was increased dramatically when foam cells were pretreated with Compound C to inhibit AMPK phosphorylation.
FIGURE 6.
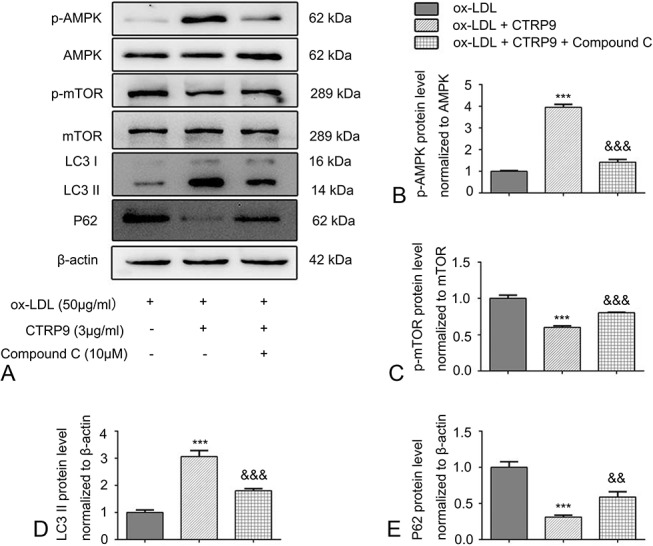
CTRP9 causes autophagy by activating the signaling pathway of AMPK/mTOR in foam cell. A–E, Foam cells were incubated with or without Compound C (10 μM) before the addition of CTRP9. According to the Western blot, the relative protein levels of p-AMPK, p-mTOR, LC3 II, and p62 were analyzed, respectively. Obtained values represent the mean ± SD from triplicate experiments. ***P < 0.001 versus the ox-LDL group. &&P < 0.01 and &&&P < 0.001 versus the ox-LDL + CTRP9 group.
DISCUSSION
According to the study results, CTRP9 reduces CE in foam cells derived from THP-1 macrophages by enhancing cholesterol efflux. In addition, we observed that CTRP9 inhibits foam cell formation in virtue of inducing autophagy by regulating the signaling pathway of AMPK/mTOR.
Autophagy is a vital and conserved catabolic mechanism that controls cellular protein and organelle degradation through lysosomes in response to different stressors.28 Chaperone-mediated autophagy, microautophagy, and macroautophagy are 3 types of autophagy.29 Lipophagy is a selective form of macroautophagy that is involved in lipid metabolism. During this process, autophagosomes, which are double-membrane vacuoles, engulf lipid droplets and transfer them to the lysosomal lumen for degradation with the help of lysosomal acid lipases.17 Several studies have indicated that autophagy contributes to cell cholesterol efflux and CE hydrolysis, processes that break down lipid droplets in foam cells.19,30 CTRP9, an adipokine, has a regulatory function in lipid metabolism. In a recent study, Jung et al31 demonstrated that CTRP9 could effectively alleviate the symptoms of fatty liver disease and further illustrated that promotion of autophagy was the underlying mechanism. In our study, how CTRP9 impacts the modulation of lipid metabolism in foam cells was studied for the first time. We observed that CTRP9 accelerated cholesterol efflux in foam cells in virtue of enhancing the acid lipolysis–mediated cholesterol efflux. In addition, we assessed the expression levels of autophagy markers to confirm that CTRP9 activated autophagy. LC3 II protein levels are positively associated with autophagy, whereas p62 levels are negatively associated with autophagy.30 Our results showed that 50 μg/mL of ox-LDL observably inhibited autophagy in THP-1 macrophages by decreasing LC3 II and elevating p62 protein levels; however, CTRP9 reversed this effect. Furthermore, transfection with mRFP-GFP-LC3 adenovirus also verified that CTRP9 significantly promoted autophagy flux in foam cells. Taken together, our findings demonstrated that CTRP9 enhanced autophagy in THP-1 macrophages under the treatment of ox-LDL.
ABCA1 and ABCG1 are primary reverse cholesterol transporters and have a positive role in facilitating cholesterol efflux so as to preserve the balance of cholesterol in cells.32 Deletion of ABCA1 and ABCG1 in mice results in defective cholesterol efflux and accelerates atherosclerosis.33 ABCA1 primarily facilitates cholesterol efflux to apoA-1, whereas ABCG1 primarily to HDL.34 Autophagy-mediated export of cholesterol to the extracellular receptors is an ABCA1-dependent process.30,35 Interestingly, our study showed that CTRP9 facilitated the increase in cholesterol efflux mediated by ABCA1 and ABCG1 and increased transporter proteins' expression. This result was in accordance with recent data reported by He et al,19 who showed that autophagy also regulated the ABCG1-mediated cholesterol metabolic pathway. By contrast, the results of Li et al18 showed that autophagy promoted ABCA1 protein expression but not ABCG1 protein expression. We assume that the results may have differed depending on the type and mechanism of the reagents used to induce autophagy, which is worth further study.
AMPK is a vital intracellular energy sensor and an emerging drug target for cardiometabolic diseases.36 AMPK has been shown to be a positive regulator of autophagy, and AMPK phosphorylation inhibits its downstream target, mTOR.37,38 Previous studies have shown that CTRP9 has a critical biological function by activating AMPK signaling pathway,22,39,40 and our laboratory also verified that treatment with CTRP9-enhanced AMPK activation in VSMCs.27 Similar to the above results, present study results indicated that CTRP9 activated AMPK by enhancing the phosphorylation level of AMPK in foam cells and inhibited several downstream proteins, including p-mTOR and LC3 II, while increasing p62 protein levels. However, the above effects of CTRP9 were abolished after being pretreated with Compound C. Hence, our results reveal a promoting effect of CTRP9 on autophagy by activating the AMPK/mTOR signaling pathway in THP-1 macrophages under the treatment of ox-LDL.
CONCLUSIONS
According to present data, CTRP9 enhances cholesterol efflux by regulating the AMPK/mTOR autophagy signaling pathway, thereby blocking the formation of foam cells from THP-1 macrophages, which likely slows the pathological progression of early atherosclerosis. In summary, our results reveal that autophagy may be tractable as a therapeutic target, and CTRP9 may be a promising drug to treat atherosclerosis.
Footnotes
Supported by the National Natural Sciences Foundation of China (NSFC) (Grant No. 81671794 to J.-B.H.).
The authors report no conflicts of interest.
REFERENCES
- 1.Herrington W, Lacey B, Sherliker P, et al. Epidemiology of atherosclerosis and the potential to reduce the global burden of atherothrombotic disease. Circ Res. 2016;118:535–546. [DOI] [PubMed] [Google Scholar]
- 2.Ross R. Atherosclerosis—an inflammatory disease. N Engl J Med. 1999;340:115–126. [DOI] [PubMed] [Google Scholar]
- 3.Hansson GK, Hermansson A. The immune system in atherosclerosis. Nat Immunol. 2011;12:204–212. [DOI] [PubMed] [Google Scholar]
- 4.Lin YW, Liu PS, Adhikari N, et al. RIP140 contributes to foam cell formation and atherosclerosis by regulating cholesterol homeostasis in macrophages. J Mol Cell Cardiol. 2015;79:287–294. [DOI] [PMC free article] [PubMed] [Google Scholar]
- 5.Afonso MdS, Castilho G, Lavrador MSF, et al. The impact of dietary fatty acids on macrophage cholesterol homeostasis. J Nutr Biochem. 2014;25:95–103. [DOI] [PubMed] [Google Scholar]
- 6.Hellerstein M, Turner S. Reverse cholesterol transport fluxes. Curr Opin Lipidol. 2014;25:40–47. [DOI] [PubMed] [Google Scholar]
- 7.Moore KJ, Tabas I. Macrophages in the pathogenesis of atherosclerosis. Cell. 2011;145:341–355. [DOI] [PMC free article] [PubMed] [Google Scholar]
- 8.Doonan RJ, Hafiane A, Lai C, et al. Cholesterol efflux capacity, carotid atherosclerosis, and cerebrovascular symptomatology. Arterioscler Thromb Vasc Biol. 2014;34:921–926. [DOI] [PubMed] [Google Scholar]
- 9.Duarte JH. Atherosclerosis: cholesterol efflux capacity-a new biomarker for cardiovascular risk? Nat Rev Cardiol. 2015;12:2. [DOI] [PubMed] [Google Scholar]
- 10.Delgado-Maroto V, Benitez R, Forte-Lago I, et al. Cortistatin reduces atherosclerosis in hyperlipidemic ApoE-deficient mice and the formation of foam cells. Sci Rep. 2017;7:46444. [DOI] [PMC free article] [PubMed] [Google Scholar]
- 11.Qi H, Su FY, Wan S, et al. The antiaging activity and cerebral protection of rapamycin at micro-doses. CNS Neurosci Ther. 2014;20:991–998. [DOI] [PMC free article] [PubMed] [Google Scholar]
- 12.Mizumura K, Choi AM, Ryter SW. Emerging role of selective autophagy in human diseases. Front Pharmacol. 2014;5:244. [DOI] [PMC free article] [PubMed] [Google Scholar]
- 13.He PX, Che YS, He QJ, et al. G226, a novel epipolythiodioxopiperazine derivative, induces autophagy and caspase-dependent apoptosis in human breast cancer cells in vitro. Acta Pharmacol Sin. 2014;35:1055–1064. [DOI] [PMC free article] [PubMed] [Google Scholar]
- 14.Razani B, Feng C, Coleman T, et al. Autophagy links inflammasomes to atherosclerotic progression. Cell Metab. 2012;15:534–544. [DOI] [PMC free article] [PubMed] [Google Scholar]
- 15.Vindis C. Autophagy: an emerging therapeutic target in vascular diseases. Br J Pharmacol. 2015;172:2167–2178. [DOI] [PMC free article] [PubMed] [Google Scholar]
- 16.He C, Zhu H, Zhang W, et al. 7-Ketocholesterol induces autophagy in vascular smooth muscle cells through Nox4 and Atg4B. Am J Pathol. 2013;183:626–637. [DOI] [PMC free article] [PubMed] [Google Scholar]
- 17.Singh R, Kaushik S, Wang Y, et al. Autophagy regulates lipid metabolism. Nature. 2009;458:1131–1135. [DOI] [PMC free article] [PubMed] [Google Scholar]
- 18.Li X, Zhang X, Zheng L, et al. Hypericin-mediated sonodynamic therapy induces autophagy and decreases lipids in THP-1 macrophage by promoting ROS-dependent nuclear translocation of TFEB. Cell Death Dis. 2016;7:e2527. [DOI] [PMC free article] [PubMed] [Google Scholar]
- 19.He J, Zhang G, Pang Q, et al. SIRT6 reduces macrophage foam cell formation by inducing autophagy and cholesterol efflux under ox-LDL condition. FEBS J. 2017;284:1324–1337. [DOI] [PubMed] [Google Scholar]
- 20.Peterson JM, Wei Z, Seldin MM, et al. CTRP9 transgenic mice are protected from diet-induced obesity and metabolic dysfunction. Am J Physiol Regul Integr Comp Physiol. 2013;305:R522–R533. [DOI] [PMC free article] [PubMed] [Google Scholar]
- 21.Wong GW, Krawczyk SA, Kitidis-Mitrokostas C, et al. Identification and characterization of CTRP9, a novel secreted glycoprotein, from adipose tissue that reduces serum glucose in mice and forms heterotrimers with adiponectin. FASEB J. 2009;23:241–258. [DOI] [PMC free article] [PubMed] [Google Scholar]
- 22.Wei Z, Lei X, Petersen PS, et al. Targeted deletion of C1q/TNF-related protein 9 increases food intake, decreases insulin sensitivity, and promotes hepatic steatosis in mice. Am J Physiol Endocrinol Metab. 2014;306:E779–E790. [DOI] [PMC free article] [PubMed] [Google Scholar]
- 23.Zhang P, Huang C, Li J, et al. Globular CTRP9 inhibits oxLDL-induced inflammatory response in RAW 264.7 macrophages via AMPK activation. Mol Cell Biochem. 2016;417:67–74. [DOI] [PubMed] [Google Scholar]
- 24.Uemura Y, Shibata R, Ohashi K, et al. Adipose-derived factor CTRP9 attenuates vascular smooth muscle cell proliferation and neointimal formation. FASEB J. 2013;27:25–33. [DOI] [PubMed] [Google Scholar]
- 25.Zheng Q, Yuan Y, Yi W, et al. C1q/TNF-related proteins, a family of novel adipokines, induce vascular relaxation through the adiponectin receptor-1/AMPK/eNOS/nitric oxide signaling pathway. Arterioscler Thromb Vasc Biol. 2011;31:2616–2623. [DOI] [PMC free article] [PubMed] [Google Scholar]
- 26.Li J, Zhang P, Li T, et al. CTRP9 enhances carotid plaque stability by reducing pro-inflammatory cytokines in macrophages. Biochem Biophys Res Commun. 2015;458:890–895. [DOI] [PubMed] [Google Scholar]
- 27.Liu Q, Zhang H, Lin J, et al. C1q/TNF-related protein 9 inhibits the cholesterol-induced vascular smooth muscle cell phenotype switch and cell dysfunction by activating AMP-dependent kinase. J Cell Mol Med. 2017;21:2823–2836. [DOI] [PMC free article] [PubMed] [Google Scholar]
- 28.Yoshimori T. Autophagy: a regulated bulk degradation process inside cells. Biochem Biophys Res Commun. 2004;313:453–458. [DOI] [PubMed] [Google Scholar]
- 29.Singh R, Cuervo Ana M. Autophagy in the cellular energetic balance. Cell Metab. 2011;13:495–504. [DOI] [PMC free article] [PubMed] [Google Scholar]
- 30.Gu HF, Li HZ, Tang YL, et al. Nicotinate-curcumin impedes foam cell formation from THP-1 cells through restoring autophagy flux. PLoS One. 2016;11:e0154820. [DOI] [PMC free article] [PubMed] [Google Scholar]
- 31.Jung TW, Hong HC, Hwang HJ, et al. C1q/TNF-Related Protein 9 (CTRP9) attenuates hepatic steatosis via the autophagy-mediated inhibition of endoplasmic reticulum stress. Mol Cell Endocrinol. 2015;417:131–140. [DOI] [PubMed] [Google Scholar]
- 32.Westerterp M, Bochem AE, Yvan-Charvet L, et al. ATP-binding cassette transporters, atherosclerosis, and inflammation. Circ Res. 2014;114:157–170. [DOI] [PubMed] [Google Scholar]
- 33.Yvan-Charvet L, Pagler T, Gautier EL, et al. ATP-binding cassette transporters and HDL suppress hematopoietic stem cell proliferation. Science. 2010;328:1689–1693. [DOI] [PMC free article] [PubMed] [Google Scholar]
- 34.Yu XH, Fu YC, Zhang DW, et al. Foam cells in atherosclerosis. Clinica Chim Acta. 2013;424:245–252. [DOI] [PubMed] [Google Scholar]
- 35.Ouimet M, Franklin V, Mak E, et al. Autophagy regulates cholesterol efflux from macrophage foam cells via lysosomal acid lipase. Cell Metab. 2011;13:655–667. [DOI] [PMC free article] [PubMed] [Google Scholar]
- 36.Xu A, Wang Q, Zhang M, et al. Activation of AMP-activated protein kinase is required for berberine-induced reduction of atherosclerosis in mice: the role of uncoupling protein 2. PLoS One. 2011;6:e25436. [DOI] [PMC free article] [PubMed] [Google Scholar]
- 37.Inoki K, Kim J, Guan KL. AMPK and mTOR in cellular energy homeostasis and drug targets. Annu Rev Pharmacol Toxicol. 2012;52:381–400. [DOI] [PubMed] [Google Scholar]
- 38.Shao BZ, Han BZ, Zeng YX, et al. The roles of macrophage autophagy in atherosclerosis. Acta Pharmacol Sin. 2016;37:150–156. [DOI] [PMC free article] [PubMed] [Google Scholar]
- 39.Kambara T, Shibata R, Ohashi K, et al. C1q/tumor necrosis factor-related protein 9 protects against acute myocardial injury through an adiponectin receptor I-AMPK-dependent mechanism. Mol Cell Biol. 2015;35:2173–2185. [DOI] [PMC free article] [PubMed] [Google Scholar]
- 40.Jung CH, Lee MJ, Kang YM, et al. C1q/TNF-related protein-9 inhibits cytokine-induced vascular inflammation and leukocyte adhesiveness via AMP-activated protein kinase activation in endothelial cells. Mol Cell Endocrinol. 2016;419:235–243. [DOI] [PubMed] [Google Scholar]


