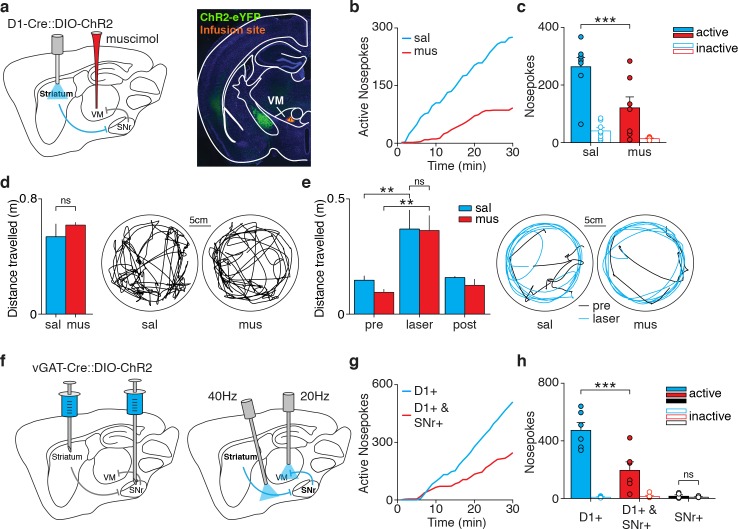
Figure 5. VM thalamus inhibition disrupts dMSN self-stimulation.
(a) Schematic of a sagittal brain section showing optogenetic excitation of striatal dMSNs combined with muscimol infusion in VM, and coronal slice from a D1-Cre mouse showing ChR2-eYFP-expressing fibers from dMSNs en route to SNr (green) and infusion site in VM (DiI, orange). (b) Example cumulative plot of active nosepokes from D1-ChR2 mice infused with saline (sal, blue) or muscimol (mus, red). (c) Average nosepokes during a single self-stimulation session for D1-ChR2 mice infused with saline (sal) or muscimol (mus, n = 8 and 7, two-way ANOVA, interaction poke x group, F(1,13)=6.33, p=0.026, posthoc Sidak’s multiple comparisons test, sal active vs mus active p=0.0009, sal active vs inactive p<0.001, musactive vs inactive p=0.018). (d) Average spontaneous locomotion in D1-ChR2 mice infused in VM with muscimol or saline (left), and example tracks (right) (n = 3, Wilcoxon matched-pairs signed rank test, p=0.5). (e) Average distance travelled before (pre), during (laser) and after (post) dMSN stimulation in the same mice as in g (left), and example tracks (right) (two-way ANOVA, interaction laser x drug F(2,4)=0.873, p=0.485, main effect of laser F(2,4)=14.16, p=0.015, posthoc Tukey’s multiple comparisons test, sal pre vs laser p=0.002, mus pre vs laser p=0.001, sal laser vs mus laser p=0.994). (f) Schematic of a sagittal brain section showing injection of Cre-dependent ChR2 in the striatum and SNr of a vGAT-Cre mouse (left) and fiber placement above dMSN axons and in VM for optogenetic excitation of dMSN combined with excitation of SNr terminals in VM, respectively (right). (g) Example cumulative plot of active nosepokes for dMSN axon stimulation paired with SNr-eYFP (D1+, blue) or SNr-ChR2 terminal stimulation in VM (D1+ and SNr+, red). (h) Average nosepokes during a single self-stimulation session from the same mice as in e (n = 6 and 6, two-way ANOVA, interaction poke x group, F(1,10)=12.95, p=0.0049, posthoc Sidak’s multiple comparisons test, D1 +active vs D1+ and SNr +active p<0.001, D1 +active vs inactive p<0.001, D1+ and SNr +active vs inactive p=0.018; SNr+, Wilcoxon signed rank test, active vs inactive p=0.625).

