Abstract
Accurate subject-specific vascular network reconstruction is a critical task for the hemodynamic analysis of cerebroarterial circulation. Vascular skeletonization and computational mesh generation for large sections of cerebrovascular trees from magnetic resonance angiography (MRA) is an error-prone, operator-dependent, and very time-consuming task. Validation of reconstructed computational models is essential to ascertain their accuracy and precision, which directly relates to the confidence of CFD computations performed on these meshes. The aim of this study is to generate an imaging segmentation pipeline to validate and quantify the spatial accuracy of computational models of subject-specific cerebral arterial trees. We used a recently introduced parametric structured mesh (PSM) generation method to automatically reconstruct six subject-specific cerebral arterial trees containing 1364 vessels and 571 bifurcations. By automatically extracting sampling frames for all vascular segments and bifurcations, we quantify the spatial accuracy of PSM against the original MRA images. Our comprehensive study correlates lumen area, pixel-based statistical analysis, area overlap and centerline accuracy measurements. In addition, we propose a new metric, the pointwise offset surface distance metric (PSD), to quantify the spatial alignment between dimensions of reconstructed arteries and bifurcations with in-vivo data with the ability to quantify the over- and under-approximation of the reconstructed models. Accurate reconstruction of vascular trees can a practical process tool for morphological analysis of large patient data banks, such as medical record files in hospitals, or subject-specific hemodynamic simulations of the cerebral arterial circulation.
Keywords: Hausdorff distance, shape similarity index, mesh validation, pointwise surface distance, cerebral arterial tree, parametric structured mesh, morphological analysis
1. Introduction:
Thanks to advances in medical imaging technologies in the past decade, the use of subject-specific models is becoming more practical for diagnosis and treatment planning. Moreover, researchers and physicians have begun to perform cerebral hemodynamic simulations to acquire more insights into the cause of cerebrovascular diseases (CVDs). Especially, wall shear stress (WSS) components were implicated as critical hemodynamic factors for predicting endovascular lesions such as cerebral aneurysm1–3, plaque formation4,5, and atherosclerosis6. Even small changes in vascular network configuration or geometry can substantially alter WSS in arteries7. Therefore, surgical interventions inducing geometrical changes may inadvertently induce undesired wall shear stress, which can lead tofurther lesions both local and distal to the site of intervention8–11. Hence, accurate reconstruction of large-scale cerebral arterial trees topology can be of significance to anticipate the endovascular lesion-prone sites.
Many image reconstruction and mesh generation tools (VMTK12,13, Mimics14, ITK-SNAP15.) are available for surface reconstruction of blood vessels, which needs to be performed by a skilled technician. Antiga et al. also presented a conceptual network analysis methodology for reconstructing dense microvascular networks16. Often these processes require hands-on repair of surface discontinuities, holes and overlapping surfaces17 which are highly operator-dependent, tedious, time-consuming, and difficult to reproduce; making manual operations impractical for large-scale cerebral arterial tree reconstruction. Thus, there is a need to generate fully-automatic high-quality vascular tree meshes from angiographic images.
We have recently presented an anatomic image processing and computational fluid dynamics (CFD) analysis pipeline based on parametric structured meshing (PSM)18–20. In this paper, we perform comprehensive statistical analysis of the spatial fidelity of the subject-specific PSM reconstruction. Specifically, we will use crisp statistical image metrics to assess the accuracy of the centerline, diameters, and connectivity of the reconstructed vascular networks. For this purpose, we will compare raw MRA data as a reference with the automatically reconstructed computational meshes using the Walk-In Brain virtual reality software21. Due to the size of the datasets, we have automated the image validation protocol to effectively generate similarity measures between the MRA voxel data and the 3D reconstructed vectorized data.
Validation segmentation and surface reconstruction are a critical step in medical image analysis. It requires two elements: (i) ground truth or gold standard against which the reconstructed surfaces can be compared and (ii) a suitable metrics for quantifying spatial agreement. In previous studies, vessel phantoms22,23, manually segmented reference24,25, or postmortem vessel network26 serves as ground truth. Here, we chose in vivo angiographic data as a reference.
To quantify the area alignment between two graphical objects, pixel-based statistical similarity measures, such as Dice or Jaccard index or modified version25, 27–30 have been used. Oeltze et al used the similarity index to validate a vascular tree rendering with isosurface visualization of liver vessel tree31. Auricchio et al32 implemented a surface distance for validating mesh reconstructions of coronary bifurcations which their method is limited to planar bifurcations.
The Hausdorff distance (HD) is a suitable measure of boundary similarity between two objects. The Hausdorff distance has been commonly used for video sequences matching33, trajectory comparison34, and facial recognition35 and for evaluating the performance of medical segmentation and image registration36–39. HD suffers from the so-called panhandle problem which occurs when one objects exhibiting a sudden local shape deviation causes an unrealistically large HD value. HD also cannot distinguish between under or over-estimation in the spatial overlap between two objects, which is critical in diameter estimation. To address these shortcomings, we will introduce the pointwise surface distance (PSD) index based on a modified Hausdorff distance metric. The paper is organized as follow. First, in-vivo data from MRA image acquisition, segmentation, and registration of six human subjects are presented. The automatic capture of sampling frames from important topological regions of the vascular trees is introduced. We quantify the accuracy of centerline approximation using the original MR angiography images as reference. We also perform pixel-based statistical analysis and calculate the similarity indices between PSM and MRA images. Moreover, we deploy a pointwise surface distance (PSD) index to quantify the fidelity of diameter reconstruction. Finally, two applications demonstrated the use of reconstructed PSM meshes for morphological and CFD hemodynamic analysis.
2. Methods
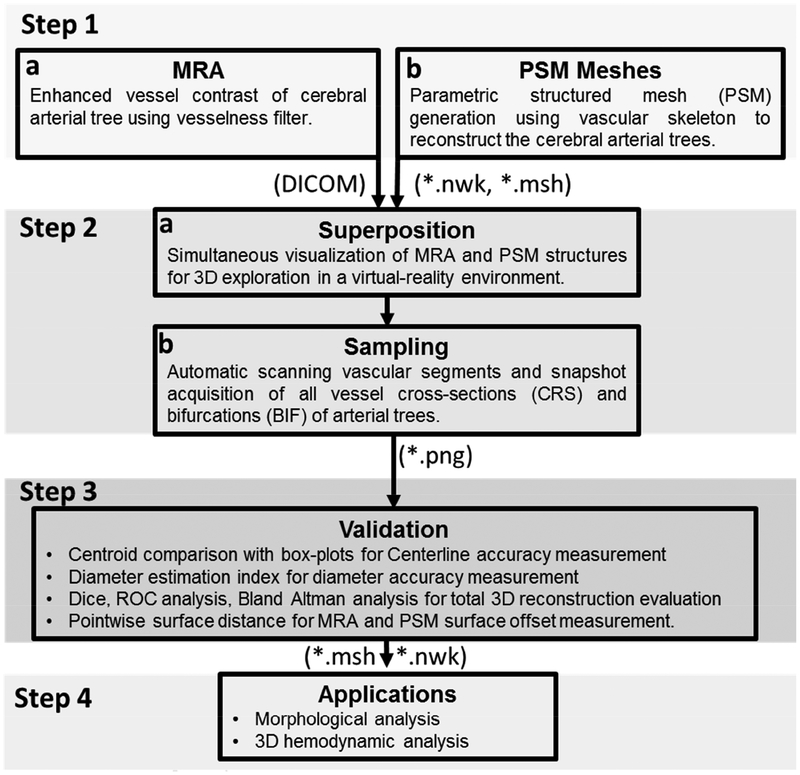
A stepwise procedure for vascular mesh reconstruction validation techniques for cerebral arterial trees is summarized in Figure 1. The details for each step are introduced next.
Figure 1.
Information flow for the spatial validation of the parametric structured meshes (PSM) against original MRA images as a reference. (Step 1) Cerebrovascular trees are reconstructed from MRA using PSM method. (Step 2) MRA and PSM reconstruction are superimposed in a virtual reality environment Walk-in Brain. Vascular segments and bifurcations are scanned and 2D sampling frames are automatically acquired. (Step 3) Spatial accuracy evaluation between PSM with original MRA images by correlating lumen area, pixel-based statistical analysis, area overlap measurements and centerline accuracy measurements. (Step 4) Applications of PSM meshes; examples include cerebrovascular morphometric analysis of image databases of patients and subject-specific hemodynamic simulation of the entire arterial circulation.
2.1. Image acquisition and segmentation (Step 1a)
Six healthy human subjects with no known cerebrovascular diseases were recruited and underwent MR imaging on a General Electric 3T Discovery MR750 scanner using a 32-channel phased-array coil (Nova Medical, Inc., Wilmington, MA, USA) under Institute Review Board approval at the University of Illinois at Chicago. MRA images were acquired using a three-dimensional (3D) time of flight (TOF) pulse sequence to capture major cerebral arterial tree branches. No motion artifacts affecting the scan were observed in any of the six cases. The key data acquisition parameters were: repetition time (TR)=26 ms, echo time (TE)=3.4 ms, flip angle=18°, matrix size=512×512×408, voxel size=0.39×0.39×0.3 mm3, acceleration factor=2, number of slab=4, magnetization transfer=on, and scan time= 30 min.
To reconstruct even small branches of the cerebral arterial tree, we enhanced the vessel contrast with our in-house multi-scale vesselness filter40,41. Filtered images were processed to create logically connected networks and morphological descriptors of the cerebral arterial tree. A fast marching algorithm with the cutoff intensity of 0.01 was used to generate a binary mask of the connected arterial tree41,42.
On the MR imaging scanner where the MRA was performed, a rigorous quality assurance process was in place, which routinely checks the magnetic field homogeneity within a spherical volume that is relevant to the brain. The typical field inhomogeneity is about 5 times smaller than the manufacturer’s specification, which ensures that the image distortion is well within a voxel dimension. In addition, a minimal TE of 3.4 ms was employed in the MRA sequence, which further reduces geometric distortion arising from B0 magnetic field inhomogeneity and bulk magnetic susceptibility differences. Therefore, additional post-acquisition distortion correction was not necessary and thus not applied to our data.
2.2. Skeletonization and mesh generation (Step 1b)
We extract morphological descriptors for the vascular network using the Vascular Modelling Toolkit (VMTK)12,13. It first deploys the marching cubes algorithm to retrieve the surface envelope of the vessel walls43. Then, the centerline trajectory as well as corresponding vessel diameter are acquired by the maximal inscribed sphere method12,13,44. VMTK outputs point coordinates and connectivity of the centreline as well as corresponding vessel radius for the entire vascular network. We then encoded these data using special matrices. The point coordinate matrix contains the location of the nodes on the vessel centerline as well as associated diameter information. Logical connections between two points were encoded via a connectivity matrix. Centerline points with connectivity of more than two edges were labeled as a bifurcation. Terminals are characterized by a single connected edge. Using point coordinate and connectivity matrices, the network was partitioned into segments and stored in a persistent network file (*.nwk file). The spatial extent of vascular segments was encoded with cubic Bezier splines. To eliminate the nonphysiological noisy variation of the diameter information, raw diameter data were smoothed with a conventional moving average filter. Noisy diameter information occurred predominatly in vessels with high tortuosity, such as the internal carotid artery. Similar filtering methods have been implemented to smooth the local diameter along the longitudinal direction of the vessels to eliminate artificial narrowing/dilating in healthy vessels31,45.
We used a full-hexahedral parametric structured mesh (PSM) generation method described previously17,20,40. In brief, hexahedral meshes were parametrized along the vessels (Bezier splines) in radial, cross-sectional and longitudinal directions to build an anisotropic mesh. For each branch, the number of longitudinal subdivisions was chosen based on the local curvature and vessel diameter. PSM meshes enjoy geometric continuity over the entire surface.
2.3. Virtual exploration of superimposed MRA and PSM (Step 2a)
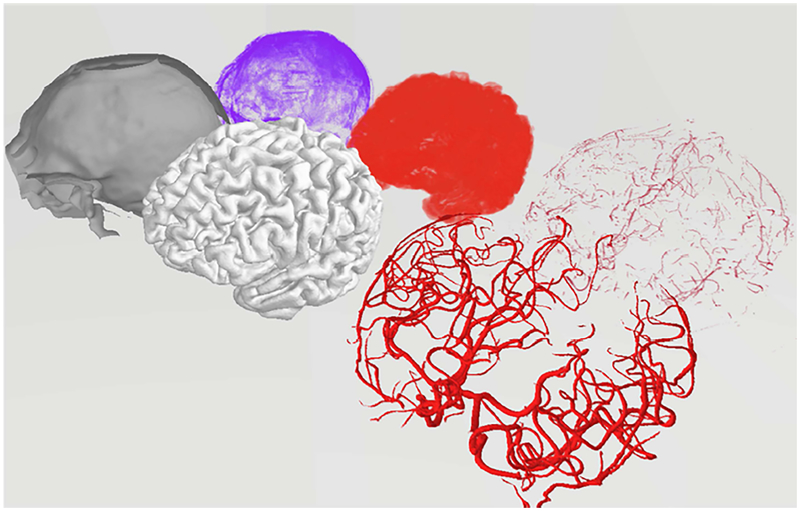
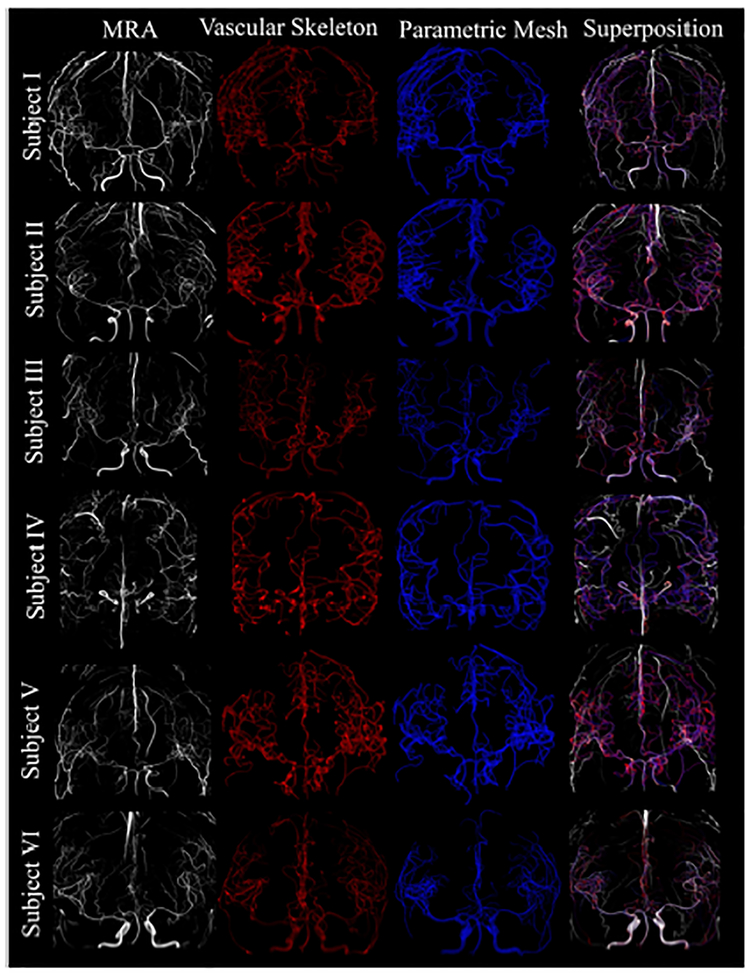
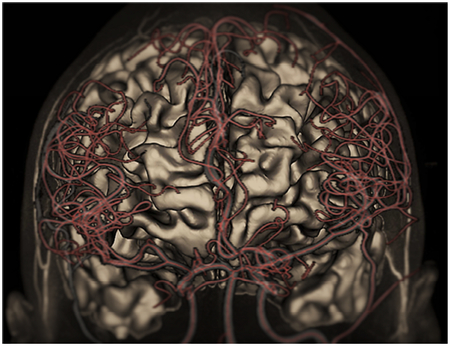
Both the MRA image and the reconstructed vascular tree were registered in the Walk-in Brain virtual-reality software21. Figure 2 depicts a 3D rendering of the separated different anatomical compartment in the virtual immersive environment of Walk-in Brain. This software supports superimposition of the MRA and PRM in corresponding physical coordinate space, provides choices for surface transparency and volume rendering to enable simultaneous 3D exploration of raw DICOM images and 3D meshes. Semi-transparent visualization of the MRA images and the reconstructed 3D PSM meshes for all six subjects are depicted in Figure 3. In addition, it has tools to recolor substructures using various RGB color palettes. Immersive viewing in full 3D volume rendering mode is critical for visual inspection of the raw MRI data, and surpasses conventional views that offer only slice-by-slice viewing or maximum intensity projections. Moreover, the 3D spatial operations in Walk-in Brain were essential for sample frame acquition needed for automating image analysis by sample frame acquisition.
Figure 2.
Virtual reality rendering of the raw data as well as the reconstructed meshes in Walk-in Brain. Back row shows 3D rendering of the raw data (voxel matrices) for CSF spaces (purple), cortical surface (red), and the arterial tree (light red). The labelled voxel point clouds were shown as an explosion diagram for better visibility. Front row depicts the reconstructed volumetric meshes: CSF surface mesh (gray), cortical surface (light gray), arterial tress (red). The comparison of raw data (discrete point clouds) and meshes (vectorized data) in virtual reality space coordinates forms the basis of the statistical analysis for validation of the reconstructed arterial trees.
Figure 3.
Global superposition of six cerebral arterial trees in virtual reality space. The first column shows the original gray-scale MRA images. The second column is the reconstructed vascular skeleton (red) of the arterial tree which includes diameter, centerline, and network connectivity information. Three-dimensional parametric structured meshes (blue) are shown in the third column. The last column is the global superposition with MRA (white), vascular skeleton (red) and parametric mesh (blue).
Automatic sample framing acquisition (Step 2b)
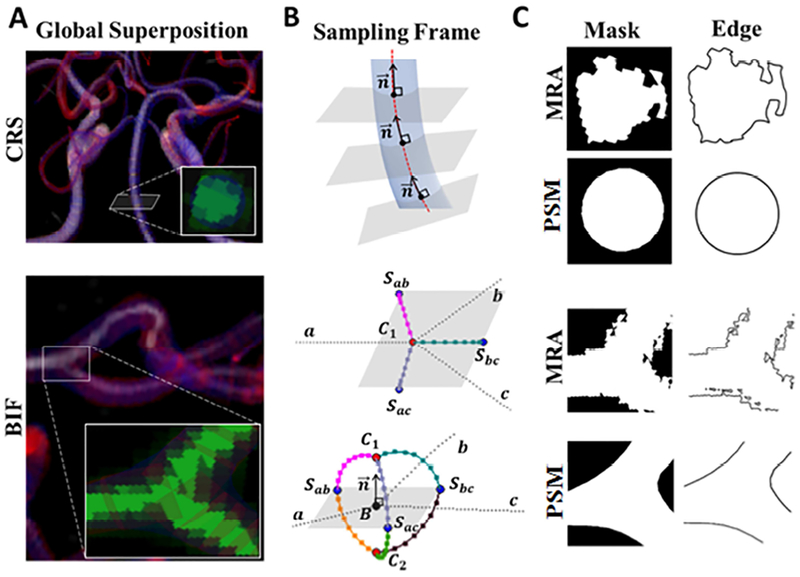
We implemented a procedure to automatically capture 2D image snapshots to assess vascular cross-sections (CRSs) and bifurcations (BIFs) that were captured in a body fitted coordinate system which was aligned with the anatomical centreline orientation. This physiological reference coordinates enables statistical image analysis that is more accurate than image reconstruction based on horizontal image stacks, whose orientation depends on the random position of the human subject inside the imaging scanner. Examples for a cross-section (CRS) and a bifurcation (BIF) are shown in Figure 4A. For CRS, multiple two-dimensional snapshots were generated along the centreline perpendicular to the velocity of the Bezier spline representation of a segment as shown in Figure 4B. Typically between 10 to 120 snapshots were taken depending on the length of the Bezier spline.
Figure 4.
Sampling frame analysis of the vascular cross-sections (CRSs) and bifurcations (BIFs) for cerebral vascular tree reconstruction. (A) Superposition. Two-dimensional snapshots containing information of MRA and the reconstructed mesh were captured. (B) Sampling frame acquisition. The software automatically positions the 2D snapshots (gray planes) so that their normals, , are collinear to the centerline velocity vector of a vascular segment. In BIF, the snapshot belongs to the separation plane spanned by separation points Sab, Sbc, Sac of the branches of a-b, b-c, and a-c, respectively. The detailed schematic of the separation region also depicts the control points of C1 and C2, as well as the bifurcation points, B. In total, 119,738 vascular CRSs and 571 BIFs snapshots were automatically created for validation of vascular tree reconstruction. (C) Binary masks and boundary edges of vascular CRSs and BIFs were processed for further statistical analysis.
For bifurcations, we first established the separation region. The separation region is defined by the bifurcation point B, three separation points, S, and two control points, C. The three branches of each bifurcation were indexed as a, b, and c (Figure 4B). Bifurcation sampling frames were generated as 2D snapshots of the separation planes spanned by the separation points. Separation points, Sab, Sbc, Sac, were calculated between the branches of a-b, b-c, and a-c, for establishing the separation planes, using Eqs. (1–2). To complete the separation region geometry, the normal vector of the separation plane, , was extended by a magnitude equal to the mean radius tofind control points, C1 and C2 using Eqs. (3–5), as shown in Figure 4B. Bifurcation sampling frames were then capture on above and below the separation planes.
| (1) |
| (2) |
| (3) |
| (4) |
| (5) |
Where ,, are the unit tangent vectors at the bifurcation point are equal to the derivative of the Bezier curve at t = 0 on a, b, c branches, respectively. ∥.∥ denotes the Euclidean norm. α is the angle between two unit vectors of and . Ra, Rb, and Rc are the radii corresponding to the branches of a, b, and c, respectively. C1; and C2 are control points located on the above and below of the separation plane.
By scanning the entire vascular networks on average 19,956 CRSs for the vascular segments, and 95 BIFs snapshots were created for each subject as listed in Table 1. We used MATLAB R2017a (MathWorks Inc.) for all image filtration and statistical analysis using a PC with a single-core 2.4 GHz Xenon CPU processor.
Table 1.
Statistics of the sampling frames for each reconstructed cerebral arterial tree and CPU time for pre- and post-processing. The pre-processing includes sampling frame acquisition and image filtration. Post-processing includes pixel-based, pointwise surface-based analysis.
| Subjects | #CRS | #BIF | #Vessels | Pre-processing Time (min) |
Post-processing Time (min) |
|---|---|---|---|---|---|
| I | 15685 | 68 | 133 | 50 | 13.4 |
| II | 22540 | 100 | 294 | 73 | 18.8 |
| III | 17425 | 89 | 175 | 58 | 13.3 |
| IV | 24465 | 122 | 309 | 81 | 19.4 |
| V | 20439 | 99 | 247 | 66 | 17.8 |
| VI | 19184 | 93 | 206 | 63 | 16.6 |
| Total | 119738 | 571 | 1364 | 391 | 99.3 |
Vessel geometry in MRA angiograms was distinguished from the reconstructed meshes and segmentation using RGB (red-green-blue) channel separation. Then, a binary mask (silhouette) of the filtered images was generated. A Canny edge-detection algorithm was applied on all sequentially acquired images to extract the border of the vascular cross-section and bifurcations for statistical analysis, as shown in Figure 4C.
2.4. Statistical metrics for PSM evaluation (Step 3)
We performed pixel-by-pixel analysis to compare the reconstructed PSM to the MRA images by calculating the true positive (TP), false positive (FP), true negative (TN), and false negative (FN) as summarized in the confusion matrix of Table 2. Here, TP is the total number of vessel pixels inside the vascular lumen in the MRA as well as in the reconstructed PSM, while TN counts the number of pixels that lie outside the vascular lumen in the MRA (=background pixel) as well as in the PSM. False positives FP sums background pixels in the MRA, which are erroneously allocated inside the PSM. Finally, FN is the total number of the pixels of the vascular lumen in the MRA, which were considered background in the PSM.
Table 2.
Confusion matrix for statistical analysis
| MRA (Ground Truth) | |||
|---|---|---|---|
| True | False | ||
| PSM | True | TP | FP |
| False | FN | TN | |
In addition, several statistical metrics including sensitivity (SE), specificity (SP), positive/negative predictive value, PPV, NPV, total accuracy, ACC, and Dice similarity coefficient, DSC, were computed using Eqs. (6–11) to quantify the PRM vascular reconstruction quality.
The sensitivity, SE, represents the ratio of the correctly meshed pixels in all the vessel pixels. Specificity, SP, is the ratio of correctly not meshed pixels in all the background pixels. PPV and NPV are the probability that a pixel in the PRM reconstruction is truly inside the vessel lumen in the raw image and a pixel outside the vessel lumen in PRM is a background pixel outside the vessel lumen, respectively. ACC is a global validation metric providing the ratio of correctly assigned pixels to the total pixels. Finally, DSC is a similarity metric to evaluate area spatial overlap.
| (6) |
| (7) |
| (8) |
| (9) |
| (10) |
| (11) |
We also evaluate sensitivity and specificity of mesh reconstructions using the receiver operating characteristic (ROC) curves. ROC curve shows the tradeoff between the sensitivity and specificity, since any increase in sensitivity may result in a decrease in the specificity across all different sample frames. The area under the ROC curve is another measure of test performance to show how well negative and positive pixels are distinguished and separated. All results of the pixel-based comparison are summarized in Figure 5.
Figure 5.
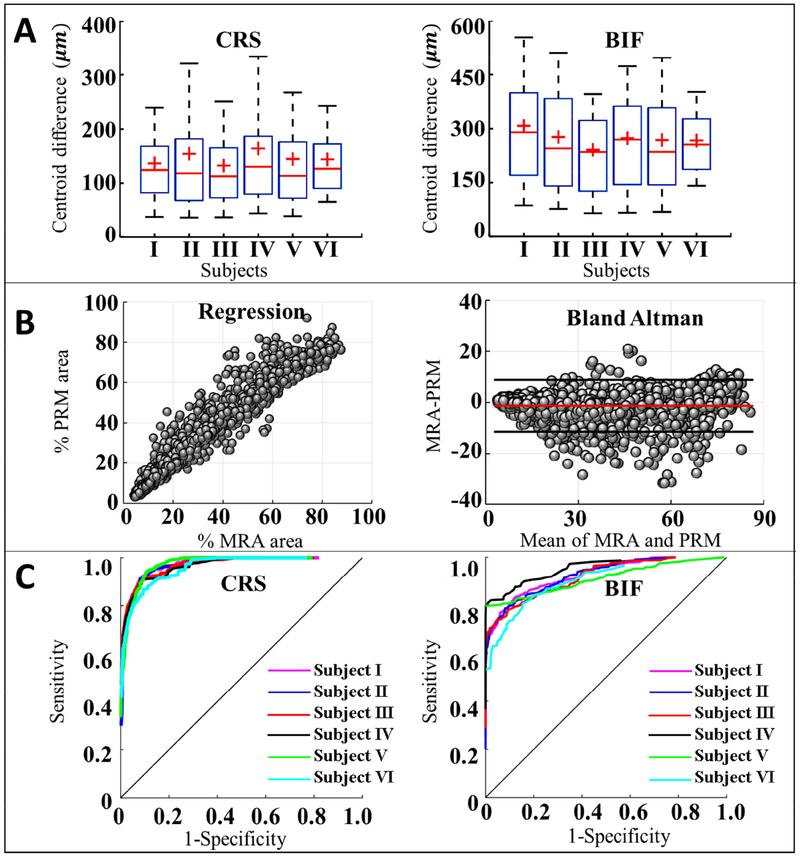
Pixel-based statistical analysis of the PSM reconstructed vascular models. (A) The accuracy of centerline reconstruction based on intensity-weighted centroids of PSM and reference images of MRA image for the six subjects. The vascular centerline accuracy reached sub-resolution precision (~400 μm) for vascular cross-sections (CRSs) and bifurcations (BIFs) (B) Linear regression (left) and Bland Altman plot (right) were used to assess the agreement between the MRA and PSM in vascular CRSs and BIFs sampling frames. The regression plot shows the correlation with R2 = 0.9489. The red line in Bland Altman plot is the mean of the difference and the two black lines are the upper and lower 95% limit of agreement. (C) Receiver Operating Characteristic curves (ROC) of CRSs and BIFs for six subjects. Using MRA images as the ground truth, the area under the curve (AUC) was 0.96 for CRSs, and 0.88 for BIFs.
These pixel-based statistical parameters are suitable for overall assessment. However, they do not supply a metric for the reconstruction error, such as under- or over-approximation of the enclosed vessel surfaces (vascular lumen).
2.5. Pointwise surface distance (Step 3)
We propose a new pointwise surface distance (PSD) index to assess the quality of boundary reconstruction. The binary mask of “A” is defined as non-zero intensity pixels of the MRA reference image, shown as the white convex region in Figure 4C. Equally, the binary mask of “B” stands for pixels that delineate the vascular lumen in the PSM reconstruction. The boundary (edge) is defined as the subset, S (A) = {a1,a2,…,an} that embodies pixels on the border of the binary mask A. Similarly, S(B) = {b1,b2,…,bm} delineates the set of m pixels on the boundary of B. The mathematical notations are summarized in Table 3.
Table 3.
The mathematical notation for pointwise surface distance calculation.
| Notation | Definition |
|---|---|
| A | All pixels that have non-zero intensity on the MRA image. |
| B | All pixels that have non-zero intensity on the PSM reconstruction. |
| S(A) | Set of all pixels on the boundary of the binary mask A. |
| S(B) | Set of all pixels on the boundary of the binary mask B. |
| ||a, S(B)|| | Set of Euclidian distances for a point from a a ∈ S(A), to all the points of S(B). |
| d(a, S(B)) | Minimum distance from a a ∈ S(A) to the closest point of S(B). |
| h(S(A), S(B)) | One-sided Hausdorff distance from S(A) to S(B). |
| H(S(A), S(B)) | Two-sided Hausdorff distance between S(A) and S(B). |
| g(S(A), S(B)) | One-sided pointwise surface distance from S(A) to S(B). |
| G(S(A), S(B)) | Two-sided pointwise surface distance (PSD) between S(A) and S(B) |
The one-sided Hausdorff distance, h (S (A), S (B)), is defined as the maximum of all distances from points a ∈ S (A) to their nearest points in b ∈ S(B), Eq. (12). Similarly, h (S (B), S (A)) is another one-sided Hausdorff distance from S(B) to S(A) as shown in Eq. (13). Finally, the two-sided Hausdorff distance,H (S (A), S (B)), is the maximum of the two one-sided Hausdorff distances, Eq. (14).
| (12) |
| (13) |
| (14) |
where ∥.∥ is the Euclidean distance operator. Note that the one-sided HD is an asymmetric function, h (S (A), S (B)) ≠ h (S (B), S (A)). Since the Hausdorff distances only detect for extreme deviations, which could be caused by a single noisy point, it is not a robust metric for tracking entire boundaries.
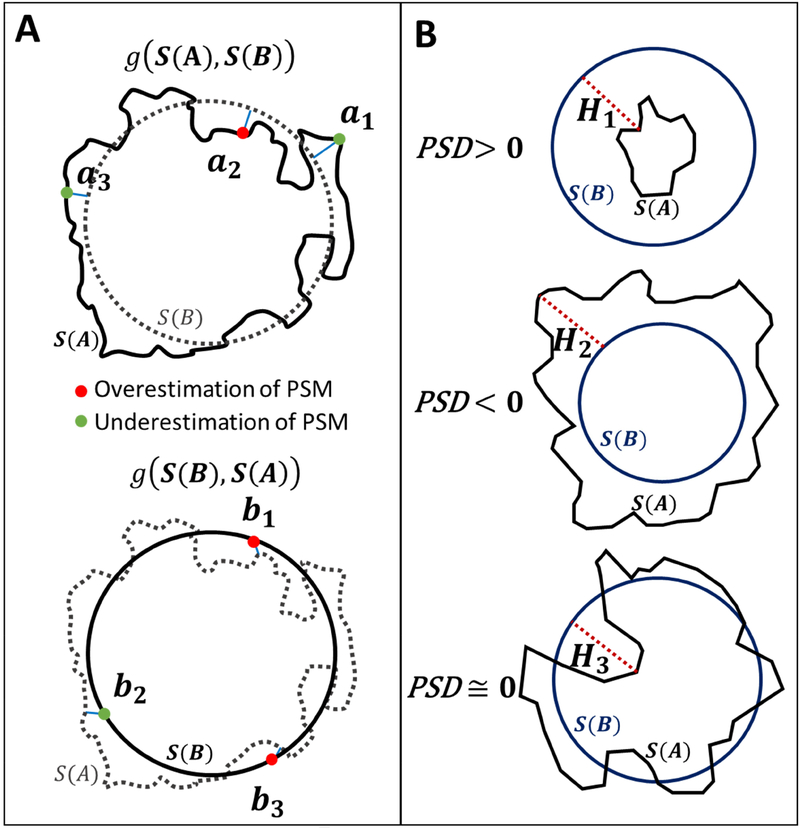
Therefore, we propose a new metric, which we call the pointwise surface distance (PSD). It uses the traditional HD for all surface point to obtain a compact measurement for the degree of alignment of the entire boundary. We first calculate a modified H ausdorff distance from the point a ∈ S(A) to the closest point of S (B) as shown in Eq. (15). Then, we multiply the modified HD with the scalar parameter, “αi, which is either 1 or −1 depending on the position of the select point with respect to other binary mask. For example, if the point a ∈ S(A) lies inside a ∈ B, then parameter is set to unity, α=1, which indicates that the PSM reconstruction overestimates the dimensions. Conversely, if the point a is outside the PSM binary mask (a ∉ B), then α = −1 indicates that PSM reconstruction underestimates as shown in Figure 6A. The one-sided pointwise surface distance, g(S(A),S(B)) was calculated using Eqs. (16–17).
Figure 6.
Pointwise surface distance (PSD) analysis.
(A) Schematic of the one-sided PSD analysis. S(A), and S (B) are the boundaries of MRA and reconstructed parametric structured mesh (PSM) regions, respectively. The top panel represents the one-sided PSD from S(A) to S(B). The green and red points indicate under and overestimation of PSM at each point, respectively. The modified Hausdorff distance (HD) from {a1, a2, a3} to their nearest point in S(B) are visualized in solid blue lines. Points {a1,a3} ∉ B indicates underestimated of PSM diameter for those specific points. In the lower panel, we calculated the one-sided PSD from S(B) to S(A) as the minimum distance from {b1,b2,…,bm} ∈ S(B) to their nearest neighbor in S(A).
(B) A schematic of the difference between HD and PSD computations. Three different cross-sectional vessel samples gives exactly the same HD are shown in red-dotted lines (H1 = H2 = H3), which is an unsatisfactory result. In contrast, the PSD index enables correct quantification of diameter estimation error for assessing PSM reconstruction against the MRA images as the gold standard. Positive PSD index indicates overestimation, PSD > 0, shown on the top. Dimensions are underestimated when it is negative, PSD < 0, as depicted in the middle row. In the lower panel an example of accurate diameter approximation PSD ≅ 0, is shown.
We also defined g(S(B),S(A))), the one-sided PDS from S(B) to S(A), as in Eqs. (18–20). Similarly, when a point b ∈ S(B) lies inside the MRA binary mask (b ∈ A), then PSM underestimates dimensions as shown in Figure 6A.
| (15) |
| (16) |
| (17) |
| (18) |
| (19) |
| (20) |
Finally, we defined PSD(S (A), S (B)), the two-sided pointwise surface distance (PSD) between S (A), and S(B), as the average of the two one-sided PSD as in Eq. (21). The pseudo-code to calculate PSD is given in Table 4.
Table 4.
Algorithm of two-sided pointwise surface distance (PSD) calculation
| Input: Binary mask dataset of A, B. | |
| Output: PSD(S(A), S(B)) | |
| 1 | S(A) = {a1, a2, …, an} ← Edge extraction of A; |
| 2 | S(B) = {b1, b2, …, bm} ← Edge extraction of B; |
| 3 | Compute one-sided PSD from A to B |
| 4 | for each Point a in S (A) do |
| 5 | d(a, S(B)) ← The minimum distance from a to S(B); |
| 6 | if a ∈ B then |
| 7 | α ← +1; //Overestimation of PSM |
| 8 | else a ∉ B then |
| 9 | α ← −1; //Underestimation of PSM |
| 10 | end if |
| 11 | dg(a, S(B)) ← α ⋅ d(a, S(B)); |
| 12 | end for |
| 13 | |
| 14 | Compute one-sided PSD from B to A |
| 15 | for each Point b in S(B) do |
| 16 | d(b, S(A)) ← The minimum distance from b to S(A); |
| 17 | if b ∉ A then |
| 18 | β ← +1; //Overestimation of PSM |
| 19 | else b ∈ A then |
| 20 | β ← −1; //Underestimation of PSM |
| 21 | end if |
| 22 | dg(b, S(A)) ← β ⋅ d(b, S(A)); |
| 23 | end for |
| 24 | |
| 25 | Compute two-sided PSD index of A and B |
| 26 | PSD(S(A), S(B)) ← 0.5 {g(S(A), S(B)) + (S(B), S(A))} |
| 27 | Return PSD(S(A), S(B)); |
| (21) |
Figure 6B shows three vascular segments: the first overestimates the cross-sectional diameter, the second underestimates, the third example correctly approximate the diameter. The reconstructed PSM meshes were evaluated as acceptable, over- or underestimated based on the PSD index, where, if PSD is positive, there are more positive pointwise surface distance than negative ones so the PSM reconstructed was globally overestimated. PSD value close to zero indicates perfectly aligned diameter overlap.
Despite these qualitative differences, all three examples of Figure 6B have identical two-sided HD, which shows the limitation of the HD metrics to assess over and underestimation analysis. Fortunately, the PSD, correctly detect the global geometric trends as desired. Therefore, the jagged-edged MRA images and smooth PSM meshes were analyzed according to PSD criteria.
3. Results
Figure 1 illustrates the information flow diagram for the statistical analysis of reconstructed cerebrovascular trees. To detect gross errors in the tree connectivity, we first visualized MRA and PSM by global superposition in virtual reality environment of Walk-in Brain. For all six subjects, a total of 1364 vascular segments were automatically scanned and 119,738 CRS and 571 BIF sampling frames were captured for quantitative analysis.
3.1. Centerline accuracy
We first performed statistical analysis to evaluate the spatial accuracy of the centerline extraction for the vascular segments. Cross-sectional sampling frames were taken perpendicular to the centerlines of the vessel segments. The comparison of the intensity-weighted centroid of the RGB (red-green-blue) of the MRA against the PSM showed a mean deviation of 145.1±111.5 μm for the vascular CRSs (Figure 5A). Thus, the vascular centerline accuracy reached a sub-pixel size precision (< 400 μm) for the arterial trees in this study.
3.2. Pixel-based statistical analysis
The binary mask areas covered by the MRA and PSM were compared by performing linear regression and Bland Altman analysis showing a good agreement in terms of lumen area and bifurcation topology (R2 =0.95) as shown in Figure 5B. We also quantified the pixel-based relative area overlap using the Dice similarity coefficient. Using the Dice coefficient is computed for all sampling frames with a mean of DscCRS =0.70±0.09 and DscBIF = 0.88 ± 0.11. Total pixel-based reconstruction accuracy, AccCRS =0.91±0.08 for AccBIFs=0.83 ± 0.09. Sensitivity and specificity of mesh reconstruction was evaluated by assessing the AUC for all vascular networks (0.96 ± 0.01 and 0.88± 0.01 for CRSs and BIFs, respectively) as shown in Figure 5C. Table 5–6 summarize the pixel-based statistical analysis for all vascular CRSs and BIFs, respectively.
Table 5.
Pixel-based statistical analysis of the vascular cross-sections.
| Subjects | I | II | III | IV | V | VI | Mean±SD |
|---|---|---|---|---|---|---|---|
| Se | 0.80 | 0.79 | 0.78 | 0.81 | 0.80 | 0.79 | 0.80±0.12 |
| Sp | 0.93 | 0.94 | 0.93 | 0.90 | 0.91 | 0.92 | 0.92±0.10 |
| Ppv | 0.93 | 0.76 | 0.76 | 0.66 | 0.75 | 0.73 | 0.73±0.13 |
| Npv | 0.73 | 0.96 | 0.96 | 0.96 | 0.94 | 0.96 | 0.96±0.06 |
| Acc | 0.92 | 0.92 | 0.92 | 0.89 | 0.89 | 0.91 | 0.91±0.08 |
| Dsc | 0.71 | 0.72 | 0.72 | 0.65 | 0.69 | 0.70 | 0.70±0.09 |
| AUC | 0.96 | 0.96 | 0.96 | 0.95 | 0.96 | 0.94 | 0.96±0.01 |
Se: sensitivity; Sp: specificity; Ppv: predictive positive value; Npv: negative predictive values; Acc: accuracy; Dsc: Dice similarity coefficient; AUC: area under the curve.
Table 6.
Pixel-based statistical analysis of the vascular bifurcations.
| Subjects | I | II | III | IV | V | VI | Mean±SD |
|---|---|---|---|---|---|---|---|
| Se | 0.90 | 0.88 | 0.88 | 0.91 | 0.89 | 0.90 | 0.90±0.06 |
| Sp | 0.89 | 0.69 | 0.88 | 0.49 | 0.69 | 0.63 | 0.63±0.20 |
| Ppv | 0.64 | 0.86 | 0.99 | 0.90 | 0.87 | 0.87 | 0.88±0.12 |
| Npv | 0.86 | 0.70 | 0.46 | 0.53 | 0.71 | 0.67 | 0.65±0.19 |
| Acc | 0.82 | 0.81 | 0.88 | 0.84 | 0.83 | 0.83 | 0.83±0.09 |
| Dsc | 0.87 | 0.86 | 0.93 | 0.91 | 0.87 | 0.87 | 0.88 ± 0.11 |
| AUC | 0.88 | 0.89 | 0.86 | 0.90 | 0.89 | 0.87 | 0.88±0.01 |
Se: sensitivity; Sp: specificity; Ppv: predictive positive value; Npv: negative predictive values; Acc: accuracy; Dsc: Dice similarity coefficient; AUC: area under the curve.
3.3. Point-based surface offset calculation
The pointwise surface distance method was deployed to quantify the difference between the jagged edges of the MRA images and the smooth surface edge of PSM. A schematic of the proposed one-sided pointwise surface distance is shown in Figure 6A. Figure 6B shows the ability of the PSD index to differentiate between three different illustrative CRSs with the same Hausdorff distances. The computed HD was the same for these three cross-sections, while PSD could correctly categorize them into overestimated, underestimated and acceptable mesh reconstructions. Therefore, the PSD is a suitable metric to quantify the diameter approximation for vascular CRSs. Table 7 summarizes the computed HD and PSD for CRSs and BIFs of the six human subjects.
Table 7.
Hausdorff distances (HD) and pointwise surface distance (PSD) for cross-sections (CRSs) and bifurcation (BIFs) of the six human subjects.
| Mean Hausdorff Distances, HD (mm) |
Mean Pointwise Surface Distance, PSD (mm) |
|||
|---|---|---|---|---|
| CRS | BIF | CRS | BIF | |
| Subject I | 0.4513 | 0.8247 | 0.0146 | 0.0004 |
| Subject II | 0.4433 | 0.7861 | 0.0048 | 0.0018 |
| Subject III | 0.4721 | 1.3576 | 0.0045 | 0.0021 |
| Subject IV | 0.4715 | 1.2958 | 0.0083 | 0.0008 |
| Subject V | 0.5010 | 0.6987 | 0.0011 | 0.0021 |
| Subject V1 | 0.4671 | 0.9190 | 0.0090 | 0.0030 |
| Mean | 0.47±0.02 | 0.98±0.28 | 0.0071±0.0047 | 0.0017±0.0009 |
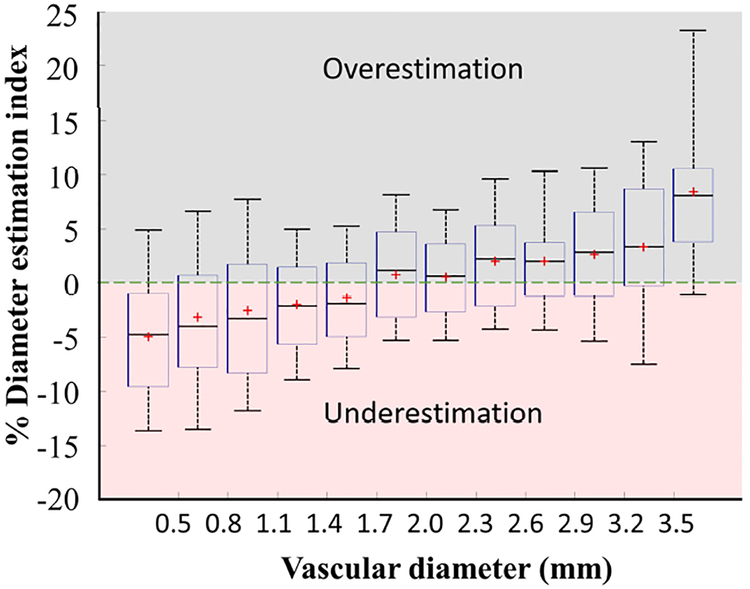
We also introduced the diameter estimation index (DEI) which is a unitless parameter defined as the two-sided PSD divided by the segment diameter, D. Figure 7 deployed the DEI for vascular CRSs of the six cerebral arterial trees to assess the percentage of the over/underestimation of the diameters in vascular cross-sections. Vessel diameter between 0.8 to 3.2 mm exhibited an accuracy of DEI=2.5%. The PSM index showed a tendency of diameter underestimation for the vessels less than D<1.7 mm, as well as overestimation for the vessels over D>2.5 mm.
Figure 7.
Diameter estimation index (DEI) of vascular cross-sections (CRSs) in six cerebral arterial trees. The DEI percentage was calculated for more than 119,000 CRSs. Positive DEI represents over-estimation of PSM diameter and negative DEI shows the under-estimated reconstructed diameters. Vessel diameters in the range of 0.8–3.2 mm have diameter accuracy of DEI ≤ ±2.5%. The PSM method exhibited a tendency of diameter underestimation for the vessels less than 1.7 mm, as well as overestimation for the vessels over 3.5 mm.
3.4. Morphological and CFD analysis
Morphological analysis.
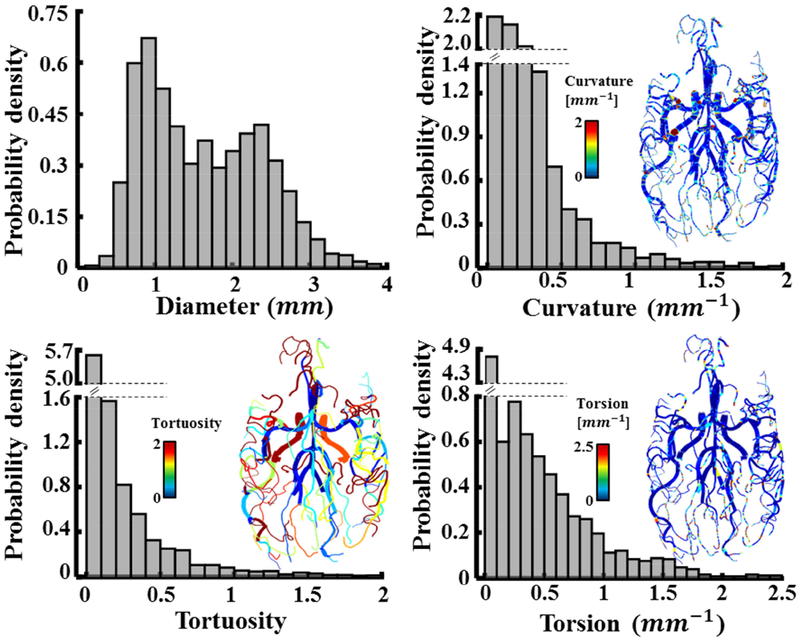
A comprehensive morphological analysis and territorial distributions of the cerebral arterial tree with a comparison between age and genders have been previously studied46,47. We performed a preliminary study on morphological and CFD analysis to show potentially future applications of the PSM vascular reconstruction. Morphological matrices such as curvature, tortuosity, and torsion are measured for all vascular networks as shown in Figure 8. Tortuosity is the ratio between the actual arc-length over the straight-line distance. Curvature and torsion characterize bending and twisting of the centerline in 3D-space. Appendix 1 lists the mathematical formulae used to calculate the cerebrovascular biometrics. Using the probability density function (PDF), we found that the vascular segments have the diameters of 1.63±0.75 mm, tortuosity 0.2±0.4, curvature 0.33±0.63 mm−1, and torsion 0.33±0.57 mm−1.
Figure 8.
Morphological and computational analysis of six reconstructed subject-specific cerebroarterial trees. Probability density functions (PDF) and contour maps visualize the distribution of the vascular biometrics including diameter, curvature, torsion and tortuosity for six human subjects.
Large-scale CFD analysis.
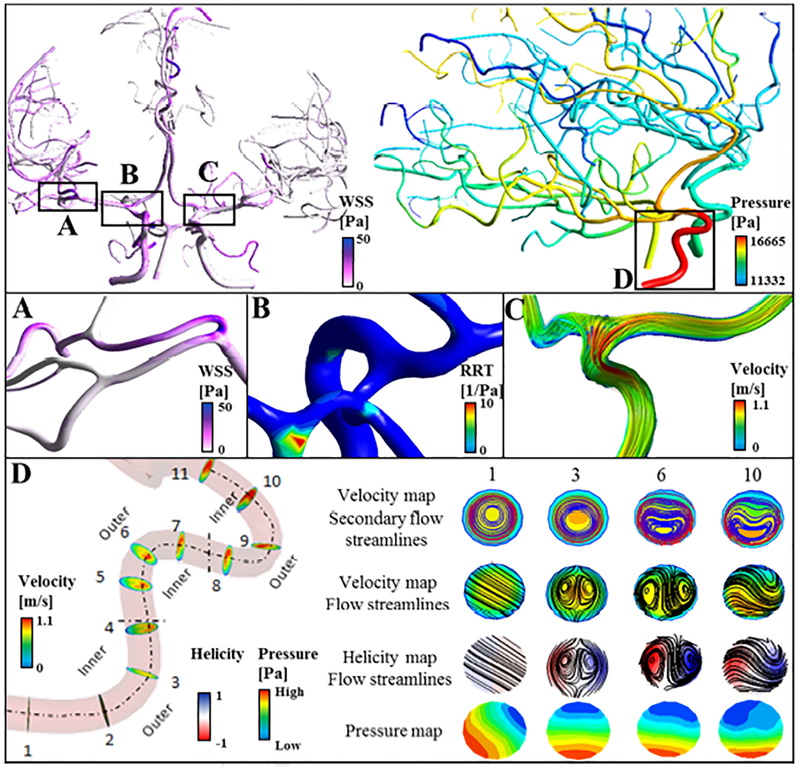
The image-derived reconstruction of vascular tree can be used for computational CFD analysis to quantify hemodynamic risk factors such as relative residence time (RRT). For example, the occurrence of atherosclerosis-prone regions strongly correlates with prolonged RRT48,49. Hemodynamic analysis with the elevated RRT region in the basilar artery is shown in Figure 9. Detailed hemodynamic risk factor analysis in large-scale human arterial trees is discussed elsewhere19.
Figure 9.
Preliminary 3D computational analysis. Validated reconstructed cerebral arterial trees were used for hemodynamic analysis. (A) Distribution of wall shear stress for a small portion of right middle cerebral arteries, MCA. (B) Elevated relative residence time (RRT) in the basilar artery. (C) Blood flow streamlines in the M 1 branch of left MCA. (D) Development of secondary flow in the high-tortuous right internal carotid artery. Vorticity and normalized helicity are shown in select planes. Cross-sectional views in sample location 1, 3, 6 and 10 are scaled to the same diameter for better visualization. In the vessels with high curvature, blood circulates from the inner wall towards the outer wall forming recirculation zones.
Automatic mesh generation and vascular reconstruction are particularly suitable for computer analysis of large datasets such as patient’s medical records database in hospitals. The rigorous and unbiased analysis of imaging data may become a useful enabling technology to better differentiate critical pathological factors for subject-specific variations.
4. Discussion
The aim of this study is to validate the spatial accuracy of a recently proposed automatic mesh generation method for reconstruction of large-scale cerebral arterial trees. Intensity-based centerline evaluation, pixel-based statistical analysis, and pointwise surface distance were used to quantify the shape similarity between the reconstructed PSM meshes and the MRA images of arterial trees for six subjects. With the proposed framework, we quantified the degree of over/underestimation of the anatomically reconstructed PRM for the cerebroarterial trees. Prior work pointed out the difficulties in validating bifurcation geometries due to the discontinuity nature of the segmentation50. Our study successfully validated mesh surface quality also at bifurcating forks. The mean of Dsc=0.88 and PSD=1.7 μm for 571 bifurcations underscore the ability of the reconstructed PSM tofaithfully preserve endovascular bifurcation topology in human arterial trees.
In this work, vascular trees spanning different length-scale ranging the diameter from 5 mm to 400 μm were reconstructed. Although, Dice similarity coefficient above 0.7 is typically taken as “excellent” agreement51, this assessment does not allow direct comparison over different length-scales30. In other words, the same DSc value for a large diameter artery does not represent the same level of accuracy as in a small pial artery. Moreover, pixel-based statistical parameters do not characterize shape fidelity of the reconstructed objects. Our proposed PSD distance metric precisely quantifies changes in topology (under- or over-approximation of the enclosed vessel surfaces). The combination of pixel-based statistical and pointwise surface distance analysis enabled the precise evaluation of morphological attributes such as branch length, vessel diameter and bifurcation topology, and lumen area of vascular network over multiple length-scales needed in arterial tree analysis.
Morphometric analysis of vascular networks like the vessel curvature or tortuosity42–43 can be used for diagnostics and therapeutic monitoring of endovascular diseases52. Subject-specific abnormalities in the cerebroarterial vasculature such as an increased tortuosity might provide an indication of pathologies such as diabetes55, vasculopathies56, tumours57 or dementia58,59. These abnormalities affect blood circulation and may lead to stroke, hemorrhage or hypoxia.
The validated centerline and diameter data allows us to study morphological data of the large portion of cerebrovascular trees. In this study, the Bezier splining of the vascular skeleton facilitates computation and visualization of tortuosity, torsion, and curvature (Figure 8). Automatic biometrics extraction would enable morphological analysis on a large healthy population and patients with intracranial diseases before and after endovascular treatments.
The sampling frame acquisition required about 65 min for each subject using a single-core 2.4 GHz Xenon CPU processor. It takes about 16 min to compute pointwise surface distances for all 2D sampling frames of all BIFs and CRSs (~20,050 snapshots) for each subject (Table 1). The current implementation of the PSD algorithm analyzes every single edge point of MRA and PRM in 2D sampling frames. Future extension of PSD algorithm should perform a direct surface comparison with more efficient 3D surface point sampling techniques39,60.
In this manuscript, PSD was demonstrated for mesh validation, however, it may also be applicable for crisp evaluation of the registration61, segmentation62, morphological data acquision63 and motion detection. The PSD parameter could also be used to quantify and track important medical segmentations over time such as a tumor, prostate, brachial plexus, and brain cortex. The PSD index can also be extended to optimize current smoothing algorithm by evaluating the surface mesh in each iteration to avoid deformation and shrinkage of noisy mesh surfaces.
The present automatic segmentation and validation was geared towards a complete analysis for the healthy arterial tree with no need for operator intervention. In the normal vessels, the circular shape assumption of cross sections limits the application of parametric meshing on lesion sections such as aneurysms. To address aneurysms, the hybrid meshing method is recommended to combine automatic parametric meshes for healthy vessel with manual surface extraction for lesion sections. For pathological cases in cerebrovascular disease, the proposed metrics (PSD) are applicable, however the circular shape assumption of DEI index is not suitable and would need to be generalized such as described in shape-based network generation64.
Another possible direction concerns the application to different imaging modalities to evaluate venous trees. Another application pertains to assessment of arterial wall biomechanics65,66 by using high-resolution MRI vessel wall imaging.
Conclusion
We deployed image-based processing workflow to evaluate the spatial fidelity of large-scale automatic subject-specific cerebroarterial trees using PSM meshing. Such detailed and automatic evaluation is important for computational modeling to ensure the faithful reconstruction of the anatomical structure which in turn dictates the accuracy of CFD simulations and hemodynamic risk-factor analysis. To achieve this long-term goal, the automatic image segmentation17,41 and structured parametric mesh generation18,20 may serve as an intermediate stepping stone to assess high fidelity cerebrovascular disease-related risk-factors analysis in future research.
Supplementary Material
Highlights.
We reconstructed large-scale arterial trees from magnetic resonance angiography data using a parametric structured meshing technique and validate the centerline and diameter accuracy of the reconstructed meshes against raw images in six human subjects.
Automatic parametric mesh generation method has been validated using statistical analysis and modified Hausdorff distance.
Accurate and validated mesh reconstruction of cerebral arterial trees is essential for high-fidelity CFD simulation, hemodynamic risk analysis, as well as morphological analysis.
5. Acknowledgments
The authors would like to gratefully acknowledge partial support of this project by NIH NINDS 1R21NS099896–01A1 and NSF grant of CBET-1301198.
Footnotes
Publisher's Disclaimer: This is a PDF file of an unedited manuscript that has been accepted for publication. As a service to our customers we are providing this early version of the manuscript. The manuscript will undergo copyediting, typesetting, and review of the resulting proof before it is published in its final form. Please note that during the production process errors may be discovered which could affect the content, and all legal disclaimers that apply to the journal pertain.
6. Reference
- 1.Dolan JM, Kolega J & Meng H High wall shear stress and spatial gradients in vascular pathology: a review. Ann. Biomed. Eng 41, 1411–1427 (2013). [DOI] [PMC free article] [PubMed] [Google Scholar]
- 2.Cebral JR, Mut F, Weir J & Putman C Quantitative Characterization of the Hemodynamic Environment in Ruptured and Unruptured Brain Aneurysms. Am. J. Neuroradiol 32, 145–151 (2011). [DOI] [PMC free article] [PubMed] [Google Scholar]
- 3.Omodaka S et al. Local hemodynamics at the rupture point of cerebral aneurysms determined by computational fluid dynamics analysis. Cerebrovasc. Dis. BaselSwitz 34, 121–129 (2012). [DOI] [PubMed] [Google Scholar]
- 4.Ku DN, Giddens DP, Zarins CK & Glagov S Pulsatile flow and atherosclerosis in the human carotid bifurcation. Positive correlation between plaque location and low oscillating shear stress. Arterioscler. Dallas Tex 5, 293–302 (1985). [DOI] [PubMed] [Google Scholar]
- 5.Rikhtegar F et al. Choosing the optimal wall shear parameter for the prediction of plaque location-A patient-specific computational study in human left coronary arteries. Atherosclerosis 221, 432–437 (2012). [DOI] [PubMed] [Google Scholar]
- 6.Arzani A & Shadden SC Characterizations and Correlations of Wall Shear Stress in Aneurysmal Flow. J. Biomech. Eng 138, 014503/1–014503/10 (2015). [DOI] [PMC free article] [PubMed] [Google Scholar]
- 7.Peiffer V, Sherwin SJ & Weinberg PD Does low and oscillatory wall shear stress correlate spatially with early atherosclerosis? A systematic review. Cardiovasc. Res 99, 242–250 (2013). [DOI] [PMC free article] [PubMed] [Google Scholar]
- 8.Cruz JP et al. Delayed Ipsilateral Parenchymal Hemorrhage Following Flow Diversion for the Treatment of Anterior Circulation Aneurysms. Am. J. Neuroradiol 33, 603–608 (2012). [DOI] [PMC free article] [PubMed] [Google Scholar]
- 9.Wermer MJH, Greebe P, Algra A & Rinkel GJE Incidence of Recurrent Subarachnoid Hemorrhage After Clipping for Ruptured Intracranial Aneurysms. Stroke 36, 2394–2399 (2005). [DOI] [PubMed] [Google Scholar]
- 10.Amini A, Osborn AG, McCall TD & Couldwell WT Remote Cerebellar Hemorrhage. Am. J. Neuroradiol 27, 387–390 (2006). [PMC free article] [PubMed] [Google Scholar]
- 11.Mitha AP et al. Can the windkessel hypothesis explain delayed intraparenchymal haemorrhage after flow diversion? A case report and model-based analysis of possible mechanisms. Heart Lung Circ 24, 824–830 (2015). [DOI] [PubMed] [Google Scholar]
- 12.Antiga L et al. An image-based modeling framework for patient-specific computational hemodynamics. Med. Biol. Eng. Comput 46, 1097–1112 (2008). [DOI] [PubMed] [Google Scholar]
- 13.Antiga L, Ene-iordache B & Remuzzi A Centerline Computation and Geometric Analysis of Branching Tubular Surfaces with Application to Blood Vessel Modeling in 11–18 (2003). [Google Scholar]
- 14.Materialize Mimics software. Belgium Available at: www.materialise.com/en/medical/software/mimics. (Accessed: 11th February 2018)
- 15.Yushkevich PA et al. User-guided 3D active contour segmentation of anatomical structures: significantly improved efficiency and reliability. NeuroImage 31, 1116–1128 (2006). [DOI] [PubMed] [Google Scholar]
- 16.Antiga L, Ene-Iordache B, Remuzzi G & Remuzzi A Automatic generation of glomerular capillary topological organization. Microvasc. Res 62, 346–354 (2001). [DOI] [PubMed] [Google Scholar]
- 17.Hsu C-Y et al. Gap-free segmentation of vascular networks with automatic image processing pipeline. Comput. Biol. Med 82, 29–39 (2017). [DOI] [PubMed] [Google Scholar]
- 18.Ghaffari M et al. Large-scale subject-specific cerebral arterial tree modeling using automated parametric mesh generation for blood flow simulation. Comput. Biol. Med 91, 353–365 (2017). [DOI] [PMC free article] [PubMed] [Google Scholar]
- 19.Ghaffari M, Alaraj A, Du X, Charbel FT & Linninger AA Quantification of near-wall hemodynamic risk factors in large-scale cerebral arterial tree. Int. J. Numer. Methods Biomed. Eng (Under Review) (2018). [DOI] [PMC free article] [PubMed] [Google Scholar]
- 20.Ghaffari M, Hsu C-Y & Linninger AA Automatic reconstruction and generation of structured hexahedral mesh for non-planar bifurcations in vascular network. Comput Aided Chem Eng (2015). [Google Scholar]
- 21.Hartung G, Alaraj A & Linninger A Walk-In Brain: Virtual Reality Environment for Immersive Exploration and Simulation of Brain Metabolism and Function. Comput. Aided Chem. Eng 39, 649–658 (2017). [Google Scholar]
- 22.Luan K, Ohya T, Liao H & Sakuma I High-Quality Intra-operative Ultrasound Reconstruction Based on Catheter Path in Computer Aided Surgery (eds. Dohi T & Liao H) 113–124 (Springer Japan, 2012). [Google Scholar]
- 23.Goubergrits L et al. Coronary Artery WSS Profiling Using a Geometry Reconstruction Based on Biplane Angiography. Ann. Biomed. Eng 37, 682–691 (2009). [DOI] [PubMed] [Google Scholar]
- 24.Chiu B, Ukwatta E, Shavakh S & Fenster A Quantification and visualization of carotid segmentation accuracy and precision using a 2D standardized carotid map. Phys. Med. Biol 58, 3671–3703 (2013). [DOI] [PubMed] [Google Scholar]
- 25.Zou KH et al. Statistical Validation of Image Segmentation Quality Based on a Spatial Overlap Index. Acad. Radiol 11, 178–189 (2004). [DOI] [PMC free article] [PubMed] [Google Scholar]
- 26.Grabner G et al. Post Mortem Validation of MRI-Identified Veins on the Surface of the Cerebral Cortex as Potential Landmarks for Neurosurgery. Front. Neurosci 11, (2017). [DOI] [PMC free article] [PubMed] [Google Scholar]
- 27.Sampat MP, Wang Z, Gupta S, Bovik AC & Markey MK Complex Wavelet Structural Similarity: A New Image Similarity Index. IEEE Trans. Image Process 18, 2385–2401 (2009). [DOI] [PubMed] [Google Scholar]
- 28.Franchi D, Gallo P, Marsili L & Placidi G A shape-based segmentation algorithm for X-ray digital subtraction angiography images. Comput. Methods Programs Biomed 94, 267–278 (2009). [DOI] [PubMed] [Google Scholar]
- 29.Babin D, Pizurica A, De Vylder J, Vansteenkiste E & Philips W Brain blood vessel segmentation using line-shaped profiles. Phys. Med. Biol 58, 8041–8061 (2013). [DOI] [PubMed] [Google Scholar]
- 30.Crum WR, Camara O & Hill DLG Generalized overlap measures for evaluation and validation in medical image analysis. IEEE Trans. Med. Imaging 25, 1451–1461 (2006). [DOI] [PubMed] [Google Scholar]
- 31.Oeltze S & Preim B Visualization of vasculature with convolution surfaces: method, validation and evaluation. IEEE Trans. Med. Imaging 24, 540–548 (2005). [DOI] [PubMed] [Google Scholar]
- 32.Auricchio F, Conti M, Ferrazzano C & Sgueglia GA A simple framework to generate 3D patient-specific model of coronary artery bifurcation from single-plane angiographic images. Comput. Biol. Med 44, 97–109 (2014). [DOI] [PubMed] [Google Scholar]
- 33.Kim SH & Park R-H An efficient algorithm for video sequence matching using the modified Hausdorff distance and the directed divergence. IEEE Trans. Circuits Syst. Video Technol 12, 592–596 (2002). [Google Scholar]
- 34.Shao F, Cai S & Gu J A modified Hausdorff distance based algorithm for 2-dimensional spatial trajectory matching in 2010 5th International Conference on Computer Science Education 166–172 (2010). doi: 10.1109/ICCSE.2010.5593666 [DOI] [Google Scholar]
- 35.Gao Y Efficiently comparing face images using a modified Hausdorff distance. IEE Proc. - Vis. Image Signal Process 150, 346–350 (2003). [Google Scholar]
- 36.Morain-Nicolier F, Lebonvallet S, Baudrier E & Ruan S Hausdorff Distance based 3D Quantification of Brain Tumor Evolution from MRI Images in 2007 29th Annual International Conference of the IEEE Engineering in Medicine and Biology Society 5597–5600 (2007). doi: 10.1109/IEMBS.2007.4353615 [DOI] [PubMed] [Google Scholar]
- 37.Khotanlou H, Colliot O, Atif J & Bloch I 3D brain tumor segmentation in MRI using fuzzy classification, symmetry analysis and spatially constrained deformable models. Fuzzy Sets Syst 160, 1457–1473 (2009). [Google Scholar]
- 38.Babalola KO et al. Comparison and Evaluation of Segmentation Techniques for Subcortical Structures in Brain MRI in Medical Image Computing and Computer-Assisted Intervention - MICCAI 2008 409–416 (Springer, Berlin, Heidelberg, 2008). doi: 10.1007/978-3-540-85988-8_49 [DOI] [PubMed] [Google Scholar]
- 39.Tang M, Lee M & Kim YJ Interactive Hausdorff Distance Computation for General Polygonal Models in ACMSIGGRAPH2009 Papers 74:1–74:9 (ACM, 2009). doi: 10.1145/1576246.1531380 [DOI] [Google Scholar]
- 40.Hsu C-Y, Schneller B, Ghaffari M, Alaraj A & Linninger A Medical Image Processing for Fully Integrated Subject Specific Whole Brain Mesh Generation. Technologies 3, 126–141 (2015). [Google Scholar]
- 41.Hsu C-Y et al. Automatic recognition of subject-specific cerebrovascular trees. Magn. Reson. Med 77, 398–410 (2017). [DOI] [PMC free article] [PubMed] [Google Scholar]
- 42.Sethian JA A fast marching level set method for monotonically advancing fronts. Proc. Natl. Acad. Sci 93, 1591–1595 (1996). [DOI] [PMC free article] [PubMed] [Google Scholar]
- 43.Lorensen WE & Cline HE Marching cubes: A high resolution 3D surface construction algorithm. Comput. Graph 21, 163–169 (1987). [Google Scholar]
- 44.Antiga L & Steinman DA Robust and objective decomposition and mapping of bifurcating vessels. IEEE Trans. Med. Imaging 23, 704–713 (2004). [DOI] [PubMed] [Google Scholar]
- 45.Postnov DD, Tuchin VV & Sosnovtseva O Estimation of vessel diameter and blood flow dynamics from laser speckle images. Biomed. Opt. Express 7, 2759–2768 (2016). [DOI] [PMC free article] [PubMed] [Google Scholar]
- 46.Wright SN et al. Digital reconstruction and morphometric analysis of human brain arterial vasculature from magnetic resonance angiography. NeuroImage 82, 170–181 (2013). [DOI] [PMC free article] [PubMed] [Google Scholar]
- 47.Mut F, Wright S, Ascoli GA & Cebral JR Morphometric, geographic, and territorial characterization of brain arterial trees. Int. J. Numer. Methods Biomed. Eng 30, 755–766 (2014). [DOI] [PMC free article] [PubMed] [Google Scholar]
- 48.Buchanan JR, Kleinstreuer C, Hyun S & Truskey GA Hemodynamics simulation and identification of susceptible sites of atherosclerotic lesion formation in a model abdominal aorta. J. Biomech 36, 1185–1196 (2003). [DOI] [PubMed] [Google Scholar]
- 49.Buchanan JR, Kleinstreuer C, Truskey GA & Lei M Relation between non-uniform hemodynamics and sites of altered permeability and lesion growth at the rabbit aorto-celiac junction. Atherosclerosis 143, 27–40 (1999). [DOI] [PubMed] [Google Scholar]
- 50.Suinesiaputra A, de Koning PJH, Zudilova-Seinstra E, Reiber JHC & van der Geest RJ Automated quantification of carotid artery stenosis on contrast-enhanced MRA data using a deformable vascular tube model. Int. J. Cardiovasc. Imaging 28, 1513–1524 (2012). [DOI] [PMC free article] [PubMed] [Google Scholar]
- 51.Zijdenbos AP, Dawant BM, Margolin RA & Palmer AC Morphometric analysis of white matter lesions in MR images: method and validation. IEEE Trans. Med. Imaging 13, 716–724 (1994). [DOI] [PubMed] [Google Scholar]
- 52.Bullitt E, Gerig G, Pizer SM, Lin W & Aylward SR Measuring tortuosity of the intracerebral vasculature from MRA images. IEEE Trans. Med. Imaging 22, 1163–1171 (2003). [DOI] [PMC free article] [PubMed] [Google Scholar]
- 53.Onkaew D, Turior R, Uyyanonvara B, Akinori N & Sinthanayothin C Automatic retinal vessel tortuosity measurement using curvature of improved chain code in International Conference on Electrical, Control and Computer Engineering 2011 (InECCE) 183–186 (2011). doi: 10.1109/INECCE.2011.5953872 [DOI] [Google Scholar]
- 54.Hart WE, Goldbaum M, Cote B, Kube P & Nelson MR Automated measurement of retinal vascular tortuosity. Proc. AMIA Annu. Fall Symp 459–463 (1997). [PMC free article] [PubMed] [Google Scholar]
- 55.Sasongko MB et al. Retinal Vessel Tortuosity and Its Relation to Traditional and Novel Vascular Risk Markers in Persons with Diabetes. Curr. Eye Res 41, 551–557 (2016). [DOI] [PubMed] [Google Scholar]
- 56.Kim BJ et al. Vascular tortuosity may be related to intracranial artery atherosclerosis. Int. J. Stroke Off. J. Int. Stroke Soc 10, 1081–1086 (2015). [DOI] [PubMed] [Google Scholar]
- 57.Jain RK Normalization of Tumor Vasculature: An Emerging Concept in Antiangiogenic Therapy. Science 307, 58–62 (2005). [DOI] [PubMed] [Google Scholar]
- 58.Gorelick PB et al. Vascular Contributions to Cognitive Impairment and Dementia. Stroke J. Cereb. Circ 42, 2672–2713 (2011). [DOI] [PMC free article] [PubMed] [Google Scholar]
- 59.Nicolakakis N & Hamel E Neurovascular function in Alzheimer’s disease patients and experimental models. J. Cereb. Blood Flow Metab 31, 1354–1370 (2011). [DOI] [PMC free article] [PubMed] [Google Scholar]
- 60.Guthe M, Borodin P & Klein R Fast and accurate Hausdorff distance calculation between meshes. J. WSCG 13, 41–48 (2005). [Google Scholar]
- 61.Chui H & Rangarajan A A new point matching algorithm for non-rigid registration. Comput. Vis. Image Underst 89, 114–141 (2003). [Google Scholar]
- 62.Popovic A, de la Fuente M, Engelhardt M & Radermacher K Statistical validation metric for accuracy assessment in medical image segmentation. Int. J. Comput. Assist. Radiol. Surg 2, 169–181 (2007). [Google Scholar]
- 63.Luo T, Wischgoll T, Kwon Koo B, Huo Y & Kassab GS IVUS Validation of Patient Coronary Artery Lumen Area Obtained from CT Images. PLoS ONE 9, (2014). [DOI] [PMC free article] [PubMed] [Google Scholar]
- 64.A Novel Similarity Measure using a Normalized Hausdorff Distance for Trademarks Retrieval Based on Genetic Algorithm - Semantic Scholar Available at: /paper/A-Novel-Similarity-Measure-using-a-Normalized-for-Umugwaneza/93ea1710733d51bfe26e128accb071106ef0148f. (Accessed: 24th June 2018)
- 65.Kontzialis M & Wasserman BA Intracranial vessel wall imaging: current applications and clinical implications. Neurovascular Imaging 2, 4 (2016). [Google Scholar]
- 66.Alexander MD et al. High-resolution intracranial vessel wall imaging: imaging beyond the lumen. J Neurol Neurosurg Psychiatry 87, 589–597 (2016). [DOI] [PMC free article] [PubMed] [Google Scholar]
Associated Data
This section collects any data citations, data availability statements, or supplementary materials included in this article.


