Abstract
Loss of functional islet β-cell mass through cellular death or dedifferentiation is thought to lead to dysglycemia during the progression from obesity to type 2 diabetes. To assess these processes in a mouse model of obesity, we performed measures of circulating cell-free differentially methylated insulin II (Ins2) DNA as a biomarker of β-cell death and aldehyde dehydrogenase 1 family member A3 (ALDH1A3) and forkhead box 01 (Foxo1) immunostaining as markers of β-cell dedifferentiation. Eight-week-old, C57BL/6J mice were fed a low-fat diet (LFD; 10% kcal from fat) or a high-fat diet (HFD; 60% kcal from fat) and were followed longitudinally for up to 13 wk to measure glycemic control and β-cell mass, death, and dedifferentiation. Compared with LFD controls, β-cell mass increased during the feeding period in HFD animals, and statistically greater β-cell death (unmethylated Ins2) was detectable at 2 and 6 wk after diet initiation. Those times correspond to periods when significant step increases in fasting glucose and glucose intolerance, respectively, were detected. ALDH1A3 and Foxo1 immunostaining of the pancreas revealed evidence of β-cell dedifferentiation by 13 wk when fed an HFD, but not in LFD controls. In conclusion, early episodic β-cell death may be a feature of cellular turnover correlated with changes in glycemia during β-cell mass accrual in obesity, whereas β-cell dedifferentiation may be a feature seen later in established disease.—Tersey, S. A., Levasseur, E. M., Syed, F., Farb, T. B., Orr, K. S., Nelson, J. B., Shaw, J. L., Bokvist, K., Mather, K. J., Mirmira, R. G. Episodic β-cell death and dedifferentiation during diet-induced obesity and dysglycemia in male mice.
Keywords: glucose intolerance, islet, cell dedifferentiation
During obesity, insulin resistance in the muscle, liver, and adipose tissue increases the demand for insulin secretion from β cells to maintain glucose homeostasis (1). Ultimately, the inability of the β cell to fully compensate is a major factor in the progression from normoglycemia to dysglycemia and frank type 2 diabetes (T2D) (2, 3). In young C57BL/6J mice, the response of β cells to insulin resistance is accrual of new cellular mass, a process that involves replication of β cells via activation of growth-promoting pathways, such as the PI3K/Akt/mTORC1 pathway (4–6). However, despite the increase in β-cell mass, this compensatory response eventually fails, with increased, but insufficient, release of insulin from β cells resulting in impaired glucose homeostasis (3, 5). This impaired response is thought to result from either apoptotic loss of β cells or loss of β-cell functional capacity (or both), leading to impaired glucose homeostasis and eventual T2D.
It has recently been proposed that loss of functional β cells through the process of dedifferentiation may predominate over apoptosis as a mechanism in the progression to T2D. Using elegant lineage tracing experiments, dedifferentiation was identified in multiple mouse models of established T2D (7) and does not appear to be reversed by drugs known to improve glycemic control (8). In some cases, in the dedifferentiated state, those cells, take on features of other islet hormone-producing cell types, such as glucagon-secreting α cells, which may exacerbate glucose intolerance. Using a marker of cellular dedifferentiation, aldehyde dehydrogenase 1 family member A3 (ALDH1A3), it was also suggested that β-cell dedifferentiation may be a feature of human T2D (9). The occurrence of dedifferentiation in established T2D, however, does not preclude β-cell death as a feature of obesity and pre-T2D, and to date, clear evidence for β-cell death in models of obesity has not been provided.
Technical challenges exist in the identification of dying β cells. First, β cells represent a small fraction of pancreatic mass (<1%) (10), and extensive spatial sampling is required to identify dying β cells by traditional immunohistochemical techniques (e.g., the TUNEL assay). Importantly, although dedifferentiated cells can be identified long after the dedifferentiation process initiates, cellular death is more difficult to capture because clearance of dead cells occurs in a relatively rapid and orchestrated process (efferocytosis) (11). Recently, we and others (12–15) developed a differentially methylated DNA (DMD) assay that can be used to monitor ongoing β-cell death in vivo. Our DMD assay measures levels of unmethylated and methylated cytosine–phosphate–guanine (CpG) site at position −182 bp (relative to the transcriptional start site) in the Ins2 DNA in the circulation, with the unmethylated species reflecting DNA liberated from dying β cells, and the methylated species presumably representing DNA liberated from dying non-β cells. An advantage to the DMD assay is the ability to longitudinally sample and, thereby, sensitively monitor, β-cell death in animals. To date, the DMD assay has not been applied to address the issue of β-cell death and/or dedifferentiation during obesity progression. In this study, we used the DMD assay, traditional TUNEL immunostaining, ALDH1A3 immunostaining, and forkhead box 01 (Foxo1) immunostaining to monitor β-cell death and dedifferentiation in C57BL/6J male mice during the progression of dysglycemia in response to a high-fat diet (HFD).
MATERIALS AND METHODS
Animal studies
Male C57BL/6J and C57BLKS/J-db/db mice were obtained from The Jackson Laboratory (Bar Harbor, ME, USA) and maintained under protocols approved by the Indiana University School of Medicine Institutional Animal Care. C57BL/6J mice were acclimated for 1 wk before being placed on either a low-fat diet (LFD; 10% kcal from fat; D12450B; Research Diets, New Brunswick, NJ, USA) or an HFD (60% kcal from fat; D12492; Research Diets) starting at 8 wk old. Blood was harvested from the tail vein and processed as serum for the DMD assay. All mice were monitored for body weight and random blood glucose weekly. A glucose tolerance test (GTT) was performed as previously described by Evans-Molina et al. (16) using glucose injected i.p. at a dose 2 g/kg of lean body mass after being unfed overnight. Insulin was measured at 0 and 2 min after glucose challenge by Stellux Chemi Rodent Insulin ELISA (Alpco, Salem, NH, USA). Lean body mass was measured by dual-energy X-ray absorptiometry analysis (Lunar Piximus II densitometer; GE Healthcare Life Sciences, Little Chalfont St. Giles, United Kingdom). A subset of mice from each group was euthanized every 2 wk, and pancreata were harvested for β-cell mass measurements, as described below. After 10 wk of diet treatment, a subset of mice fed LFD received streptozotocin (STZ) at 55 mg/kg body weight daily for 5 d. C57BLKS/J-db/db mice were euthanized at 10 wk old, and pancreata were harvested.
DNA isolation and bisulfite conversion
DNA was isolated from 20 μl of serum using QiaAmp DNA Blood Mini Kit (Qiagen, Hilden, Germany) with 5 μg poly-A as a carrier. DNA recovery (of the poly-A carrier) was quantified with a nanophotometer (Implen, Munich, Germany). All samples showed ≥85% recovery of DNA after isolation. Tissue samples were isolated with a GeneElute Mammalian Genomic DNA Kit (MilliporeSigma, Burlington, MA, USA). All samples then underwent bisulfite conversion with the EZ DNA Methylation Kit (Zymo Research, Irvine, CA, USA) or the EZ DNA Methylation-Lightning kit (Zymo Research), and conversion was verified with a before and after conversion sample in the droplet digital PCR (dPCR).
DMD assay
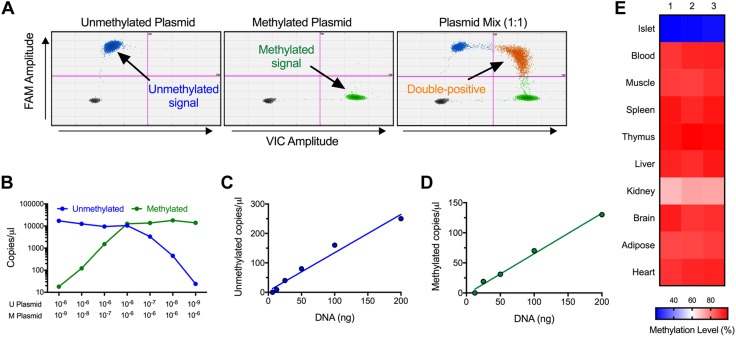
Primers and dual-fluorescent probes for interrogating methylation at CpG position −182 bp of the mouse Ins2 gene were previously described by Fisher et al. (14). The DMD assay with dPCR (Bio-Rad Laboratories, Hercules, CA, USA) and primers and probes for mouse Ins2 were previously described (14). Values were normalized for DNA recovery, and back-calculated to the volume of serum used in the DNA isolation (typically 20 µl). To assess linearity of the DMD assay, 1 µg of EcoRI-digested mouse islet genomic DNA was spiked into 1 ml of normal mouse serum, then the serum was diluted serially into normal, unspiked mouse serum, as indicated in Fig. 1. DNA isolation and the DMD assay proceeded as described above.
Figure 1.
Mouse DMD assay specificity and validation. A) Two-dimensional plots with plasmid standards for unmethylated and methylated mouse Ins2 DNA and for a 1:1 mixture of the 2 plasmids. Arrows identify the unmethylated, methylated, and unmethylated + methylated (double-positive) Ins2 DNA-containing droplets. B) Quantitation of plasmid dilution curves, presented as copies per microliter. C, D) Quantitation of dilution curves of serum spiked with mouse DNA for unmethylated Ins2 DNA (C) and methylated Ins2 DNA (D). R2 = 0.9733 for unmethylated Ins2 DNA and R2 = 0.9917 for methylated Ins2 DNA. E) Quantification of methylation status in primary mouse tissues.
Morphometric assessment of β-cell death and mass
Pancreata from ≥3 different mice/group were fixed in 4% paraformaldehyde, paraffin embedded, and sectioned onto glass slides. Pancreata were stained for cellular apoptosis with the following antibodies: anti-insulin (1:1500,A0564; Agilent Technologies, Santa Clara, CA, USA), anti-glucagon, (1:100, PU039-UP; BioGenex, Fremont, CA, USA), and the ApopTag Red In Situ Apoptosis Detection Kit (MilliporeSigma), and nuclei were stained with Hoechst 33342 (Thermo Fisher Scientific, Waltham, MA, USA). Images were acquired with a Panoramic Midi (3DHistech, Budapest, Hungary). Pancreata were stained for dedifferentiation with the following antibodies: anti-insulin (1:350, A0564; Agilent Technologies), anti-ALDH1A3 (1:500, NBP2-15339; Novus Biologicals, Littleton, CO, USA), and anti-Foxo1 (1:100, NB200-307; Novus Biologicals), and nuclei were stained with DAPI (Thermo Fisher Scientific). Images were acquired with a LSM800 confocal laser scanning microscope (Carl Zeiss, Oberkochen, Germany). β-cell death was calculated by counting the number of TUNEL + insulin+ cells per total insulin+ cells on 5 sections 50 μm apart per animal (>1500 β cells were counted) by an experienced individual who was blind to sample identity. ALDH1A3 positivity was calculated by counting the number of ALDH1A3+ islet cells per total islet cells on 5 sections 50 μm apart per animal (>1500 islet cells were counted). Nuclear Foxo1 was calculated counting the number of positive nuclear Foxo1+/insulin+ cells per total insulin+ cells on 5 sections 50 μm apart per animal (>1500 islet cells were counted). β-cell mass was calculated as previously detailed by Maier et al. (17) with 5 sections 50 μm apart per animal and Zen Blue software (Carl Zeiss) for quantification. Average β-cell size was calculated by dividing β-cell volume by total β-cell number (total nuclei), as previously described by Chintinne et al. (10).
Statistical analysis
All data are presented as means ± sem. Prism software (v.7.0c; GraphPad Software, La Jolla, CA, USA) was used for statistical analyses. Statistical significance was assumed at P < 0.05. Data were analyzed by 2-way ANOVA followed by post hoc analysis with a 2-tailed, unpaired Student’s t test at individual time points.
RESULTS
Linearity of the mouse DMD assay and relative tissue specificity of unmethylated Ins2
Before assessing β-cell death in mouse models, we modified our established real-time PCR-based DMD assay (14) for compatibility with the more-precise droplet dPCR technique that allows for absolute quantitation of DNA copy numbers (18). The primers described in our original study interrogated differential methylation at cytosine position −182 bp (relative to the transcriptional start site) of the mouse Ins2 gene. We validated the specificity of those primers in dPCR with plasmids containing cloned methylated or unmethylated Ins2 genes. As shown in the 2-dimensional dPCR plots in Fig. 1A, the primers quantitatively distinguished mixtures of those plasmids. Figure 1B–D shows that the primers detected mouse islet DNA spiked into mouse serum linearly and quantitatively. Bisulfite-based sequencing previously showed (19) that the CpG at position −182 bp of the Ins2 gene is predominantly unmethylated in mouse islets and β cells compared with a host of other tissues. To verify the relative enrichment of unmethylated Ins2 DNA in islets, we next tested our DMD assay on DNA isolated from primary mouse tissues. As shown in the heat map in Fig. 1E, the percentage of unmethylated CpG sites at position −182 bp was 81–82% in mouse islets (a finding consistent with the observation that mouse islets are composed of ∼80% β cells); by contrast, other tissue types (muscle, spleen, thymus, liver, brain, adipose, and heart) exhibit ≤12%, and kidney exhibits 28%, unmethylated CpGs at that position. Taken together, these data demonstrate the linearity of our dPCR-based DMD assay and show the relative enrichment of unmethylated Ins2 in islet tissue.
Transient β-cell death during the development of obesity and glucose intolerance in mice
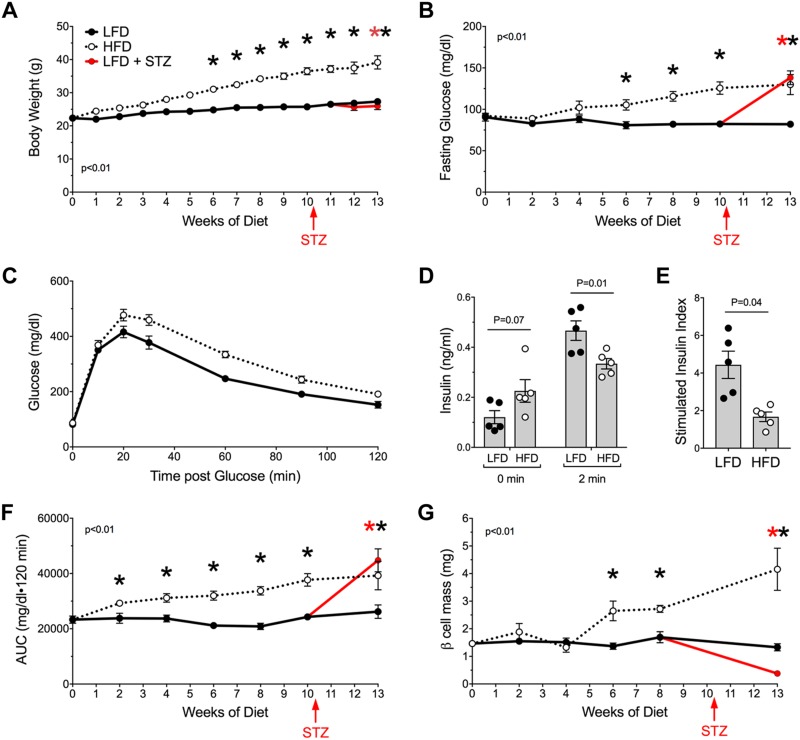
To assess the occurrence of β-cell death longitudinally during the development of obesity and glucose intolerance, we used our DMD assay in an HFD feeding model in mice. C57BL/6J mice were fed an HFD containing 60% calories from fat starting at 8 wk old and compared, in parallel, to control mice fed an LFD containing 10% calories from fat. As shown in Fig. 2A, B, from 6 wk after diet initiation, LFD-fed mice had a slight increase in body weight over time, similar to previously published data (20), and HFD-fed mice exhibited statistically increased body weights and fasting blood glucose values compared with control LFD-fed animals. Notably, HFD-fed mice showed impaired glucose tolerance by GTT as early as 2 wk after diet initiation (Fig. 2C). Additionally, after 2 wk after HFD initiation, fasting insulin levels were increased compared with LFD-fed animals, and glucose-stimulated insulin levels were decreased leading to a decreased insulin-stimulation index (Fig. 2D, E), compared with controls. Glucose intolerance continued to worsen slightly over time in HFD-fed mice (Fig. 2F). β-cell mass, quantified every 2 wk by histology in a subset of animals, did not increase significantly in LFD-fed mice during the feeding period, consistent with previously published data (21), whereas β-cell mass increased significantly in HFD-fed animals compared with controls by 6 wk after diet initiation (Fig. 2G).
Figure 2.
Metabolic phenotype during LFD and HFD feeding in C57BL/6J mice. Mice were fed an LFD or HFD starting at 8 wk old. At 11 wk of being fed those diets, a cohort of mice in each group was treated with STZ to induce β cell death; n = 6–12 mice total for each of 3 groups, performed on 2 separate occasions. A–E) Body weight measurements (A), fasting blood glucose measurements (B), GTT after 2 wk on diet (C), and insulin levels at 0 and 2 min during an intraperitoneal GTT (n = 5 mice) (D) are shown, and the insulin stimulation index (insulin levels at 2 min divided by insulin levels at 0 min using the data presented in D) is depicted (E). F) AUC of intraperitoneal GTTs. G) β-cell mass (N = 3–4 mice). Data are presented as means ± sem. *P < 0.05 for HFD compared with LFD or for LFD–STZ compared with LFD.
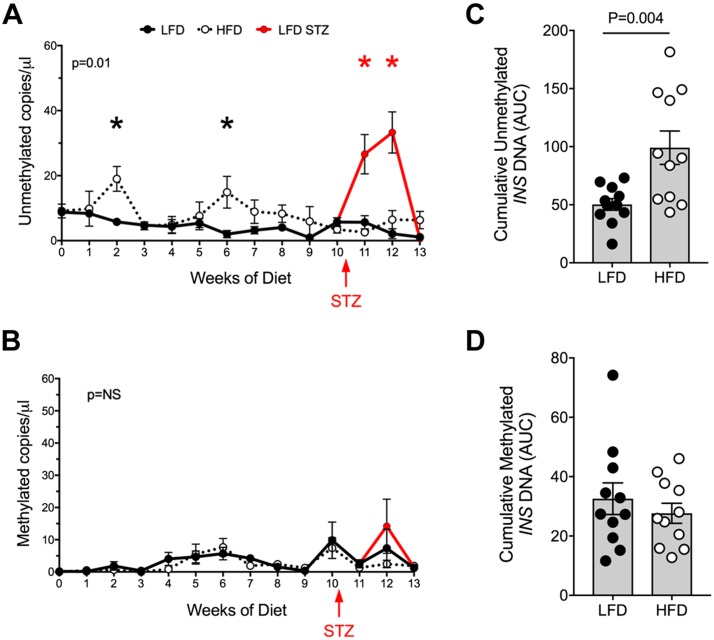
Compared with LFD-fed control animals, HFD-fed mice exhibited episodic increases in unmethylated Ins2 DNA levels at 2 and 6 wk after diet initiation (Fig. 3A), coincident with the time points in which glucose levels in unfed states and GTTs were elevated, respectively (Fig. 2B, F). By contrast, methylated Ins2 DNA levels were not statistically different in HFD-fed animals compared with controls across the feeding period (Fig. 3B). Area under the curve (AUC) analysis of the Ins2 DNA levels across the feeding period from 0 to 10 wk showed greater unmethylated Ins2 DNA in HFD-fed animals compared with controls, but no significant differences in methylated Ins2 DNA were observed (Fig. 3C, D). As a positive control to demonstrate that the DMD assay reports β-cell death, we induced β-cell death in LFD-fed mice at 10 wk after diet initiation by administering multiple low doses of the β-cell–specific toxin STZ. As shown in Fig. 3A, C, unmethylated Ins2 (but not methylated Ins2) DNA levels increased significantly 1 wk after STZ injections, then declined to baseline levels.
Figure 3.
Circulating, unmethylated and methylated Ins2 DNA during LFD and HFD feeding in C57BL/6J mice. A) Circulating unmethylated Ins2 DNA levels. B) Circulating methylated Ins2 DNA levels. C) AUC of unmethylated Ins2 DNA levels. D) AUC of methylated Ins2 DNA levels. Data are presented as means ± sem. *P < 0.05 for HFD compared with LFD or for LFD–STZ compared with LFD.
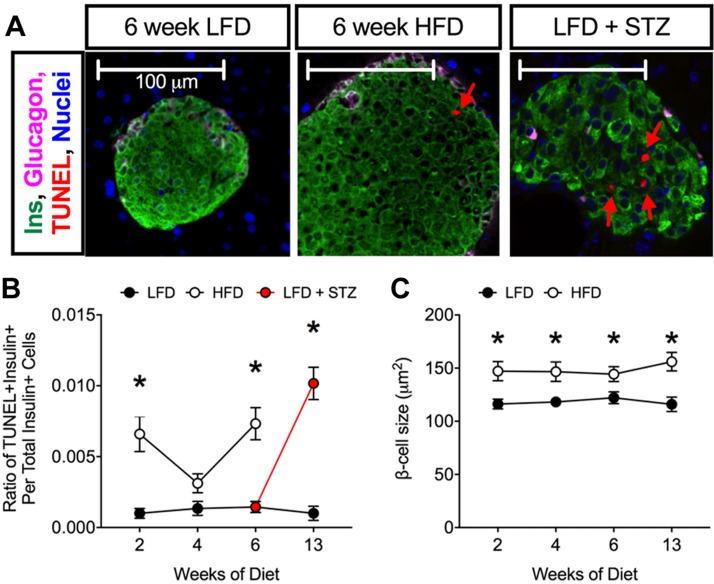
To correlate the serum β-cell death biomarker with a more-traditional cell death marker, tissue sections were stained for the TUNEL assay. As shown in Fig. 4A, B, STZ-treated mice exhibited increased β-cell death as evidenced by increased numbers of TUNEL + insulin+ cells. Increases in TUNEL + insulin+ cells were seen at 2 and 6 wk of HFD feeding, correlating to the same times at which we observed increases in unmethylated Ins2 by the DMD assay. Additionally, HFD feeding increased β-cell size (Fig. 4C).
Figure 4.
TUNEL staining during LFD and HFD feeding in C57BL/6J mice. A) Representative images of pancreata stained for insulin (green), glucagon (pink), TUNEL (red), and DAPI (blue). B) Ratio of TUNEL + insulin+ cells to total insulin+ cells; n = 4 mice for immunostaining, 5 sections/animal. C) Average β-cell size. P < 0.01 by 2-way ANOVA for the comparison of the HFD to LFD values in B. Data are presented as means ± sem. *P < 0.05 for HFD compared with LFD or for LFD–STZ compared with LFD.
β-cell dedifferentiation during the development of obesity and glucose intolerance
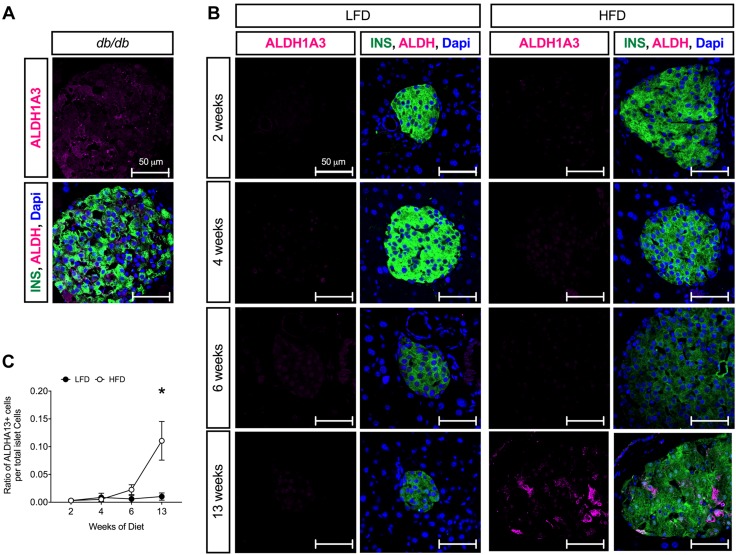
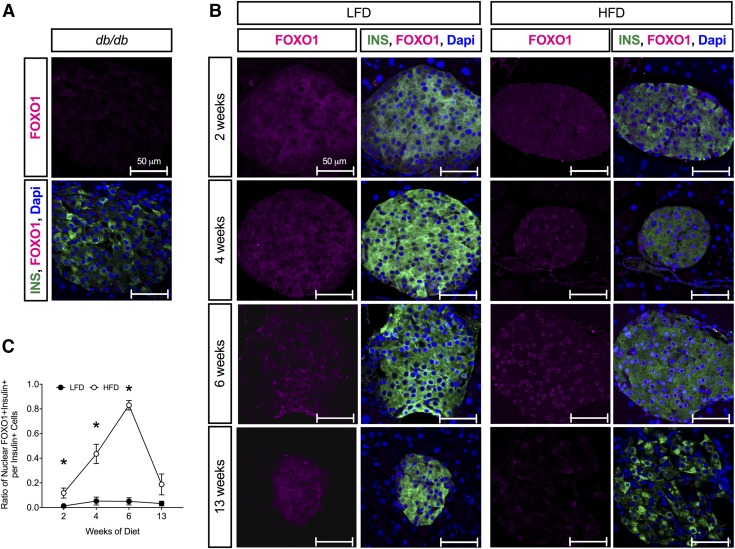
Prior studies suggested that β-cell dedifferentiation, rather than β-cell death, is the predominant feature of T2D in mice (7, 8). To determine whether β-cell dedifferentiation might also be a feature of progressive obesity and glucose intolerance in mice (pre-T2D), we immunostained pancreas tissue sections from HFD- and LFD-fed mice with the β-cell dedifferentiation marker ALDH1A3 (8, 9). As shown in Fig. 5A, ALDH1A3-positivity was evident in β cells of diabetic db/db mice, as previously described (7, 8). Although few ALDH1A3+ islet cells were evident at 6 wk after HFD initiation, by 13 wk after diet initiation ALDH1A3+ islet cells were evident (Fig. 5B, C). Very few ALDH1A3+ islet cells were evident at any experimental time point in LFD-fed animals. As a second marker of dedifferentiation, we also immunostained pancreas tissue sections with Foxo1. Nuclear translocation of Foxo1 is suggested to occur in a state of partial dedifferentiation, in which mild glucose intolerance/hyperglycemia is seen and is reduced or absent in dedifferentiated states (7). As shown in Fig. 6A, Foxo1 immunostaining is virtually absent in β cells of diabetic db/db mice. In LFD-fed animals, Foxo1 remains cytoplasmic at all time points (Fig. 6B, C); however, in the HFD-fed animals, nuclear Foxo1 was seen as early as 2 wk after diet initiation, and nearly 80% of β cells exhibited nuclear Foxo1 by 6 wk. By 13 wk after diet initiation, Foxo1 immunostaining was substantially reduced.
Figure 5.
ALDH1A3 immunostaining during LFD and HFD feeding in C57BL/6J mice. A) Representative images of pancreata stained for insulin (green), ALDH1A3 (magenta), and DAPI (blue) in 10 wk-old hyperglycemic C57BLK/J-db/db mice. B) Representative images of pancreata stained for insulin (green), ALDH1A3 (magenta), and DAPI (blue) in C57BL/6J mice fed a LFD or HFD at indicated times. C) Ratio of ALDH1A3+ islet cells to total islet cells; n = 4 mice for staining, 5 sections/animal. P < 0.05 by 2-way ANOVA for the comparison of the HFD to LFD values in C. Data are presented as means ± sem. *P < 0.05 for HFD compared with LFD.
Figure 6.
Foxo1 staining during LFD and HFD feeding in C57BL/6J mice. A) Representative images of pancreata stained for insulin (green), Foxo1 (magenta), and DAPI (blue) in 10 wk-old C57BLK/J-db/db mice. B) Representative images of pancreata stained for insulin (green), Foxo1 (magenta), and DAPI (blue) in C57BL/6J mice fed an LFD or HFD at indicated times. C) Ratio of nuclear Foxo1 + insulin+ cells to total insulin+ cells; n = 4 mice for staining, 5 sections/animal. P < 0.01 by 2-way ANOVA for the comparison of the HFD to LFD values in C. Data are presented as means ± sem. *P < 0.05 for HFD compared with LFD.
DISCUSSION
In this study, we applied the DMD assay and pancreas immunohistochemical analysis to assess β-cell death and dedifferentiation, respectively, in a mouse model of obesity-induced dysglycemia. Our studies showed that circulating unmethylated Ins2 increased episodically during the evolution of obesity and dysglycemia in mice, concurrent with histologic evidence of β-cell death, suggesting the occurrence of transient episodes of β-cell death. In addition, we also saw histologic evidence of β-cell dedifferentiation late in the evolution of pre-T2D.
Methylation at CpG sites is an epigenetic modification that is typically correlated with silencing of genes. By contrast, genes that are unmethylated at CpG sites tend to be actively expressed or have the potential to be activated (22). The mouse Ins2 gene is predominantly unmethylated at CpG site −182 bp in islet β cells, where its expression level is greatest. In other cell types, Ins2 is largely methylated at that site (19). Appearance of unmethylated Ins2 DNA in the circulation, therefore, is reflective of dying β cells. Our original description (14) of the DMD assay used real-time PCR to monitor relative unmethylation at the CpG position −182 bp from cell-free DNA liberated into the circulation from dying β cells. In this study, we have adapted our DMD assay for dPCR, which allows for greater precision in distinguishing DNA species with multiplex reactions and for reporting of absolute copies of DNA (rather than relative ratios) (18). We show that our dPCR-based DMD assay is linear, can quantitate mixtures of methylated and unmethylated Ins2 DNA, discriminates DNA arising from islets relative to other tissues, and reports β-cell death after STZ treatment of mice.
Loss of functional β-cell mass is believed to underlie virtually all forms of diabetes. In type 1 diabetes (T1D), absolute loss of β-cell mass through cell death is the primary mechanism. Studies from our group and others (12–15, 21, 22) using the DMD assay have shown evidence of active β-cell death either preceding diagnosis or at the time of diabetes diagnosis in both mice and humans. Unlike T1D, T2D is a more insidious disease, and the etiology of β-cell loss in T2D is less clear, although studies by Accili and colleagues (7–9) suggest that β-cell dedifferentiation (rather than death) may be the predominant mechanism both in overtly diabetic mice and, possibly, in humans. Evidence for either mechanism (β-cell death or dedifferentiation), however, is lacking in pre-T2D (obesity, dysglycemia). We report here that C57BL/6J mice fed an HFD exhibit transient β-cell death corresponding to time points at which glucose levels were first increased during GTTs and β-cell function was impaired (2 wk of feeding) and in unfed states (6 wk of feeding). Those elevations correlate to increases in the occurrence of TUNEL+/insulin+ cells in the pancreas of those animals, supporting the interpretation of the DMD assay. Notably, those findings in HFD-fed mice stand in contrast to those in nonobese diabetic mice (a model of T1D), in which unmethylated Ins2 DNA appears to remain persistently elevated during the prediabetic phase (14).
Cellular dedifferentiation has recently been suggested as a mechanism by which β-cell loss occurs in T2D (7, 9). It has been proposed that, during early metabolic stress, the transcription factor Foxo1 translocates from the cytoplasm to the nucleus, allowing for remediation of cellular stress responses (23). However, under conditions of persistent metabolic stress, β cells lose expression of Foxo1, leading to a reduction in insulin production and an increase in progenitor markers (23). We show here that, as early as 2 wk after HFD initiation, nuclear Foxo1 is present. By 13 wk, Foxo1 is substantially reduced. Additionally, we show that a marker of β-cell progenitors, ALDH1A3, is absent in the early phases of obesity and dysglycemia in HFD-fed mice (at 6 wk on diet) but becomes evident after more-persistent exposure to a HFD (13 wk on diet). Thus, β-cell dedifferentiation may be a late feature of obesity and dysglycemia, whereas β-cell death occurs earlier.
Recent studies have identified distinct subpopulations of β cells in mouse and human islets (24–27). The heterogeneity of β cells lends credence to the notion that different β cell populations (or subsets) may exhibit differing capacities for proliferation, stress responsiveness, and identity maintenance (28). Whether specific subpopulations of β cells are accountable for the cell death and dedifferentiation seen in our study is open to speculation, but our findings suggest the need to further interrogate the cellular subpopulations affected during the course of obesity and glucose intolerance. Finally, it should be emphasized that our studies in a popular, inbred mouse strain cannot be extrapolated to humans because genetic and cellular heterogeneity and slower timelines for disease progression in humans may limit the magnitude of the effects seen in mice. Nevertheless, dedifferentiation and apoptosis of β cells have been observed in humans with T2D (9, 29), and our findings suggest the need to apply a similar approach to study β-cell death and dedifferentiation in human populations with obesity and glucose intolerance.
ACKNOWLEDGMENTS
This work was supported by American Diabetes Association (ADA) Junior Faculty Award 7-13-JF-56 (to S.A.T.), a Lilly Research Awards Program grant (to R.G.M. and K.J.M.), U.S. National Institutes of Health (NIH) National Institute of Diabetes and Digestive and Kidney Diseases (NIDDK) Grants UC4 DK104166 (to R.G.M.) and T32 DK064466 (to E.M.L.), an American Physiological Society Porter Fellowship (to E.M.L.), grants from the George and Francis Ball Foundation and the Ball Brothers Foundation (to R.G.M.), and a Simmons Clinical Studies Fund grant (to R.G.M. and S.A.T.). This work used core services supported by NIH NIDDK Grant P30 DK097512 to the Indiana University School of Medicine. The content is solely the responsibility of the authors and does not necessarily represent the official views of the NIH. R.G.M. and K.J.M. received partial research support for this study from Eli Lilly and Co; T.B.F. and J.L.S. are employees of Eli Lilly and Co; K.B. is a former employee of Eli Lilly and Co.; and R.G.M. and S.A.T. have filed patent applications for assays to measure β-cell dysfunction and death.
Glossary
- ALDH1A3
aldehyde dehydrogenase 1 family member A3
- AUC
area under the curve
- CpG
cytosine–phosphate–guanine
- DMD
differentially methylated DNA
- dPCR
digital PCR
- Foxo1
forkhead box 01
- GTT
glucose tolerance test
- HFD
high-fat diet
- Ins2
insulin II
- LFD
low-fat diet
- STZ
streptozotocin
- T1D
type 1 diabetes
- T2D
type 2 diabetes
AUTHOR CONTRIBUTIONS
S. A. Tersey, E. M. Levasseur, F. Syed, T. B. Farb, K. S. Orr, J. B. Nelson, K. Bokvist, K. J. Mather, and R. G. Mirmira designed the research; S. A. Tersey, E. M. Levasseur, F. Syed, T. B. Farb, K. S. Orr, J. B. Nelson, J. L. Shaw, and R. G. Mirmira performed the research; S. A. Tersey, E. M. Levasseur, F. Syed, T. B. Farb, J. L. Shaw, K. Bokvist, K. J. Mather, and R. G. Mirmira, analyzed the data; S. A. Tersey and R. G. Mirmira wrote the manuscript; and all authors edited and approved the final draft of the manuscript.
REFERENCES
- 1.Ogihara T., Mirmira R. G. (2010) An islet in distress: β cell failure in type 2 diabetes. J. Diabetes Investig. 1, 123–133 [DOI] [PMC free article] [PubMed] [Google Scholar]
- 2.Kahn S. E., Prigeon R. L., McCulloch D. K., Boyko E. J., Bergman R. N., Schwartz M. W., Neifing J. L., Ward W. K., Beard J. C., Palmer J. P. (1993) Quantification of the relationship between insulin sensitivity and β-cell function in human subjects: evidence for a hyperbolic function. Diabetes 42, 1663–1672 [DOI] [PubMed] [Google Scholar]
- 3.Sims E. K., Hatanaka M., Morris D. L., Tersey S. A., Kono T., Chaudry Z. Z., Day K. H., Moss D. R., Stull N. D., Mirmira R. G., Evans-Molina C. (2013) Divergent compensatory responses to high-fat diet between C57BL6/J and C57BLKS/J inbred mouse strains. Am. J. Physiol. Endocrinol. Metab. 305, E1495–E1511 [DOI] [PMC free article] [PubMed] [Google Scholar]
- 4.Blandino-Rosano M., Barbaresso R., Jimenez-Palomares M., Bozadjieva N., Werneck-de-Castro J. P., Hatanaka M., Mirmira R. G., Sonenberg N., Liu M., Rüegg M. A., Hall M. N., Bernal-Mizrachi E. (2017) Loss of mTORC1 signalling impairs β-cell homeostasis and insulin processing. Nat. Commun. 8, 16014 [DOI] [PMC free article] [PubMed] [Google Scholar]
- 5.Hatanaka M., Maier B., Sims E. K., Templin A. T., Kulkarni R. N., Evans-Molina C., Mirmira R. G. (2014) Palmitate induces mRNA translation and increases ER protein load in islet β-cells via activation of the mammalian target of rapamycin pathway. Diabetes 63, 3404–3415 [DOI] [PMC free article] [PubMed] [Google Scholar]
- 6.Lakshmipathi J., Alvarez-Perez J. C., Rosselot C., Casinelli G. P., Stamateris R. E., Rausell-Palamos F., O’Donnell C. P., Vasavada R. C., Scott D. K., Alonso L. C., Garcia-Ocaña A. (2016) PKCζ is essential for pancreatic β-cell replication during insulin resistance by regulating mTOR and cyclin-D2. Diabetes 65, 1283–1296 [DOI] [PMC free article] [PubMed] [Google Scholar]
- 7.Talchai C., Xuan S., Lin H. V., Sussel L., Accili D. (2012) Pancreatic β cell dedifferentiation as a mechanism of diabetic β cell failure. Cell 150, 1223–1234 [DOI] [PMC free article] [PubMed] [Google Scholar]
- 8.Ishida E., Kim-Muller J. Y., Accili D. (2017) Pair feeding, but not insulin, phloridzin, or rosiglitazone treatment, curtails markers of β-cell dedifferentiation in db/db mice. Diabetes 66, 2092–2101 [DOI] [PMC free article] [PubMed] [Google Scholar]
- 9.Cinti F., Bouchi R., Kim-Muller J. Y., Ohmura Y., Sandoval P. R., Masini M., Marselli L., Suleiman M., Ratner L. E., Marchetti P., Accili D. (2016) Evidence of β-cell dedifferentiation in human type 2 diabetes. J. Clin. Endocrinol. Metab. 101, 1044–1054 [DOI] [PMC free article] [PubMed] [Google Scholar]
- 10.Chintinne M., Stangé G., Denys B., Ling Z. In ‘t Veld P., Pipeleers D. (2012) β cell count instead of β cell mass to assess and localize growth in β cell population following pancreatic duct ligation in mice. PLoS One 7, e43959. [DOI] [PMC free article] [PubMed] [Google Scholar]
- 11.Green D. R., Oguin T. H., Martinez J. (2016) The clearance of dying cells: table for two. Cell Death Differ. 23, 915–926 [DOI] [PMC free article] [PubMed] [Google Scholar]
- 12.Akirav E. M., Lebastchi J., Galvan E. M., Henegariu O., Akirav M., Ablamunits V., Lizardi P. M., Herold K. C. (2011) Detection of β cell death in diabetes using differentially methylated circulating DNA. Proc. Natl. Acad. Sci. USA 108, 19018–19023 [DOI] [PMC free article] [PubMed] [Google Scholar]
- 13.Fisher M. M., Watkins R. A., Blum J., Evans-Molina C., Chalasani N., DiMeglio L. A., Mather K. J., Tersey S. A., Mirmira R. G. (2015) Elevations in circulating methylated and unmethylated preproinsulin DNA in new-onset type 1 diabetes. Diabetes 64, 3867–3872 [DOI] [PMC free article] [PubMed] [Google Scholar]
- 14.Fisher M. M., Perez Chumbiauca C. N., Mather K. J., Mirmira R. G., Tersey S. A. (2013) Detection of islet β-cell death in vivo by multiplex PCR analysis of differentially methylated DNA. Endocrinology 154, 3476–3481 [DOI] [PMC free article] [PubMed] [Google Scholar]
- 15.Husseiny M. I., Kaye A., Zebadua E., Kandeel F., Ferreri K. (2014) Tissue-specific methylation of human insulin gene and PCR assay for monitoring β cell death. PLoS One 9, e94591 [DOI] [PMC free article] [PubMed] [Google Scholar]
- 16.Evans-Molina C., Robbins R. D., Kono T., Tersey S. A., Vestermark G. L., Nunemaker C. S., Garmey J. C., Deering T. G., Keller S. R., Maier B., Mirmira R. G. (2009) Peroxisome proliferator-activated receptorγ activation restores islet function in diabetic mice through reduction of endoplasmic reticulum stress and maintenance of euchromatin structure. Mol. Cell. Biol. 29, 2053–2067 [DOI] [PMC free article] [PubMed] [Google Scholar]
- 17.Maier B., Ogihara T., Trace A. P., Tersey S. A., Robbins R. D., Chakrabarti S. K., Nunemaker C. S., Stull N. D., Taylor C. A., Thompson J. E., Dondero R. S., Lewis E. C., Dinarello C. A., Nadler J. L., Mirmira R. G. (2010) The unique hypusine modification of eIF5A promotes islet β cell inflammation and dysfunction in mice. J. Clin. Invest. 120, 2156–2170 [DOI] [PMC free article] [PubMed] [Google Scholar]
- 18.Hindson C. M., Chevillet J. R., Briggs H. A., Gallichotte E. N., Ruf I. K., Hindson B. J., Vessella R. L., Tewari M. (2013) Absolute quantification by droplet digital PCR versus analog real-time PCR. Nat. Methods 10, 1003–1005 [DOI] [PMC free article] [PubMed] [Google Scholar]
- 19.Kuroda A., Rauch T. A., Todorov I., Ku H. T., Al-Abdullah I. H., Kandeel F., Mullen Y., Pfeifer G. P., Ferreri K. (2009) Insulin gene expression is regulated by DNA methylation. PLoSOne 4, e6953; erratum: 10.1371/annotation/947a8d4a-3585-4b23-ac84-b47a255a70d9 [DOI] [PMC free article] [PubMed] [Google Scholar]
- 20.Anderson E. K., Gutierrez D. A., Kennedy A., Hasty A. H. (2013) Weight cycling increases T-cell accumulation in adipose tissue and impairs systemic glucose tolerance. Diabetes 62, 3180–3188 [DOI] [PMC free article] [PubMed] [Google Scholar]
- 21.Gupta D., Jetton T. L., LaRock K., Monga N., Satish B., Lausier J., Peshavaria M., Leahy J. L. (2017) Temporal characterization of β cell-adaptive and -maladaptive mechanisms during chronic high-fat feeding in C57BL/6NTac mice. J. Biol. Chem. 292, 12449–12459 [DOI] [PMC free article] [PubMed] [Google Scholar]
- 22.Schübeler D. (2015) Function and information content of DNA methylation. Nature 517, 321–326 [DOI] [PubMed] [Google Scholar]
- 23.Kitamura T. (2013) The role of FOXO1 in β-cell failure and type 2 diabetes mellitus. Nat. Rev. Endocrinol. 9, 615–623 [DOI] [PubMed] [Google Scholar]
- 24.Dorrell C., Schug J., Canaday P. S., Russ H. A., Tarlow B. D., Grompe M. T., Horton T., Hebrok M., Streeter P. R., Kaestner K. H., Grompe M. (2016) Human islets contain four distinct subtypes of β cells. Nat. Commun. 7, 11756 [DOI] [PMC free article] [PubMed] [Google Scholar]
- 25.Rui J., Deng S., Arazi A., Perdigoto A. L., Liu Z., Herold K. C. (2017) β cells that resist immunological attack develop during progression of autoimmune diabetes in NOD mice. Cell Metab. 25, 727–738 [DOI] [PMC free article] [PubMed] [Google Scholar]
- 26.Wang Y. J., Schug J., Won K. J., Liu C., Naji A., Avrahami D., Golson M. L., Kaestner K. H. (2016) Single-cell transcriptomics of the human endocrine pancreas. Diabetes 65, 3028–3038 [DOI] [PMC free article] [PubMed] [Google Scholar]
- 27.Wang Y. J., Golson M. L., Schug J., Traum D., Liu C., Vivek K., Dorrell C., Naji A., Powers A. C., Chang K. M., Grompe M., Kaestner K. H. (2016) Single-cell mass cytometry analysis of the human endocrine pancreas. Cell Metab. 24, 616–626 [DOI] [PMC free article] [PubMed] [Google Scholar]
- 28.Gutierrez G. D., Gromada J., Sussel L. (2017) Heterogeneity of the pancreatic beta cell. Front. Genet. 8, 22 [DOI] [PMC free article] [PubMed] [Google Scholar]
- 29.Butler A. E., Janson J., Soeller W. C., Butler P. C. (2003) Increased β-cell apoptosis prevents adaptive increase in β-cell mass in mouse model of type 2 diabetes: evidence for role of islet amyloid formation rather than direct action of amyloid. Diabetes 52, 2304–2314 [DOI] [PubMed] [Google Scholar]


